Báo cáo hóa học: " A quantitative real time PCR method to analyze T cell receptor Vb subgroup expansion by staphylococcal superantigens" doc
Bạn đang xem bản rút gọn của tài liệu. Xem và tải ngay bản đầy đủ của tài liệu tại đây (498.02 KB, 9 trang )
METH O D O LOG Y Open Access
A quantitative real time PCR method to analyze
T cell receptor Vb subgroup expansion by
staphylococcal superantigens
Keun Seok Seo
1
, Joo Youn Park
2
, David S Terman
3
, Gregory A Bohach
1*
Abstract
Background: Staphylococcal enterotoxins (SEs), SE-like (SEl) toxins, and toxic shock syndrome toxin-1 (TSST-1),
produced by Staphylococcus aureus, belong to the subgroup of microbial superantigens (SAgs). SAgs induce clonal
proliferation of T cells bearing specific variable regions of the T cell receptor b chain (Vb). Quantitative real time
PCR (qRT-PCR) has become widely accepted for rapid and reproducible mRNA quantification. Although the
quantification of Vb subgroups using qRT-PCR has been reported, qRT-PCR using both primers annealing to
selected Vb nucleotide sequences and SYBR Green I reporter has not been applied to assess Vb-dependent
expansion of T cells by SAgs.
Methods: Human peripheral blood mononuclear cells were stimulated with various SAgs or a monoclonal
antibody specific to human CD3. Highly specific expansion of Vb subgroups was assessed by qRT-PCR using SYBR
Green I reporter and primers corresponding to selected Vb nucleotide sequences.
Results: qRT-PCR specificities were confirmed by sequencing amplified PCR products and melting curve analysis.
To assess qRT-PCR efficiencies, standard curves were generated for each primer set. The average slope and R
2
of
standard curves were -3.3764 ± 0.0245 and 0.99856 ± 0.000478, respectively, demonstrating that the qRT-PCR
established in this study is highly efficient. With some exceptions, SAg Vb specificities observed in this study were
similar to those reported in previous studies.
Conclusions: The qRT-PCR method established in this study produced an accurate and reproducible assessment of
Vb-dependent expansion of human T cells by staphylococcal SAgs. This method could be a useful tool in the
characterization T cell proliferation by newly discovered SAg and in the investigation of biological effects of SAgs
linked to pathogenesis.
Background
The a/b T cell r eceptor (TCR) is composed of a and b
chain heterodimers which recognize antigen-derived
peptide bound to major histocompatibility complex
(MHC) molecules on antigen presenting cells (APCs)
[1]. During thymocyte development, the genes encoding
the b chain undergo somatic recombinatio n of va riable
(V), diversity (D), joining (J), and constant (C) genes.
Combinatorial joining of V-J and V-D-J region gene seg-
ments generates diversity with in the TCR b chain com-
plementarity determining region (CDR) 3 loop [2,3].
Combinatorial diversity is further increased by imprecise
joining of VDJ recombination and inserti on of palindro-
mic nucleotides at a specific point within the VD, DJ,
and VJ junctions [4]. As a result, each T cell clone
expresses a unique variabl e region of TCR b chain (Vb)
[5]. Generally, the CDR1 and CDR2 sequences within
the TCR molecule, encoded by V g ene segments, inter-
act with the a helix of the MHC molecule [6]. TCR
CDR3 sequences, encoded by V(D)J junction gene seg-
ments, interact with the antigenic peptide associated
with MHC, resulting in clonal T cell proliferation [6].
Staphylo cocc al enterotoxins (SEs), SE-like (SEl) toxins
and toxic shock syndrome toxin-1 (TSST-1), produced
by Staphylococcus aureus, are prototypic microbial
superantigens (SAgs). Members of this toxin subgroup
* Correspondence:
1
Department of Microbiology, Molecular Biology and Biochemistry, University
of Idaho, Moscow, ID 83844, USA
Seo et al. Journal of Translational Medicine 2010, 8:2
/>© 2010 Seo et al; licensee BioMed Central Ltd. This is an Open Access article distributed under the terms of the Creative Commons
Attribution License ( which permits unrestr icted use, distribution, and reproduction in
any medium, provided the original work is properly cited.
are implicated in staphylococcal food poisoning and
toxic shock syndrome [7]. SEl toxins have been shown
to lack emetic properties in primates or have not yet
been tested [8]. For many years, five antigenically dis-
tinct classic SEs (SEA, SEB, SEC, SED, and SEE) and
molecular variants of SEC (SEC1, SEC2, and SEC3) were
recognized [7]. Through improvements in genomic ana-
lysistools,novelSEsandSEltoxinsincludingSEG,
SElH, SEI, SElJ, SElK, SElL, SElM, SElO, SElP, SElQ,
SElR, and SElU and four molecular var iants (SEGv,
SEIv, SElNv, and SElUv) have been discovered [7,9]. In
contrast to conventional antigens,mostSAgsbindout-
side the peptide binding groove of MHC II, and to spe-
cific Vb sequences [9]. This interaction triggers an
activation of pho spholipase C and phosphokinase C
pathways [10], leading to a massive production of proin-
flammatory cytokines including interleukin-2 and inter-
feron-g [11], resulting in extensive proliferation of T
cells bearing specific Vb subgroups[11].Asaresult,it
is possible to characterize SAgs on the basis of their Vb
profiles [7].
Several approaches are used to qua ntify the expansion
of Vb subgroups including northern blotting, semi-
quantitative PCR using radioisotope conjugated prob es
[12], or fluorescence activated cell sorting (FACS) using
monoclonal antibodies (mAb s) specific to Vb subgroups
[13,14]. Recently, quantitative real time PCR (qRT-PCR)
has become widely accepted for rapid and re producible
quantification of gene expression. Most previous
attempts to quantify Vb expression using qRT-PCR
used one primer located at the gene encoding TCR con-
stant region of b chain (Cb) and the other primer or
fluorogenic probe located within the gene encoding the
V region [15,16]. More importantly, previous qRT-PCR
methods have been applied to samples displaying expan-
sion of limited numbers of Vb subgroups [16]. In this
study, we developed a new qRT-PCR method using Vb
subgroup specific primers within the gene encoding the
V region to increase specificity and SYBR Green I to
curtail the cost of the assay. This technique was applied
to human mononuclear cell cultures stimulated with
various SAgs, which have unique Vb specificities,
though overlapping so that the entire repertoire of Vb
subgroups could be evaluated using this method.
Materials and methods
Toxin production and purification
SEB, SEC1 and TSST-1 were purified from cultures of S.
aureus MNHOCH, S. aureus RN4220 (pMIN121) and S.
aureus RN4220 (pCE107), respectively, using preparative
isoelectric focusing as described previously [17-19].
Other toxins used in this study were produced in
recombinant form using SE genes cloned in this study
as follows. A DNA fragment encoding SEA, SED, SEE,
SEG, SEI, SElM, SElN, or SElO was amplified from
genomic DNA derived from S. aureus FRI 913 or FRI
472 using primers listed in Table 1[20]. Amplified DNA
fragments were digested with NdeI and BamHI or XhoI
and ligated into corresponding sites is pET-15b (Nova-
gen, San Diego, California, USA). Recombinant SE pro-
teins were expressed in E. coli BL21 (DE3) (pLysS) and
purified using the His-Bind Purification Kit (Novagen)
as suggested by the manufacturer.
Preparation and stimulation of enriched human
lymphocytes
Peripheral blood mo nonucl ear cells (PBMCs) were iso-
lated from three healthy donor venous blood. Heparin-
treated (14 U/ml blood) blood was fractionated by gradi-
ent centrifugation ov er Ficoll-Paque Plus (GE Health-
care, Piscataway, New jersey, USA) as described
previously [17]. The PBMCs were washed and resus-
pended in RPMI 1640 medium (Life technologies,
Gaithersburg, Maryland, USA) supplemented with 2%
FBS, 100 U penicillin G, and 100 μg/ml streptomycin.
The cultures were maintained in cell culture Petri dishes
(Falcon, Lincoln Park, New Jersey) overnight at 37°C
and in 5% CO
2
. Non-adherent lymphocyte-enriched
PBMCs were collected, washed, and resuspended at a
final concentration of 2.5 × 10
6
cells/ml. Each SAg (0.5
μg/ml) or a murine mAb specific to human CD3 (33
ng/ml; Sigma, St. Louis, Missouri, USA) was added to
lymphocyte enriched PBMC cultures (3 ml aliquots).
Cultures were maintained for 4 days (37°C, 5% CO
2
).
Table 1 List of primers used to clone SE and SEl genes.
SE name GenBank access number Forward primer (’5to3’) Reverse primer (’5to3’)
SEA M18970 cttgtacatatgagcgagaaaagcgaagaa gcgcggatccttaacttgtatataaata
SED M28521 cgttctcgagaatgaaaacattgattc cgcgctcgagctacttttcatataaata
SEE M21319 ggtagccatatgagcgaagaaataaatgaa gcgcggatcctcaagttgtgtataaata
SEG AF064773 tgtgcatatgcaacccgatcctaaatta gcgcggatcctcagtgagtattaaga
SEI AF285760 tgctctcgaggatattggtgtaggtaac cgcgctcgagttagttactatctacata
SElM AF285760 cgcacatatggatgtcggagttttgaat gcgcggatcctcaactttcgtccttata
SElN AF285760 aatgctcatatggacaaaaaagatttaaag gcgcggatccttaatctttatataaaa
SElO AF285760 tgcactcgagaatgaagaagatcctaaa cgcgctcgagttatgtaaataaataaac
Seo et al. Journal of Translational Medicine 2010, 8:2
/>Page 2 of 9
Basal levels of Vb expansion were assessed with unsti-
mulated control cultures.
Quantitative RT-PCR (qRT-PCR)
Total RNA was extracted from approximately 5 × 10
6
cells using Trizol (Life Technologies). Superscript II
reverse transcriptase (Life Technologies) was used to
generate cDNA using 1 μg of RNA and oligo dT primer,
according to the manufacturer’s instructions. To pro-
mote highly specific amplification, two primers specific
for each of the various Vb subgroups were annealed to
selected Vb nucleotide sequences. All Vb specific and
Cb primers were designed using Primer Express version
2.0 (Applied Biosystems, Foster City, C alifornia, USA)
and are listed in Table 2. We used the Vb subgroup
nomenclature of Arden et al [21].
To verify primer specificities, melting curve analyses
(below) and PCR product sequencing were performed.
For sequencing, PCR reactions were conducted without
SYBR Green I using cDNA generated from cultures sti-
mulated CD3-specific mAb. PCR products were purified
using a PCR purification kit (Qiagen, Valencia, Califor-
nia, USA) and then cloned into pCR2.1 vector (Life
Technologies). Transformants (10 to 25 colonies) were
randomly selected and the cloned gene fragments were
sequenced using an ABI Prism 3100 Genetic Analyzer
(Applied Biosystems).
Standard curves were generated for each gene to eval-
uate primer efficiency and for data analysis. Concentra-
tions of purified PCR products were determined by
measuri ng the absorbance at 260 nm using a Nanodrop
(Thermo Scientific, Wilmington, Delaware, USA) and
expressed as the number of DNA copies/ml using stan-
dard procedures [22,23]. The qRT-PCR was performed
(below) on serially diluted PCR products (2.5 - 2.5 × 10
5
copies/reaction) using ABI Prism 7500 (Appli ed Biosys-
tems) in triplicate and was repeated in at least three
separate experiments. Standard curves were generated
by plotting the C
T
vs. the log
10
copies
of serially diluted
PCR products. The slope, intercept, and correlation
coefficient (R
2
) were determined by linear regression
analysis using Microcal OriginPro Version 7.5 (Origi-
nLab, Northampton, Massachusetts, USA).
The qRT-PCR was performed in triplicate and was
repeated in at least three separate experiments using
the following conditions. Reaction mixtures contained
12.5 μl of SYBR Green I dye master mix (Applied Bio-
systems), 2 pmoles each of forward and reverse
Table 2 List of qRT-PCR primersa and amplified Vb gene(s).
Primer name GenBank access number Forward primer (’5to3’) Reverse primer (’5to3’) Amplified Vb gene(s)
b
Cb L36092 tccagttctacgggctctcg gacgatctgggtgacgggt
VB1 L36092 ggagcaggcccagtggat cgctgtccagttgctggtat TCRVB1s1
VB2 M11955 gagtctcatgctgatggcaact tctcgacgccttgctcgtat TCRVB2s1
VB3 U08314 tcctctgtcgtgtggccttt tctcgagctctgggttactttca TCRVB3s1
VB4 L36092 ggctctgaggccacatatgag ttaggtttgggcggctgat TCRVB4s1
VB5 L36092 gctccaggctgctctgttg tttgagtgactccagcctttactg TCRVB5s1, 5s3
VB6 X61440 ggcagggcccagagtttc gggcagccctgagtcatct TCRVB6s1, 6s2, 6s3, 6s4, 6s5, 6s6
VB7 U07977 aagtgtgccaagtcgcttctc tgcagggcgtgtaggtgaa TCRVB7s1, 7s2, 7s3
VB8 X07192 tgcccgaggatcgattctc tctgagggctggatcttcaga TCRVB8s1, 8s2, 8s3
VB9 U07977 tgcccgaggatcgattctc tctgagggctggatcttcaga TCRVB9s1
VB11 L36092 catctaccagaccccaagatacct atggcccatggtttgagaac TCRVB11s1
VB12 U03115 gttcttctatgtggccctttgtct tcttgggctctgggtgattc TCRVB12s1, 12s3
VB13A L36092 tggtgctggtatcactgaccaa ggaaatcctctgtggttgatctg TCRVB13s1, 13s6
VB13B X61445 tgtgggcaggtccagtga tgtcttcaggacccggaatt TCRVB13s2, 13s9
VB14 L36092 gctccttggctatgtggtcc ttgggttctgggtcacttgg TCRVB14s1
VB15 M11951 tgttacccagaccccaagga tgacccttagtctgagaacattcca TCRVB15s1
VB16 X06154 cggtatgcccaacaatcgat caggctgcaccttcagagtaga TCRVB16s1
VB17 U48260 caaccaggtgctctgctgtgt gactgagtgattccaccatcca TCRVB17s1
VB18 L36092 ggaatgccaaaggaacgattt tgctggatcctcaggatgct TCRVB18s1
VB20 L36092 aggtgccccagaatctctca ggagcttcttagaactcaggatgaa TCRVB20s1
VB21 M33233 gctgtggctttttggtgtga caggatctgccggtaccagta TCRVB21s1
VB22 L36092 tgaaagcaggactcacagaacct tcacttcctgtcccatctgtgt TCRVB22s1
VB23 U03115 ttcagtggctgctggagtca cagagtggctgtttccctcttt TCRVB23s1
VB24 U03115 acccctgataacttccaatcca cctggtgagcggatgtcaa TCRVB24s1
a
The pseudogenes (Vb10 and Vb19) were not included in this study.
b
Vb subgroup nomenclature followed the classification of Arden et al. [21].
Seo et al. Journal of Translational Medicine 2010, 8:2
/>Page 3 of 9
primers, and 5 μl of 100 times diluted cDNA. Thermo-
cycle conditions included initial denaturation at 50°C
and 95°C (10 min each), followed by 40 cycles at 95°C
(15 s) and 60°C (1 min). Fluorescent data were
acquired during each extension phase. After 40 cycles,
a melting curve was generated by slowly increasing
(0.1°C/s) the temperature from 60°C to 95°C, while the
fluorescence was measured. The threshold cycle (C
T
)
was calculated using the Sequence Detector Systems
version 1.2.2 (Applied Biosystems) by determining the
cycle number at which the change in the fluorescence
of the reporter dye (ΔRn) crossed the threshold. To
synchronize each experiment, the baseline was set
automatically by the s oftware. To rule out DNA con-
tamination in the RNA preparations, the qRT-PCR
controls were performed with RNA templates which
did not show any amplification.
Data analysis
Calculations to determine the extent of Vb expansion
were done as described by ca lculating the absolute copy
number of each Vb and Cb.Briefly,theC
T
for each Vb
and Cb was converted into absolute copy number by
extrapolation from its standard curve (above). The per-
centage of each Vb (%Vb) in the culture was calculated
by following equation, where n represents each Vb sub-
group observed in this study. These values have to be
considered as exploratory:
%V
V
n
C
n
100
Selective expansion of Vbs in the culture stimulated
with SAgs was determined when each %Vb from the
cultures stimulated with SAgs was significantly higher
than the corresponding %Vb from the control cultures
(without stimuli) by paired t-test (p < 0.001) using SAS
statistical software (version 9.0, SAS Institute Inc., Cary,
North Carolina, USA).
Results
Sensitivity and efficiency of the qRT-PCR
cDNA was generated from cultures stimulated with a
CD3-speci fic mAb, amplified by PCR using primers spe-
cific for Vb,Cb,andG3PDHgenes.Standardcurves
were generated using the pu rified PCR products. Repre-
sentativeresultsfromaCb primer-based reaction are
shown in Figure 1A. The qRT-PCR could detect ≤25
copies of Cb PCR product s without detectable variation
among triplicate reactions (Figure 1A). The slope and
correlation coefficient (R
2
) of standard curves are used
to determine primer efficiency and standard curve valid-
ity, respectively. Results obtained with the Cb reaction
are representative data showing the slope for Cb
reaction was -3.38 with R
2
value of 0.9986 (Figure 1B).
The slope and R
2
value of standard curves for other
reactions are listed in Table 3.
Specificity of the qRT-PCR
qRT-PCR specificities were assessed by melting curve
analysis and sequencing of amplified PCR products.
Melting curves of the qRT-PCR reactions observed for
Vb subgroups consisting of a single gene, as well as
G3PDH and Cb genes, showed single peak. A represen-
tative result obtained for Vb1isshowninFigure1C.
The melting curve for the Vb1 reaction contained a sin-
gle peak at 78°C. Melt ing curves for Vb subgroups con-
sisting of multiple subgroup genes (Vb7, 12, 13A, and
17) showed multiple peaks due to the expected hetero-
geneity in amplified gene fragments. Representative
results for Vb17 are shown in Figure 1D. qRT-PCR for
Vb17, which contains three subgroup genes produced a
melting curve with three peaks as expected. However,
some Vb subgroups consisting of multiple subgroup
genes (Vb5, 6, 8, 13 B, and 21) showed only a singl e
peak (data not shown). To identify whether primers
designed for these Vb subgroups amplified the targeted
subgroup genes, PCR products were cloned and
sequenced. This revealed that, except for Vb21, the pri-
mers amplified multiple Vb subgroup genes within the
targeted Vb subgroup (Table 2). No untargeted
sequences were generated. We also analyzed the ampli-
fied PCR products using agarose gel electrophoresis and
confirmed that there was no non-specific amplification
other than expected size of amplification product (data
not shown).
Quantification of Vb expansion
To assess the basal expression level, the percentage of
each Vb (%Vb) in cultures without stimuli was calcu-
lated (Figure 2; unst imulated panel). Similarly, the
expression of e ach Vb subgroup gene was determined
for cultures stimulated with anti-CD3 mAb or various
SAgs. Selective expansion of T cells bearing certain Vb
subgroups was considered to be significant when the %
Vb in the stimulated cultures was elevated at a statisti-
cally significant level (p < 0.05). There was no significant
difference among levels observed in cultures stimulated
with the anti-CD3 mAb and unstimul ated culture s (Fig-
ure 2). In contrast, t he pattern of Vb expression in cul-
tures stimulated with various SAgs showed a distinct
expansion of T cells bearing certain Vb subgroups (Fig-
ures3,Table4).ThedataindicatethateachVb sub-
group was expanded by one or more SAgs used in this
study. As shown in Table 4, the Vb specificities of SAgs
observed in this study were very similar to those
described in previous studies with minor variation as
discussed below [7,11,12,24-26].
Seo et al. Journal of Translational Medicine 2010, 8:2
/>Page 4 of 9
Discussion
More than 67 different human Vb genes, of which a
quarter are pseudogenes, have been have been cloned
and sequenced [2,21,27]. These studies confirmed the
existenceof49functionalVb genes within 24 different
Vb subgroups. Due to the heterogeneity, some of the 24
Vb subgroups consist of multiple subgroup genes. In
this study, we designed two primers annealing to each
of 22 different Vb subgroups (36 Vb genes) to quantify
expansion of T cell bearing specific Vb subgroups and
subgroup genes in response to SAgs.
One of the important factors that affect the validity of
qRT-PCR is the efficiency of primers. The primers used
in qRT-PCR sho uld have uniform and high efficiency to
achieve a valid quantification. The efficiency and linear-
ity of primers could be assessed by analyzing the slope
and R
2
value of the standard curve, respectively. In the-
ory, the slo pe should be close to -3.32 with an optimal
efficiency when 10-fold serially diluted templates were
used. The average slope and R
2
of standard curves for
all primers used in qRT-PCR was -3.3764 ± 0.0245 and
0.99856 ± 0.000478, respectively. Th is suggests that all
0123456
16
18
20
22
24
26
28
30
32
34
36
38
C
T
Log
Copies
Delta Rn
4
0
1
2
3
18 21 24 27 30 33 3903 6 9 635121
Cycle number
0.16
0.00
0.04
0.08
Derivative
60 65 70 75 80 85 90 95
0.12
Temperature
0.16
0.00
0.04
0.08
Derivative
0.12
0.20
0.24
60 65 70 75 80 85 90 95
Temperature
AB
CD
y=-3.38x+36.45
R
2
=0.9986
2.5 10
5
2.5
NTC
Threshold
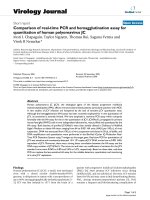
Figure 1 The specificity, sensitivity, and reproducibility of qRT-PCR. The qRT-PCR was performed using a ten-fold dilution series (2.5 × 10
5
to 2.5 copies/reaction) of purified PCR product. Results shown are from a single representative experiment that was conducted three times. (A)
The qRT-PCR successfully amplified the ten-fold dilution series of template (2.5 × 10
5
to 2.5 copies/reaction; from left to right). The non-template
control (NTC) showed no amplification. The threshold was automatically set by Sequence Detector Systems version 1.2.2 software to synchronize
among experiments. The threshold cycle (C
T
) was determined by the cycle number at which the change in the fluorescence of the reporter dye
(delta Rn) crossed the threshold; (B) The standard curve was generated by plotting the C
T
vs the number of purified PCR product copies
(Log
copies
). The slope and correlation coefficient (R
2
) were -3.38 and 0.9986, respectively; (C) Melting curve analysis for the Vb1 subgroup consist
of single subgroup gene and showed a single peak at 78 oC; (D) Melting curve analysis for the Vb17 subgroup consisting of three subgroup
genes showed multiple peaks, consistent with the expected heterogeneity among amplified products.
Seo et al. Journal of Translational Medicine 2010, 8:2
/>Page 5 of 9
primers used in qRT-PCR have uniform and high effi-
ciency and linearity.
The specificity of qRT-PCR using SYBR Green I plat-
form was often determined by analyzing melting curves.
In this study, the specificities of each primer set were
determined by analyzing melting curves and sequencing
amplified PCR products. Melting curve analysis and
sequencing amplified PCR products of reactio ns for, Cb
and Vb subgroups consisting of a single subgroup
showed a single peak and a single specific amplification.
As expected, some Vb subgroups comprised of multiple
subgroup genes (Vb7, 12, 13A, and 17) showed a corre-
sponding number of peaks. However, some Vb sub-
groups comprised of multiple subgroup genes (Vb5, 6,
8, 13B, and 21) showed only a single peak. The
sequence analysis of amplified PCR products for Vb5, 6,
8, 13B, and 21 subgroups revealed that multiple sub-
group genes were amplified. For example, the Vb6sub-
group, consisting of 6 functional subgroup genes with >
87.9% sequence similarity to each other, showed a single
peak in melting curve analysis, though the sequence
analysis of amplified PCR product showed that all 6
functional subgroup genes were amplified. The resolu-
tion of these into a single peak probably due to a high
level nucleotide sequence similarity among subgroup
genes resulting in an identical meting temperature of
amplified gene fragments. The identity of all sequenced
PCR products matched with corresponding subgroups
Table 3 Standard curve slopes, Y axis intercepts and
correlation coefficients (R
2
)
Primers Slope Y axis intercept Correlation coefficient (R
2
)
Cb -3.38 36.45 0.9986
VB1 -3.39 36.54 0.9977
VB2 -3.36 36.38 0.9982
VB3 -3.41 36.57 0.9987
VB4 -3.37 36.62 0.9984
VB5 -3.35 36.33 0.9976
VB6 -3.40 36.53 0.9978
VB7 -3.36 36.43 0.9983
VB8 -3.37 36.40 0.9986
VB9 -3.38 36.49 0.9985
VB11 -3.41 36.52 0.9986
VB12 -3.42 36.53 0.9972
VB13A -3.34 36.34 0.9978
VB13B -3.41 36.54 0.9974
VB14 -3.36 36.33 0.9981
VB15 -3.35 36.44 0.9976
VB16 -3.37 36.44 0.9984
VB17 -3.39 36.53 0.9982
VB18 -3.35 36.44 0.9986
VB20 -3.33 36.39 0.9973
VB21 -3.36 36.38 0.9986
VB22 -3.39 36.47 0.9981
VB23 -3.37 36.43 0.9980
VB24 -3.41 36.53 0.9984
V families
V
families
Unstimulated
Anti-CD3
VB1
VB2
VB3
VB4
VB5
VB6
VB7
VB8
VB9
VB11
VB12
VB13A
VB13B
VB14
VB15
VB16
VB17
VB18
VB20
VB21
VB22
VB23
VB24
0
2
4
6
8
10
12
14
16
18
20
22
24
26
28
30
%V
VB1
VB2
VB3
VB4
VB5
VB6
VB7
VB8
VB9
VB11
VB12
VB13A
VB13B
VB14
VB15
VB16
VB17
VB18
VB20
VB21
VB22
VB23
VB24
0
2
4
6
8
10
12
14
16
18
20
22
24
26
28
30
%V
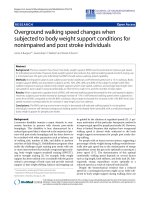
Figure 2 Vb subgroup representation (%Vb) in unstimulated cultures and in cultures stimulated with a CD3-specific mAb.%Vbs (mean
± S.E.M.) in cultures prior to stimulation or cultures of the same cell preparations after four days in the presence of the mAb. There was no
significant differences in %Vbs calculated for either condition (p < 0.05). Results shown are the mean ± S.E.M. of three sets of triplicates
combined from three experiments (n = 9).
Seo et al. Journal of Translational Medicine 2010, 8:2
/>Page 6 of 9
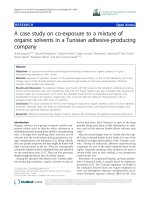
Figure 3 Distribution of %Vb in the culture s stimulated with SAgs. Non-adherent lymphocyte-enrich ed PBMCs were stimulated with SAgs
(final concentration at 5 μg/ml) for 4 days. The %Vbs were calculated and were presented as the mean ± S.E.M. Asterisks indicate a significant
increase in %Vb compared to cultures without stimuli (p < 0.05). Results shown are the means ± S.E.M. of three sets of triplicates combined from
three experiments (n = 9). A) Classic SEs and TSST-1. B) Novel SEs and SEls.
Table 4 Comparison of Vb specificity observed in this study with those in selected previous studies.
SAgs Vb specificity observed in this study Vb specificity observed in previous studiesa References
SEA Vb1, 5, 6, 7, 15, 16, 18, 21, 22, 24 Vb1, 5, 6, 7, 9, 16, 18, 21 [24]
SEB Vb3, 12, 13B
b
, 14, 15, 17, 20 Vb1, 3, 6, 12, 13.2, 15, 17, 20 [11]
SEC1 Vb3, 12, 13B, 14, 15, 17, 20 Vb3, 12, 13.2, 14, 15, 17, 20 [12]
SED Vb1, 3, 5, 8, 9, 12, 14 Vb1, 5, 6, 7, 8, 12 [7,25]
SEE Vb5, 6, 8, 9, 13Ac, 16, 18 Vb5, 6, 8, 13.1, 18, 21 [11,24]
SEG Vb3, 12, 13A, 13B, 14, 15 Vb3, 12, 13, 14 [26]
SEI Vb1, 5, 6, 23 Vb1, 5, 6, 23 [26]
SElM Vb6, 8, 9, 18, 21 Vb6, 8, 9, 18, 21 [26]
SElN Vb7, 8, 9, 17 Vb9 [26]
SElO Vb5, 7 Vb5, 7, 22 [26]
TSST-1 Vb2Vb2 [11]
a
Vb specificities were results from previous studies using semi-quantitative PCR or FACS methods.
b
Vb13B corresponds to Vb13.2 in previous studies.
c
Vb13A corresponds to Vb13.1 in previous studies.
Seo et al. Journal of Translational Medicine 2010, 8:2
/>Page 7 of 9
of Vb subgroups and revealed that 36 out of 49 func-
tional Vb subgroup genes were amplified. It suggests
that primers used in this study were highly specific to
targeted Vb subgroup.
In this study, we used various SAgs showing similar
and/or unique Vb specificities covering the entire reper-
toire of human Vb subgroups. The qRT-PCR showed
that every Vb subgroup was expanded in this study. A s
showninTable4,theVb specificities of SAgs observed
in this study was ver y simi lar to those described in pre-
vious studies with minor variation [7,11,12,24-26]. In
this study, newly identified Vb specificities were
observed for some SAgs such as SEA (Vb15, 22, and
24), SEB (Vb 14), S ED (Vb3, 9, and 14), SEE (Vb9and
16), SEG (Vb15), and SElN (Vb7, 8, and 17). Also, some
Vb previously reported specificities were not observed
for some SAgs such as SEB (Vb1and6),SED(Vb6and
7), SEE (Vb21), and SElO (Vb22). These discrepancies
mightbeexplainedbythedifferencesinthereposeto
SAgs among humans or differences in techniques (PCR,
flow cytometry), or the lack of reagents at the time of
previous studies. For example, the Vb specificity of
some SAgs in two previous studies was determined by
semi-quantitative PCR using primers specific to Vb1
through Vb20 [11,12]. This present s tudy incorporated
primers specific to Vb21 through Vb24. However, it is
noteworthy that Vb subgroups most prominently
expanded by each SAg observed in this study were iden-
tical to those observed in previous studies.
Conclusion
In this report, we developed an assay to quantify the
expansion of human Vb subgroups using qRT-PCR. The
specificity and efficiency of the method were evaluated
by generating standard curves for each primer set. The
validity of the metho d was assessed by analyzing the Vb
specificity of various SAgs which combined, interact
with Vb repertoires covering all known Vb subgroups.
Our results demonstrate that the method established in
this study is accurate, sensitive, and highly reproducible.
This qRT-PCR method could also be used to character-
ize novel SAgs, to determine complete profiles of cur-
rently known SAgs, and to help understand the role of
T cells bearing specific Vbs in certain diseases such as
neoplastic expansion of large granular lymphocytes, T
cell non-Hodgkin’ s lymphoma [28,29] as well as some
immune disorders associatedwithSAgssuchasimmu-
nosuppression, Kawasaki disease, and atopy [30-32].
Acknowledgements
This work was supported by the grants from the National Institutes of
Health Grants (P20 RR15587, P20 RR016454, and U54AI57141), the USDA NRI
grant (2008-892) and the Idaho Agricultural Experimental Station.
Author details
1
Department of Microbiology, Molecular Biology and Biochemistry, University
of Idaho, Moscow, ID 83844, USA.
2
Department of Veterinary Medicine,
Washington State University, Pullman, WA 99164, USA.
3
Jenomic, Inc, Carmel,
CA, USA.
Authors’ contributions
KSS developed the basic assay and performed most experiments including
cloning, protein purification, cell preparation and stimulation, qRT-PCR, and
data analysis. JYP helped to perform qRT-PCR and interpret data. DST
provided some toxins and input into general experimental strategy. GAB
assisted in experimental design and helped to interpret data and draft the
manuscript. All authors read and approved the final manuscript.
Competing interests
The authors declare that they have no competing interests.
Received: 1 July 2009
Accepted: 13 January 2010 Published: 13 January 2010
References
1. Davis MM, Boniface JJ, Reich Z, Lyons D, Hampl J, Arden B, Chien Y: Ligand
recognition by alpha beta T cell receptors. Annu Rev Immunol 1998,
16:523-544.
2. Rowen L, Koop BF, Hood L: The complete 685-kilobase DNA sequence of
the human beta T cell receptor locus. Science 1996, 272:1755-1762.
3. Davis MM, Bjorkman PJ: T-cell antigen receptor genes and T-cell
recognition. Nature 1988, 334:395-402.
4. Behlke MA, Spinella DG, Chou HS, Sha W, Hartl DL, Loh DY: T-cell receptor
beta-chain expression: dependence on relatively few variable region
genes. Science 1985, 229:566-570.
5. Marrack P, Kappler J: Positive selection of thymocytes bearing alpha beta
T cell receptors. Curr Opin Immunol 1997, 9:250-255.
6. Garcia KC, Degano M, Stanfield RL, Brunmark A, Jackson MR, Peterson PA,
Teyton L, Wilson IA: An alphabeta T cell receptor structure at 2.5 A and
its orientation in the TCR-MHC complex. Science 1996, 274:209-219.
7. Seo KS, Bohach GA: Staphylcoccus aureus. Food microbiology: Fundamentals
and Frontiers Washington, DC: ASM PressDoyle MM, Beucaht LR 2007,
493-518.
8. Lina G, Bohach GA, Nair SP, Hiramatsu K, Jouvin-Marche E, Mariuzza R:
Standard nomenclature for the superantigens expressed by
Staphylococcus. J Infect Dis 2004, 189:2334-2336.
9. Bohach GA: Staphylococcus aureus Exotoxins. Gram-Positive Pathogens
Washington, DC: ASM PressFischetti VA, Novick RP, Ferretti JJ, Portnoy DA,
Rood JI 2006, 464-477.
10. Mooney NA, Ju L, Brick-Ghannam C, Charron DJ: Bacterial superantigen
signaling via HLA class II on human B lymphocytes. Mol Immunol 1994,
31:675-681.
11. Choi YW, Kotzin B, Herron L, Callahan J, Marrack P, Kappler J: Interaction of
Staphylococcus aureus toxin “superantigens” with human T cells. Proc
Natl Acad Sci USA 1989, 86:8941-8945.
12. Deringer JR, Ely RJ, Stauffacher CV, Bohach GA: Subtype-specific
interactions of type C staphylococcal enterotoxins with the T-cell
receptor. Mol Microbiol 1996, 22:523-534.
13. Pilch H, Hohn H, Freitag K, Neukirch C, Necker A, Haddad P, Tanner B,
Knapstein PG, Maeurer MJ: Improved assessment of T-cell receptor (TCR)
VB repertoire in clinical specimens: combination of TCR-CDR3
spectratyping with flow cytometry-based TCR VB frequency analysis. Clin
Diagn Lab Immunol 2002, 9:257-266.
14. Bercovici N, Duffour MT, Agrawal S, Salcedo M, Abastado JP: New methods
for assessing T-cell responses.
Clin Diagn Lab Immunol 2000, 7:859-864.
15. Walters G, Alexander SI: T cell receptor BV repertoires using real time
PCR: a comparison of SYBR green and a dual-labelled HuTrec
fluorescent probe. J Immunol Methods 2004, 294:43-52.
16. Ochsenreither S, Fusi A, Busse A, Nagorsen D, Schrama D, Becker J, Thiel E,
Keilholz U: Relative quantification of TCR Vbeta-chain families by real
time PCR for identification of clonal T-cell populations. J Transl Med 2008,
6:34.
17. Deringer JR, Ely RJ, Monday SR, Stauffacher CV, Bohach GA: Vbeta-
dependent stimulation of bovine and human T cells by host-specific
staphylococcal enterotoxins. Infect Immun 1997, 65:4048-4054.
Seo et al. Journal of Translational Medicine 2010, 8:2
/>Page 8 of 9
18. Li H, Llera A, Tsuchiya D, Leder L, Ysern X, Schlievert PM, Karjalainen K,
Mariuzza RA: Three-dimensional structure of the complex between a T
cell receptor beta chain and the superantigen staphylococcal
enterotoxin B. Immunity 1998, 9:807-816.
19. Bohach GA, Schlievert PM: Detection of endotoxin by enhancement with
toxic shock syndrome toxin-1 (TSST-1). Methods Enzymol 1988,
165:302-306.
20. Monday SR, Bohach GA: Use of multiplex PCR to detect classical and
newly described pyrogenic toxin genes in staphylococcal isolates. J Clin
Microbiol 1999, 37:3411-3414.
21. Arden B, Clark SP, Kabelitz D, Mak TW: Human T-cell receptor variable
gene segment families. Immunogenetics 1995, 42:455-500.
22. Sambrook J, Fritsch EF, Maniatis T: Concentration of DNA Solution.
Molecular Cloning: A Laboratory Manual New York: Cold Spring Harbor
Laboratory PressNolan C 1989, Appendix C1.
23. Yin JL, Shackel NA, Zekry A, McGuinness PH, Richards C, Putten KV,
McCaughan GW, Eris JM, Bishop GA: Real-time reverse transcriptase-
polymerase chain reaction (RT-PCR) for measurement of cytokine and
growth factor mRNA expression with fluorogenic probes or SYBR Green
I. Immunol Cell Biol 2001, 79:213-221.
24. Lamphear JG, Mollick JA, Reda KB, Rich RR: Residues near the amino and
carboxyl termini of staphylococcal enterotoxin E independently mediate
TCR V beta-specific interactions. J Immunol 1996, 156:2178-2185.
25. Kappler J, Kotzin B, Herron L, Gelfand EW, Bigler RD, Boylston A, Carrel S,
Posnett DN, Choi Y, Marrack P: V beta-specific stimulation of human T
cells by staphylococcal toxins. Science 1989, 244:811-813.
26. Jarraud S, Peyrat MA, Lim A, Tristan A, Bes M, Mougel C, Etienne J,
Vandenesch F, Bonneville M, Lina G: egc, a highly prevalent operon of
enterotoxin gene, forms a putative nursery of superantigens in
Staphylococcus aureus. J Immunol 2001, 166:669-677.
27. Lefranc M, Lefranc G: The T cell receptor New York: Academic Press 2001.
28. Loughran TP Jr, Starkebaum G, Aprile JA: Rearrangement and expression
of T-cell receptor genes in large granular lymphocyte leukemia. Blood
1988, 71:822-824.
29. Willenbrock K, Roers A, Seidl C, Wacker HH, Kuppers R, Hansmann ML:
Analysis of T-cell subpopulations in T-cell non-Hodgkin’s lymphoma of
angioimmunoblastic lymphadenopathy with dysproteinemia type by
single target gene amplification of T cell receptor- beta gene
rearrangements. Am J Pathol 2001, 158:1851-1857.
30. Seo KS, Park JY, Davis WC, Fox LK, McGuire MA, Park YH, Bohach GA:
Superantigen-mediated differentiation of bovine monocytes into
dendritic cells. J Leukoc Biol 2009, 85(4):606-16.
31. Seo KS, Lee SU, Park YH, Davis WC, Fox LK, Bohach GA: Long-term
staphylococcal enterotoxin C1 exposure induces soluble factor-mediated
immunosuppression by bovine CD4+ and CD8+ T cells. Infect Immun
2007, 75:260-269.
32. Yarwood JM, Leung DY, Schlievert PM: Evidence for the involvement of
bacterial superantigens in psoriasis, atopic dermatitis, and Kawasaki
syndrome. FEMS Microbiol Lett 2000, 192:1-7.
doi:10.1186/1479-5876-8-2
Cite this article as: Seo et al.: A quantitative real time PCR method to
analyze T cell receptor Vb subgroup expansion by staphylococcal
superantigens. Journal of Translational Medicine 2010 8:2.
Submit your next manuscript to BioMed Central
and take full advantage of:
• Convenient online submission
• Thorough peer review
• No space constraints or color figure charges
• Immediate publication on acceptance
• Inclusion in PubMed, CAS, Scopus and Google Scholar
• Research which is freely available for redistribution
Submit your manuscript at
www.biomedcentral.com/submit
Seo et al. Journal of Translational Medicine 2010, 8:2
/>Page 9 of 9