Báo cáo sinh học: "Functional characterization of human Cd33+ And Cd11b+ myeloid-derived suppressor cell subsets induced from peripheral blood mononuclear cells co-cultured with a diverse set of human tumor cell lines" docx
Bạn đang xem bản rút gọn của tài liệu. Xem và tải ngay bản đầy đủ của tài liệu tại đây (6.92 MB, 20 trang )
RESEARCH Open Access
Functional characterization of human Cd33
+
And
Cd11b
+
myeloid-derived suppressor cell subsets
induced from peripheral blood mononuclear cells
co-cultured with a diverse set of human tumor
cell lines
Melissa G Lechner, Carolina Megiel, Sarah M Russell, Brigid Bingham, Nicholas Arger, Tammy Woo and
Alan L Epstein
*
Abstract
Background: Tumor immune tolerance can derive from the recruitment of suppressor cell populations, including
myeloid-derived suppressor cells (MDSC). In cancer patients, MDSC accumulation correlates with increased tumor
burden, but the mechanisms of MDSC induction rema in poorly understood.
Methods: This study examined the ability of human tumor cell lines to induce MDSC from healthy donor PBMC
using in vitro co-culture methods. These human MDSC were then characterized for morphology, phenotype, gene
expression, and function.
Results: Of over 100 tumor cell lines examined, 45 generated canonical CD33
+
HLA-DR
low
Lineage
-
MDSC, with high
frequency of induction by cervical, ovarian, colorectal, renal cell, and head and neck carcinoma cell lines. CD33
+
MDSC could be induced by cancer cell lines from all tumor types with the notable exception of those derived
from breast cancer (0/9, regardless of hormone and HER2 status). Upon further examination, these and others with
infrequent CD33
+
MDSC generation were found to induce a second subset characterized as CD11b
+
CD33
low
HLA-DR
low
Lineage
-
. Gene and protein expression, antibody neutralization, and cytokine-induction studies
determined that the induction of CD33
+
MDSC depended upon over-expression of IL-1b, IL-6, TNFa, VEGF, and
GM-CSF, while CD11b
+
MDSC induction correlated with over-expression of FLT3L and TGFb. Morphologically, both
CD33
+
and CD11b
+
MDSC subsets appeared as immature myeloid cells and had significantly up-regulated
expression of iNOS, NADPH oxidase, and arginase-1 genes. Furthermore, increased expression of transcription
factors HIF1a, STAT3, and C/EBPb distinguished MDSC from normal counterparts.
Conclusions: These studies demonstrate the universal nature of MDSC induction by human solid tumors and
characterize two distinct MD SC subsets: CD33
+
HLA-DR
low
HIF1a
+
/STAT3
+
and CD11b
+
HLA-DR
low
C/EBPb
+
, which
should enable the developmen t of novel diagnostic and therapeutic reagents for cancer immunotherapy.
Keywords: myeloid-derived suppressor cells, tumor immune tolerance, human tumor cell lines, immunomodula-
tion, cytokines, hypoxia-inducible factor 1 alpha, CAAAT-enhancer binding protein, signal transducer and activator
of transcription, inflammation
* Correspondence:
Department of Pathology, USC Keck School of Medicine, Los Angeles,
California, USA
Lechner et al. Journal of Translational Medicine 2011, 9:90
/>© 2011 Lechner et al; licensee BioMed Central Ltd. This is an Open Acce ss article distributed under the terms of the Creative Commons
Attribution License (http://creati vecommons.org/licenses/by/2.0), which permits unrestricted use, distribution, and reproduct ion in
any medium, provided the original work is properly cited.
Background
Myeloid-derived suppressor cells (MDSC) have recently
been recognized as a subset of innate immune cells that
can alter adaptive immunity and produce immunosup-
pression [1]. In mice, MDSC are identified b y CD11b
+
,
IL-4Ra
+
,andGR-1
low/int
expression, with recognized
granulocytic and monocyt ic subsets [2-6]. Human MDSC
are less understood and comprise a heterogeneous popu-
lation of immature myeloid (CD33
+
) cells consisting of
dendritic cell, macrophage, and granulocyte progenitors
that lack lineage maturation markers [2,5]. MDSC inhibit
T cell effector functions through a range of mechanisms,
including: arginase 1 (ARG-1)-mediated depletion of
L-arginine [7], inducible nitric oxide synthase (iNOS) and
NADPH oxidase (NOX2) production of reactive nitrogen
and oxygen species [8,9], vascular endothelial growth fac-
tor (VEGF) over-ex press ion [10], cysteine depletion [11],
and the expansion of T-regulatory (Treg) cell populations
[12,13]. While rare or absent in healthy individuals,
MDSC accumulate in the settings of trauma, severe infec-
tion or sepsis, and cancer [6], possibly as a result of the
hypoxia and inflammatory mediators in the tumor micro-
environment [14-19]. In cancer patients and experimen-
tal tumor models, MDSC are major contributors to
tumor immune tolerance and the failure of anti-tumor
immunity [1]. Given the multitude of immune modula-
tory factors produced by tumors, it is indeed quite likely
that different subsets of MDSC may be generated in the
tumor microenvironment dependent upon the unique
profile of factors secreted by the tumor [16,17,20]. Precli-
nical models of human tumor-indu ced MDSC will signif-
icantly advance knowledge of their induction and
function as suppressor cells.
In a prior study, we demonstrated that certain
cytokines can induce CD33
+
MDSC from normal donor
peripheral mononuclear cells [16]. As an extension of
these studies, we now report the development of a novel
in vitro method to induce human MDSC from healthy
donor peripheral blood mononuclear cells (PBMC) by
co-culture with human solid tumor cell lines. Suppres-
sor cells generated by this metho d demonstrate features
consistent with MDSC isolated from cancer patients,
including t he inhibition of autologous T cell responses
to stimuli [5]. Using this model system, we have deter-
mined the frequency of MDSC induction in human can-
cers o f varied histiologic types, and have elucidated key
tumor-derived factors that drive MDSC induction. Our
methods generated highly purified human MDSC in
quantities sufficient to enable robust morphology, phe-
notype, gene expression, and functional analyses. From
these investigations two major subsets of MDSC have
been identified that will help elucidate the role of these
cells in the ontogeny, spread, and treatment of cancer.
Methods
Cell Lines and Cell Culture
Tumor cell lines were obtained from the American
Type Culture Collection (ATCC) or were gifted to the
Epstein laboratory. Tumor cell line authenticity was
performed by cytogenetics and surface marker analysis
performed at ATCC or in our laboratory. All cell lines
were maintained at 37°C in complete medium [(RPMI-
1640 w ith 10% feta l calf serum (characterized FCS,
Hyclone, Inc., Logan, UT), 2 mM L-Glutamine, 100
U/mL Penicillin, and 100 μg/mL Streptomycin with 10
ng/mL hGM-CSF to support viability in co-cultures)],
grown in tissue culture flasks in humidified, 5% CO
2
incubators, and passaged 2-3 times per week by light
trypsinization.
Tumor-Associated MDSC Generation Protocol
i. Induction
Human PBMC were isolated from healthy volunteer
donors by venipuncture (60 mL total volume), followed
by differential density gradient centrifugation (Ficoll
Hypaque, Sigma, St. Louis,MO).PBMCwerecultured
in complete medium (5-10 × 10
5
cells/mL) in T-25
culture flasks with human tumor cell lines for one
week. Tumor cells were seeded to achieve confluence
by day 7 (approximately 1:100 ratio with PBMC), and
samples in which tumor cells overgrew were excluded
from analysis and were repea ted with adjusted ratios.
Alternatively, irradiated tumor cells (3500 rad) were
initially seeded at a 1:10 ratio in co-cultures to exam-
ine whether induction was dependent upon actively
dividing tumor cells. PBMC cultured in medium alone
wereruninparallelasaninductionnegativecontrol
for each donor to control for any effects of FCS. For
these studies 39 male and 22 female healthy, volunteer
donors ages 23 to 62 were used under USC Instit u-
tional Review Board-approved protocol HS-06-00579.
Data were derived from at least two individuals and no
inter-donor differences in MDSC induction or function
were observed.
For antibody neutralization experiments, PBMC-tumor
cell line co-cultures were repeated in the presence or
absence of neutralizing monoclonal antibodies for a sub-
set of HNSCC cell lines and included anti-VEGF (Avas-
tin, Genetech, San Francisco, CA), anti-TNFa (Humira,
Abbott, Abbott Park, IL), anti-IL-1b (clone AB-206-NA,
Abcam, Cambridge, MA), anti-IL-6 (clone AB-201-NA,
Abcam), anti-GM-CSF (clone BVD2), anti-TGFb (clone
1D11), anti-FLT3L (polyclonal, Abcam), or isotype
control. For cytokine induction, PBMC were cultured at
5-10 × 10
5
cell s/mL in complete medium supplemented
with 10 ng/mL GM-CSF, FLT3L (25 ng/mL, Abcam),
and/or TGFb (2 ng/mL, R&D).
Lechner et al. Journal of Translational Medicine 2011, 9:90
/>Page 2 of 20
ii. MDSC Isolation
After one week, all cells were collected from tumor-
PBMC co-cultures. Adherent cells were removed using
the non-protease cell detachment solution Detachin
(GenLantis, San Diego, CA). Myeloid cells were then
isolated from the co-cultures using anti-CD33 or anti-
CD11b magnetic micro beads and LS column separation
(Miltenyi Biotec, Germany) as per manufacturer’ s
instructions. Purity of isolated cell populations was
found to be greater than 90% by flow cytometry and
morphological examination an d viability of isolated cells
was confirmed using trypan blue dye exclusion.
iii. Suppression Assay
The suppressive function of tumor-educated myeloid
cells was measured by their ability to inhibit the prolif-
eration of autologous T cells in the following Suppres-
sion Assay: T cells isolated from 30 mL of PBMC from
returning healthy donors by anti-CD8 microbeads and
magnetic column separation (Miltenyi Biotec) were
CFSE-labeled (3 μM, Sigma) and seeded in 96-well
plates with myeloid ce lls isolated previously (ii. MDSC
isolation, above) at 2 × 10
5
, cells/well 4:1 ratio. T cell
proliferation was induce by anti-CD3/CD28 stim ulation
beads (Invitrogen, Carlsbad, CA). Suppression Assay
wells were analyzed by flow cytometry for T cell pr olif-
eration after three days and supernatants were analyzed
for IFNg levels by ELISA (R&D Systems). Controls
included a positive T cell proliferation control (T cells
alone) and induction negative (medium only) and posi-
tive (GM-CS F + IL-6 cytokine-induced MDSC) controls
[16]. Where indicated specific inhibitors of MDSC were
added to suppression assays including all-trans retinoic
acid (ATRA, 100 nM, Sigma, St. Louis, MO), sunitinib
(0.1 μg/mL, ChemieTek, Indiannapolis, IN), celecoxib
(15 μM, Pfizer, New York, NY), nor-NOHA (500 μM,
CalBiochem, San Diego, Ca), L-NMMA (500 μM, Cal-
biochem), apocynin (0.1 mM, Sigma), 1D11 antibody
(10 μg/mL), SB431542 (5 μM, Tocris, Ellisville, MO), or
Avastin (10 μg/mL, Genentech, San Francisco, CA).
Samples were run in duplicate and data were collected
as percent proliferation for 15,000 cells. Samples were
run on a FACSCalibur flow cytometer (BD Biosciences,
San Jose, CA) and data acquisition and analysis were
performed using CellQuestPro software (BD) at the USC
Flow Cytometry core facility.
Characterization of myeloid suppressor cells
i. Morphology of MDSC
Wright-Giemsa staining (Protocol Hema 3, Fisher,
Kalamazoo, MI) of CD33
+
or CD11b
+
cell cytospin pre-
parations was performed to assess the mor phology of
tumor-educated myeloid cells. Freshly isolated PBMC
and CD33
+
cultured in medium only or induced by
cytokines GM-CSF + IL-6 were prepared in parallel for
comparison. Observation, evaluation, and image acquisi-
tion were performed using a Leica DM2500 microscope
(Leica Microsystems, ca-microsystems.
com) connected to an automated, digital SPOT RTke
camera and SPOT Advanced Software (SPOT Diagnos-
tic Instrument Inc., ). Images
were resized for publication using Adob e Photoshop
software (Adobe, ).
ii. Flow cytometry analyses of cell phenotypes
The phenotype of in vitro-generated MDSC was
examined for expression of myeloid, antigen-present-
ing, and suppressor cell markers. For staining, cells
were collected from flasks using Detachin to minimize
cell surface protein digestion, and washed twice with
FACS buffer (2% FCS in PBS) before resuspending 10
6
cells in 100 μl FACS buffer. Cells were stained for 1hr
on ice with cocktails of fluorescently-conjugated
monoclonal antibodies or isotype-matched controls,
washed twice with FACS buffer, and resuspended in
FACS buffer for analysis. For intracellular staining,
cells were fixed and permeabilized using Fixation/Per-
meabilization Kit (eBioscience, San Diego, CA) after
surface staining. Antibodies used were purchased
either from BD Biosciences: CD11c (B-ly6), CD33
(HIM3-4), HLA-DR (L243), CD11b (ICRF44), CD66b
(G10F5), CD14 (M5E2), CD68 (Y1/82A), 41BBL
(C65-485), OX40L (Ik-1); or eBioscience: CD30 (Ber-
H2), CD103 (B-Ly7), GITRL (eBioAITR-L), CD56
(MEM-188). Samples were run on a BD FACSCalibur
flow cytometer and data acquisition and analysis were
performed as above. Data are from three unique
donors and expressed as a fraction of labeled cells
within a live-cell gate set for 15,000 events. CD33
+
or
CD11b
+
cells from PBMC cultured in medium alone
were run in parallel for comparison.
iii. Real-time RT-PCR for gene expression of myeloid
suppressor cells and tumor cell lines
For gene expression studies, tumor-educated CD33
+
or
CD11b
+
cells were isolated from tumor-PBMC co-
cultures by fluorescence activated cell sorting after
Induction (i. Induction, above) and RNA was isolated
from MDSC and DNase- treated using Qiagen’ sRNeasy
micro kit. Tumor cells were collected from culture flasks
and RNA isolated and DNase-treated using Qiagen’ s
RNeasy mini kit. For real-time RT-PCR, 100ng of
DNase-treated RNA was amplified with gene specific
primers using one-step Power SYBR green RNA-to-Ct
kit (Applied Biosystems) and run in an MX3000P Strate-
gene thermocycler (La Jolla, CA). Data were acquired
and analyzed using MxPro software (Stratagene). Gene
expression was normalized t o housekeeping gene
GAPDH and fold change determined relative t o expres-
sion levels in medium only-cultured cells. Primer
sequences w ere obtained f rom the NIH qRT-P CR
Lechner et al. Journal of Translational Medicine 2011, 9:90
/>Page 3 of 20
database and were
synthesized by the USC Microchemical Core Facility
[21].
iv. Measurement of tumor-derived factors by ELISA
Supernatants were collected from confluent cell line
cultures, passed through a 0.2 μm syringe filter unit to
remove cell debris, and stored in aliquots at -20°C.
Levels of IL-1b,IL-6,TNFa,VEGF,andGM-CSFin
supernatant samples were measured using ELISA
DuoSet kits (R&D) per manufacturer’ s instructions.
Plate absorbance was read on an ELX-800 plate reader
(Bio-Tek, Winooski, VT) and analyzed using KC Junior
software (Bio-Tek).
v. Functional studies
Tumor cell line-induced CD33
+
or CD11b
+
MDSC and
medium only controls were isolated by magnetic bead
separation (Miltenyi Biotec) and used for functional
studies. Arginase activity was measured in cell lysates
using Bioassay Systems’ QuantiChrom Arginase Assay
Kit (Hayward, CA) per the manufacturer instructions.
For measurement of ROS production, freshly isolated
myeloid cells were incubated for 45 minutes in RPMI
with 3 μM DCFDA (Sigma) then analyzed by flow-
cytometry. Nitrites were measured in supernatants of cells
cultured 5 × 10
5
cells/mL overnight in complete medium
using Promega’sGriessReagentSystem(Madison,WI)
per the manufacturer instructions.
vi. Immunohistochemistry
Immunohistochemistry studies were performed by the
USC Department of Pathology Histology Core Facility
(Los Angeles, CA) on cytospin preparations of suppres-
sive and non-suppressive myeloid cells using antibodies
against p-STAT3 (clone 6D779, dilution 1:400), C/EBPb
(clone H-7, dilution 1:100) (San ta Cruz Biotech), and
HIF1a (clone 241812, dilution 1:50) (R&D Systems).
Images were acquired and resized for publication as
described above.
Statistical analysis
Changes in mean T cell proliferation and mean IFNg
production in the presence or absence of t umor-edu-
cated or cyto kine-treated MDSC were tested for statisti-
cal significance by one-way ANOVAs followed by
Dunnett test for pairwise comparisons of experimental
samples to T cells alone. Changes in mean T cell prolif-
eration in suppression assays in the presence or absence
of single inhibitors of suppressive mechanisms were
evaluated by ANOVA followed by Tukey’s test for pair-
wise comparisons between all groups. Mean gene
expression of 15 tumor-derived factors between HNSCC
cell lines with and witho ut CD33
+
MDSC induction
capacity was compared by ANOVA followed by Tukey’s
test for pairwise comparisons. For those factors with sta-
tistically significant different mean expression between
suppressor cell inducing and non-inducing cell line
groups, a linear regression analysis was performed to
evaluate for a linear co rrelation between strength of
suppressor cell induction and gene expression levels.
Changes in mean T cell p roliferation stimulated in the
presence of suppressive CD33
+
or CD11b
+
cells induced
by HNSCC or breast and lung carcinoma cell lines,
respectively, for neutralization experiments were eva lu-
ated by ANOVA followed by Tukey’stestforpairwise
comparisons between all groups. Differences in mean
expression of phenotypic markers between pooled
groups of suppressive and non-suppressive CD33
+
or
CD11b
+
cells were tested for significance by ANOVA
followed by Bonferroni’s multi ple comparisons test for
selected pairs (CD11b
+
MDSC vs. CD11b
+
medium con-
trol; CD33
+
MDSC vs. CD33
+
medium control). Differ-
ences in mean transcription factor or suppressive g ene
expression between CD11b
+
and CD33
+
MDSC were
tested for significance by Student’s t test. Differences in
arginase activity, ROS production, and nitrite production
among MDSC subsets and controls were evaluated by
ANOVA foll owed by Bonferroni’smultiplecomparisons
test for selected pairs (CD11b
+
MDSC vs. C D33
+
MDSC; CD11b
+
MDSC vs. CD11b
+
medium control;
CD33
+
MDSC vs. CD33
+
medium control). Statistical
tests were performed using GraphPad Prism software
(La Jolla, CA) with a significance level of 0.05. Graphs
and figures were produced using GraphPad Prism,
Microsoft Excel, and Adobe Illustrator and Photoshop
software (San Jose, CA).
Results
Induction of tumor-associated human
myeloid suppressor cells
A protocol for the generation of tumor cell line-edu-
cated human MDSC from normal donor PBMC was
developed, as outlined schematically in Figure 1. Briefly,
PBMC-tumor cell line co-cultures were established in
tissue culture flasks for one week. Tumor-educated
myeloid (CD33
+
) cells were then isolated, checked for
viability, and tested for suppressive function by co-
culture with fresh, autologous T cells in the presence of
T cell stimuli. Use of irradiated tumor cells in co-
cultures yielded comparable suppressor cell induction,
suggesting that tumor cells need not be actively dividing
to mediate the observed induction of suppressive func-
tion (Table 1). Unfractionated PBMC preparations were
used in evaluating the ability of human solid t umor cell
lines to generate myeloid suppressor cells to best
approximate an in vivo setting, but CD33
+
suppressor
cells were also generated successfully from T cell-
depleted PBMC by co-culture with 4-998 osteogenic
sarcoma or SCCL-MT1 head and neck squamous cell
carcinoma (HNSCC) cells (Table 1).
Lechner et al. Journal of Translational Medicine 2011, 9:90
/>Page 4 of 20
Strong CD33
+
MDSC induction capability by
a subset of human tumor cell lines
MDSC have been reported in patients with a wide range
of different types of cancer [21-31] and their accumula-
tion appears to correlate with increased tumor burden
and stage [10,30]. However, it remains unclear whether
all cancers induce this toler izing population, as strong
evidence exists to suggest diversity in immune escape
mechanisms amongst cancer types and individual tumors
[32]. To address this question, one-hundred-one human
solid tumor cell lines were tested for their ability to
induce MDSC in the tumor co-culture assay using PBMC
from 61 unique health y, volunteer donors (3 9 male, 22
female) ranging in age from 23-62 (Table 1). CD33
+
MDSC could be generated by at least one cell line of
every human tumor type examined (cervical/endometrial,
ova rian, pancreatic, lung, head and neck, renal cell, liver,
colorectal, prostate, thyroid, gastric, bladder, sarcoma,
and glioblastoma), with the exception of breast carci-
noma (Table 1) . Head and neck, cervical/ovari an, color-
ectal, and renal cell carcinoma cell lines frequently
induced CD33
+
MDSC and are good models for further
studies of this suppressive population. A range of
suppressor cell ability appeared to exi st wit hin histol ogic
types for the majority of tumor cell lines examined,
suggesting that subclones within a whole tumor may
drive MDSC induction. Notably, myeloid cells from
PBMC cultured in medium alone or co-cultured with
fibroblast cell lines were not suppressive (Table 1).
Tumor cell line-induced CD33
+
MDSC resemble MDSC
from cancer patients in suppressive function
and gene expression
A sample of HNSCC cell line-induced CD33
+
MDSC
(from co-cultures with SCCL-MT1, SCC-4, CAL-27,
FaDu, RPMI 2650, or SW 2224) were used to chara cter-
ize further the suppressive function and related gene
expression of these in vitro-generated suppressor cells.
As shown in Figure 2A, tumor cell line-educated MDSC
suppressed both autologous T cell proliferation and
interferon g with a range of suppressive function seen
amongst MDSC samples induced by different HNSCC
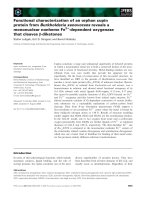
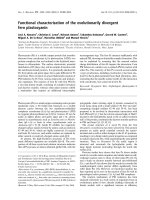
Figure 1 Schematic of Co-culture and MDSC Suppression Assays for the in vitro generation of tumor-associated myeloid suppressor
cells. Induction: Normal donor PBMC are co-cultured with human solid tumor cell lines for one week. MDSC Isolation: CD33
+
or CD11b
+
cells are
isolated from PBMC-tumor co-cultures by anti-CD33 or anti-CD11b microbead labeling and magnetic column separation. Suppression Assay:
Tumor-educated CD33
+
or CD11b
+
cells are subsequently co-cultured with fresh, autologous CFSE-labeled T cells at a 1:4 ratio in the presence of
T cell stimuli. After 3 days, T cell proliferation is measured as CFSE-dilution using flow cytometry. Suppressive function is evaluated as the ability
of CD33
+
or CD11b
+
cells to inhibit autologous T cell proliferation.
Lechner et al. Journal of Translational Medicine 2011, 9:90
/>Page 5 of 20
Table 1 Canonical CD33
+
human MDSC induction by human cancer cell lines
Inducing Tumor Cell Line Mean Percent Suppression SEM Inducing Tumor Cell Line Mean Percent Suppression SEM
Controls Cervical/Endometrial (4/5)
T cells alone 0.00 ** HeLa 68.35 5.36
Medium only -2.35 0.86 ** ME-180 75.24 3.83
Lung Fibroblasts -1.03 0.96 ** SIHA 54.49 8.66
Ditt Fibroblasts -0.13 2.91 ** RL95-2 52.11 3.84
** GM-CSF + IL-6 56.30 5.01 SW 756 -83.60 2.18
HNSCC (6/8) Ovarian (6/9)
** SCCL-MT1 91.83 0.82 ** A2780 64.46 5.33
Irradiated 89.18 0.20 ** ES-2 63.62 5.17
T cell Depl. 81.49 4.98 ** TOV-21G 52.86 11.37
** USC-HN2
1
87.97 ND ** SK-OV-3 51.44 9.81
** SCC-4 65.72 2.08 * NIHOVCAR-3 47.89 1.08
** CAL-27 66.26 6.21 * SW 626 46.54 4.07
** SW 451 59.49 9.59 HOC-7 41.77 19.15
* FaDu 30.98 4.45 HEY 22.20 3.87
RPMI 2650 17.46 5.01 Caov-3 -146.53 2.69
SW 2224 -13.48 11.21 Breast (0/9)
Thyroid (1/2) MCF-7 16.95 0.39
** SW 579 68.97 3.41 734B 16.72 2.32
SW 1949 43.90 13.68 T47D 8.47 1.23
Brain (2/9) BT-474 0.83 11.53
** NU-04 69.41 4.02 SKBR3 -0.09 13.53
** U118MG 51.96 1.48 MDA-MB-468 -3.46 0.25
SW 598 14.29 4.14 GI-101 -6.41 0.92
A172 2.26 4.97 SV-BR-1 -8.00 1.75
IMR-5 -1.23 3.09 MDA231 -16.21 2.60
IMR-32 -3.16 7.48 Bladder (1/3)
TE 671 -12.23 4.29 ** T24 53.89 3.97
Y79 -72.63 5.58 SW 780 8.10 10.01
BM-166 -83.22 0.05 SW 733 -54.63 0.45
Melanoma (1/3) Prostate (2/3)
** A375 56.16 0.64 ** DU 145 54.73 2.07
CaCl74-36 17.26 6.83 * LNCaP 29.09 2.78
Colo 38 15.83 1.49 PC3 15.12 9.09
Sarcomas (4/9) Renal (3/6)
** 4-998 58.31 0.82 ** 786-O 75.91 6.06
Irradiated 52.10 0.44 ** CAKI-1 64.94 3.70
T cell Depl. 65.23 8.17 ** CAKI-2 63.62 5.17
* Rh30 44.63 2.51 SW 156 36.51 10.69
* HOS 42.58 4.86 ACHN 9.85 0.20
* SW 1353 42.22 4.42 SK-NEP-1 0.00 1.82
HT 1080 19.37 5.92 Gastric (1/2)
SA-4 12.53 1.05 ** SW 1961 64.55 3.04
HS 919 3.01 5.31 KATO-III 7.65 2.16
SW 80 -5.00 3.93 Colorectal (5/6)
HS 913T -56.35 1.45 ** SW 732 69.19 1.29
Lung (4/11) ** DLD-1 65.59 3.19
Non-small cell (2/7) ** SW 608 53.11 5.15
* A427 27.71 6.87 ** SW 707 52.38 0.64
* SW 1573 21.47 1.64 * HT-29 38.37 4.91
NCI-H292 8.23 2.89 LS147T 13.62 3.87
Lechner et al. Journal of Translational Medicine 2011, 9:90
/>Page 6 of 20
cell lines. The suppressive capability of HNSCC-induced
MDSC was compared with that of a positive T cell pro-
liferation control (T cells alone), an induction negative
control (CD33
+
cells from medium only cultures), and
an induction positive control (CD33
+
cells isolated from
PBMC cultured with GM-CSF and IL-6). Of note, while
the most potent MDSC (SCCL-MT1 and SCC-4-
induced) blocked both T cell proliferation and IFN g pro-
duction, weaker HNSCC-induced CD33
+
suppressor
cells preferentially inhibited T cell proliferation (CAL-27
or SW 451-induced) or IFNg production (FaDu-
induced). These findings suggest that MDSC may
impede T cell responses through multiple avenues,
including inhibition of activation and expansion.
Using these and additional tumor cell line-induced
MDSC samples (4-998 osteogenic sarcoma, DU 145
prostate carcinoma, CAKI-1 renal cell carcinoma, SK-
OV-3 ovarian carcinoma, and SW 608 and SW 732 col-
orectal adenocarcinoma cell lines), we analyzed expres-
sion of putative MDSC suppression genes in
comparison to norm al myeloid cells. These MDSC con-
sistent ly showed statistically significant up-regulation of
ARG-1, iNOS, NOX2, VEGF, and/or TGFb compared
with control CD33
+
cells from medium-only cultures
(Figure 2B). Subtle variations were observed in the gene
expression pat terns of these tumo r-induced MDSC,
which is c onsistent with the hypothesis that different
MDSC subsets are generated by different tumors depen-
dent upon the specific profile of immune factors
produced by each. To determine the do minant mechan-
ism of T cell suppression by this canonical CD33
+
MDSC subset, suppression assays were repeated in the
presence or absence of specific inhibitors of ARG-1
(nor-NOHA), iNOS (L-NMMA), NOX2 (apocynin),
VEGF (neutralizing antibody Avastin), or TGFb1
(SB4 31542 or neutralizing antibody 1D11). In these stu-
dies no one inhibitor was found to completely reverse
suppression (Figure 3), consistent with the pleotropic
actions of MDSC, but inhibitors of ARG-1 and NOX2
did produce statistically significant decreases in suppres-
sion by CD33
+
MDSC. These results were confirmed by
siRNA knockdown of individual suppression genes:
ARG-1, iNOS, NCF1 (NOX2 component), TGFb1, or
VEGFA (data not shown).
CD33
+
MDSC are induced by tumor-derived IL-1b, IL-6,
TNFa, VEGF, and GM-CSF
Previously, we compared gene expression of immune
modulatory cytokines for groups of MDSC-inducing and
non-inducing human cancer cell lines [16]. These stu-
dies suggested multiple mechanisms of MDSC induction
amongst tumor cell lines, including inflammatory cyto-
kines. To reduce background differences in gene expres-
sion related to tissue-specific expression patterns, a
group of human HNSCC cell lines consisting of both
MDSC-inducing and non-inducing models was further
studied for expression of th ese putative MDSC inducing
factors. HNSCC tumor cell lines showed a high
Table 1 Canonical CD33
+
human MDSC induction by human cancer cell lines (Continued)
NCI-H1650 6.67 4.18 Pancreatic (3/10)
SK-MES-1 4.31 6.03 ** SW 1990 78.15 1.21
NCI-H125 1.54 3.69 * Panc 2.03 22.28 4.37
NCI-H1975 0.28 2.89 * Panc 4.14 21.82 2.60
Small Cell 2/3) Panc 9.6.94 27.28 8.47
** NCI-H464 63.96 6.00 Panc-1 7.82 3.69
* NCI-H60 47.79 7.71 Panc 3.27 6.98 5.44
NCI-HUT 69C -24.28 16.75 ASPC-1 3.09 2.36
Mesothelioma (0/1) CAPAN-1 -1.34 2.27
SW 1503 1.93 2.02 Panc 2.5 -1.79 6.08
Liver (2/5) MIA PaCa-2 -4.38 1.94
* HA 22T 44.01 4.22 Epidermoid (0/1)
* HEP 3B 23.52 7.44 A431 -31.12 8.55
PLC 22.05 5.22
MAH 11.87 4.72
HEP-G2 -2.10 9.40
Forty-five of 101 human solid tumor cell lines induce functionally suppressive CD33
+
myeloid suppressor cells from volunteer normal human PBMC after one-
week co-culture in vitro. Tumor cell lines inducing CD33
+
MDSC with statistically significant suppressive function are indicated by */bold, and those with strong
MDSC inducing capacity (mean T cell suppression by CD33
+
cells ≥ 50%) are indicated by **. CD33
+
cells from PBMC cultured in complete medium alone (non-
suppressive control), co-cultured with fibroblast cell lines (induction negative control), and cytokine-induced MDSC (GM-CSF + IL-6, suppressive control) were run
in parallel for comparison. Irradiated tumor cell lines and T cell depleted PBMC (italicized) were tested for the ability to induce CD33
+
MDSC in some
experiments.
Lechner et al. Journal of Translational Medicine 2011, 9:90
/>Page 7 of 20
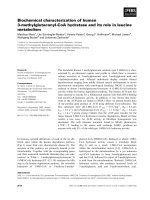
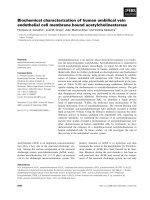
Figure 2 Induction and functional characterization of canonical CD33
+
MDSC by human tumor cell lines. A, HNSCC-induced MDSC inhibit
autologous T cell proliferation and IFNg production. A subset of HNSCC cell lines induces a CD33
+
population with suppressive function
characteristic of MDSC, including inhibition of autologous T cell proliferation (left) and IFNg secretion (right). Tumor cell lines are grouped by
strength of MDSC induction: strong (black), weak (gray), and non-inducing (white). For both graphs, mean shown (n ≥ 2 donors) +SEM. *
indicates statistical significance by ANOVA followed by Dunnett post-test for comparison to T cells alone, p <0.05. B, Human MDSC mediate
suppression through up-regulation of ARG-1, NOX2, iNOS, VEGF, and TGFb. A, Expression of putative suppressive genes ARG-1, iNOS, NOX2-
component NCF1, VEGF, and TGFb in a subset of tumor cell line-induced CD33
+
MDSC. Mean fold change (n ≥ 2 donors per tumor cell line)
+SEM, relative to CD33
+
cells cultured in medium alone, are shown. * indicates statistical significance, p <0.05, by ANOVA followed by Dunnett
test for pairwise comparisons to medium only CD33
+
controls. C, Heatmap showing expression of immune modulatory cytokines by HNSCC cell
lines in relation to their ability to induce CD33
+
MDSC. MDSC-inducing cell lines produce increased IL-1b, IL-6, TNFa, VEGF, and GM-CSF.
Expression of ten putative MDSC-inducing factors was measured in MDSC-inducing (bold) and non-inducing HNSCC cell lines by qRT-PCR.
Increased CD33
+
MDSC-induction capacity was associated with greater expression of IL-1b, IL-6, TNFa, and VEGF (p <0.05). Mean fold change (n
= 2) relative to human reference RNA (gray shading = increased, white = decreased expression), p value shown is for linear regression analysis
for factors having significantly higher gene expression in MDSC-inducing compared with non-inducing human HNSCC cell lines by one-way
ANOVA followed by Tukey’s post-test. D , Removal of GM-CSF, IL-6, or IL-1b from co-culture impairs CD33
+
MDSC induction by tumor cell lines. T
cell proliferation when co-cultured with CD33
+
MDSC from tumor cell line (SCCL-MT1 or USC-HN2) co-cultures with neutralizing antibodies to
GM-CSF, IL-6, IL-1b, TNFa, or VEGF. Mean shown (n = 5, four independent experiments), +SEM. * indicates statistical significance, p <0.05.
Lechner et al. Journal of Translational Medicine 2011, 9:90
/>Page 8 of 20
frequency of CD33
+
MDSC induction (Table 1) and
thus were good models for further studies of induction.
Expression of immune modulatory factors (c-kitL,
COX2, FLT3L, GM-CSF, IL- 1b, IL-4, IL-6, IL-10, IDO,
iNOS,M-CSF,TGFb,TNFa,VEGF)wasmeasuredin
eight HNSCC cell lines using quantitative RT-PCR tech-
niques. As shown in Figure 2C, MDSC-induction capa-
city correlated directly with tumor cell line expression
of IL-1b,IL-6,TNFa,VEGF,andGM-CSF(p<0.05for
ANOVA followed by Dunnett test for pairwise compari-
sons between inducing and non-inducing cell lines for
each factor , and p <0.05 for linear regression analysis of
suppressive inductio n capacity with level of cytokine
production). Differential gene expression of IL-6, TNFa,
VEGF, and GM-CSF was confirmed at the protein level
by ELISA techniques (Figure 4); IL-1b levels were below
the sensitivity of the assay. These data c oncur with our
previous work showing that IL-6, IL-1b,VEGF,and
TNFa with GM-CSF are sufficient for CD33
+
MDSC
induction from normal donor PBMC [16]. Neutralizing
antibodies to cytokines GM-CSF, IL-1b,IL-6,VEGF,or
TNFa were tested in PBMC-tumor cell line co-cultures
to determine which factor(s) was most important for
induction (Figure 2D). Neutralization of GM-CSF, IL-6,
or IL-1b in tumor cell line-P BMC co-cultures abrogated
significant induction of CD33
+
suppressor cell function
(p <0.05, significant differences between these conditions
and induction without neutralizing antibodies) and
restored T cell proliferation to levels comparable to con-
trols (p = NS). COX2 expression was also elevated in
many of the MDSC-inducing cell lines, particularly ovar-
ian and cervical cancer cell lines, and PGE
2
in
combination with GM-CSF induced weak suppressive
function in CD33
+
cells([16],datanotshown).How-
ever, addition of COX2 inhibitors to ovarian and cervi-
cal tumor cell line-PBMC co-cultures did not
significantly decrease MDSC induction (data not
shown).
Preferential induction of a second subset of CD11b
+
MDSC by some human cancer cell lines through FLT3L
and TGFb
Interestingly, no human breast cancer cell line (0/9)
tested generated CD33
+
MDSC from PBMC after a one-
week co-culture (Table 1). This finding led us to investi-
gate the induction of other MDSC phenotypes by th ese
models. Human MDSC have been reported to express a
wide range of surface markers and likely consist of sev-
eral subtypes [2,5,20,22,24,27,29,30]. In addition to the
common myeloid antigen CD33, CD11b is another mar-
ker reported to be expressed on some human MDSC
[3,5,33]. As shown in Figure 5A, breast c arcinoma cell
lines preferentially induced CD11b
+
MDSC, suggesting
that this component of the MAC-1 phagocytic complex
maybeamorespecificmarkerforthesubsetofMDSC
induced by this tumor type. Lung carcinoma and glioma
cell lines, which had a low frequency of CD33
+
MDSC
induction, also were found to induce with modera te fre-
quency the CD11b
+
MDSC subset (Figure 5A). Taken
collectively with our survey of CD33
+
MDSC induction,
these data suggest that the induction of MDSC is a uni-
versal feature of human cancers with some variation in
the phenotype of induced MDSC sub sets observed.
These data further emphasize the importance of
Figure 3 Tumor cell line-induced CD33
+
MDSC inhibit proliferation of autologous, CD3/CD28-stimulated T cells through multiple
mechanisms. Specific inhibitors of MDSC suppressive mechanisms ARG-1 and NOX2 mediate partial but incomplete reversal of suppression. *
indicates statistical significant difference in mean T cell proliferation (mean shown + SEM, n ≥ 7 for each inhibitor, data from 2 independent
experiments with similar results), p <0.05, by ANOVA followed by Tukey test for pairwise comparisons.
Lechner et al. Journal of Translational Medicine 2011, 9:90
/>Page 9 of 20
functionally defining this heterogeneous population of
suppressor cells until specific acti vation-associated mar-
kers are identified.
Revisiting previously publ ished gene expression data
for this group of breast cancer cell lines, which lack
CD33
+
MDSC induction, we identified FLT3L a nd
TGFb as differentially expressed candidates for CD11b
+
MDSC subset induction fr om our panel of putative
MDSC-inducing factors [16]. PBMC were then cultured
inthepresenceofFLT3L,TGFb,FLT3L+TGFb,or
medium alone for one week to evaluate whether these
cytokines were sufficient for CD11b
+
MDSC induction.
Myeloid cells isolated from cytokine-treated cultures
showed significant suppression of autologous T cell pro-
liferation (p <0.05, comparison to T cells cultured
alone), consistent with MDSC, with the most potent
cells generated from combined FLT3L and TGFb
treatment (Figure 5B). These data suggest that FLT3L
and TGFb are present and sufficient for CD11b
+
MDSC
induction, but technical difficulties in abolishing FLT3L,
which is a broad hematopoietic progenitor growth fac-
tor, and TGFb, which is ubiquitous in serum and regu-
lated by association of a latency protein, precluded clear
neutralization data.
Characterization of human CD33
+
and CD11b
+
suppressor
cells induced by tumor cell lines
To characterize better these t wo MDSC subsets (CD11b
+
or CD33
+
), comparative morphology, phenotype, gene
expression, and functional studies were performed. The
morphology of suppressive tumor-co-cultured CD33
+
and CD11b
+
populations was compared to that of
freshly isolated PBMC and myeloid cells cultured in
medium only by Wright-Giemsa staining (Figure 6A and
Figure 4 MDSC-in ducing cell lines produce increased GM-CSF, IL-6, TNFa, and VEGF. Prot ein secretion of these cytokines by HNSCC cell
lines was measured in supernatants using ELISA techniques to confirm gene expression findings. Mean protein levels shown (two independent
experiments each run in triplicate), +SEM. Of note, cell line USC-HN2 was recently established and characterized in our laboratory from a the
tumor of a patient with recurrent oral cavity squamous cell carcinoma
1
and found to be a strong producer of immune modulatory factors
associated with MDSC induction.
Lechner et al. Journal of Translational Medicine 2011, 9:90
/>Page 10 of 20
data not shown). Healthy donor PBMC showed occa-
sional mononuclear cells with p ale and scant cytoplasm,
scattered amongst predominant lymphocytes (data not
shown). CD33
+
and CD11b
+
cells from PBMC cultured
in medium alone (with hGM-CSF for growth support)
for one week were predominantly large, mononuclear
cells having abundant basophilic cytoplasm with occa-
sional granulocytes (CD33
+
only) and other myeloid
lineage cel ls (e.g. eosinophils) (far left and middle right
panels). In contrast to the mature lineages seen in
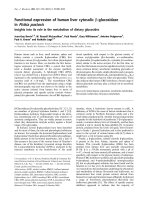
Figure 5 Induction of a second CD11b
+
MDSC subset by breast, lung, and brain cancer cell lines. A, C D11b
+
cells from breast cancer,
lung cancer, or glioma cell line-PBMC co-cultures were evaluated for suppressive function against CD3/CD28 stimulated autologous T cells.
Mean (n = 2) T cell proliferation + SEM or T cell proliferation (n = 1) is shown from Suppression Assays of CD33
+
or CD11b
+
cells with
autologous T cells, respectively. * indicates statistically significant suppression of T cells by CD11b
+
cells from co-culture (p <0.05, ANOVA
followed by Dunnett’s test for comparison to T cells alone); significance for suppression by CD33
+
cells is found in Table 1. Note that some
tumor cell lines induce both subsets, while others induce only one subset or neither. CD33
+
and CD11b
+
cells from medium only cultures were
not suppressive. B, CD11b
+
MDSC subset can be induced from normal donor PBMC by cytokines FLT3L and TGFb. Mean shown (n = 3) + SEM. *
indicates statistically significant in mean T cell proliferation compared with T cells alone (p <0.05).
Lechner et al. Journal of Translational Medicine 2011, 9:90
/>Page 11 of 20
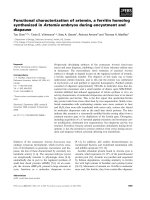
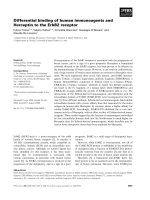
Figure 6 Morphology, phenotype, and function of CD11b
+
and CD33
+
MDSC subsets. A, Morphology of human CD33
+
and CD11b
+
MDSC
subsets isolated after tumor cell line co-culture and normal myeloid counterparts from medium only cultures (Wright-Giemsa staining, x400,
original magnification). CD33
+
MDSC appear slightly more differentiated than CD11b
+
MDSC after induction. Images are representative of data
from more than five donors and three independent experiments using SCCL-MT1 or USC-HN2 for CD33
+
MDSC induction and MCF7 or NCI-H60
for CD11b
+
MDSC induction. B, Human CD33
+
and CD11b
+
MDSC are distinct subsets with a common HLA-DR
low
Lineage
-
phenotype.
Phenotype of HNSCC cell line-induced CD33
+
and breast cancer cell line-induced CD11b
+
MDSC compared with medium only, non-suppressive
CD33
+
and CD11b
+
cells as measured by flow cytometry. Mean percent positive cells (n ≥ 2) + SD shown, data from three unique donors.
Differences in percent positive cells analyzed by ANOVA then Bonferroni’s multiple comparison test for selected pairs (* indicates statistically
significant difference in mean percent positive between MDSC and medium control for each subset, p <0.05). C, Comparison of ARG-1, iNOS,
and NOX2-component NCF1 gene expression in CD33
+
and CD11b
+
human MDSC revealed similar levels of expression between these subsets.
Mean fold change shown relative to medium only controls (n = 3 unique donors for MDSC from co-cultures with each of three inducing tumor
models) + SEM. No statistically significant difference between means as determined by Student’s t test for each gene. D, Elevated arginase
activity (left) and reactive oxygen species (ROS) production (right) by tumor cell line-induced CD33
+
and CD11b
+
MDSC. Arginase activity of
CD11b
+
and CD33
+
MDSC subsets as measured by arginine degradation to urea and compared with normal myeloid cells. Mean shown + SEM;
data from four unique donors and two inducing cancer cell lines for each subset. * indicates statistical significance (p <0.05); NS = not
significant. ROS production by CD11b
+
and CD33
+
MDSC subsets as measured by DCFDA and compared with normal myeloid cells. Mean
fluorescence intensity shown + SEM for 20,000 events collected; data from three unique donors and two inducing cancer cell lines for each
subset. No significant difference by ANOVA.
Lechner et al. Journal of Translational Medicine 2011, 9:90
/>Page 12 of 20
medium only myeloid cells, CD33
+
and CD11b
+
sup-
pressor cells isolated from PBMC after tumor co-culture
(USC-HN2 or SCCL-MT1 HNSCC for CD33
+
,MCF7
breast or NCI-H60 small cell lung for CD11b
+
)showed
an abundance of immature cells, including metamyelo-
cytes or band cells and blast-like cells (middle left and
far right panels, repr esentative images shown of three
independent experiments). Subtle morphologic differ-
ences were observed between CD33
+
and CD11b
+
MDSC, which pointed to the fact that CD11b
+
MDSC
appeared more immature than CD33
+
suppressor cells
(Figure 6).
Phenotype of MDSC shows CD33
+
and CD11b
+
subsets to
be both HLA-DR
low
and Lineage
-
Further characterization of CD33
+
and CD11b
+
MDSC
subsets was performed using a wide range of proposed
MDSC and mature innate immune cell markers (CD33,
CD11b, CD66b, CD14, CD11c, HLA-DR, GITRL,
OX40L, 41BBL (CD137L), CD56). H uman MDSC were
isolated by magnetic bead column separation after one-
week co-culture with SCCL-MT1 or USC-HN2 HNSCC
cell lines (CD33
+
) or MCF-7 breast cancer cell line
(CD11b
+
) a nd non-suppressive CD33
+
or CD11b
+
con-
trol cells were isolated from medium only PBMC cul-
tures. The purity for column isolated populations was
found to be >90% by flow cytometry. Positivity f or
MDSC and mature myeloid lineage markers was mea-
sured by flow cytometry for each population and com-
pared between CD33
+
and CD11b
+
MDSC subsets and
between suppressive and non-suppressive populations
(Figure 6B). Interestingl y, CD11b expression level s were
inversel y correlat ed with suppressive function in CD33
+
cells in these studies, and similarly CD33 positivity w as
inversely correlated with suppressive function in CD11b
+
cells, suggesting a divergence in the two populations
during induction. Notably, both CD33
+
and CD11b
+
suppressive populati ons showed decreased expression of
activation marker HLA-DR and mature dendritic cell
(DC) marker CD11c compared with non-suppressive
populations of CD11b
+
and CD33
+
cell s. These data are
consistent with an accumulation of immature myeloid
lineage cells coincident with the induction of suppres-
sive function in either CD11b
+
or CD33
+
cells. Differen-
tiated DC markers and T cell co-stimulatory l igands
were further examined on the CD33
+
subset of MDSC
and found to be expressed at similarly low levels
between suppressive and non-suppressive CD33
+
cells
isolated from tumor co-cultures (p = NS) (Figure 7),
suggesting that the maturation and antigen presenting
defects of MDSC are not primary in T cell suppression.
Thi s is consistent with therapeutic studies we have per-
formed in our laboratory in which the addition of T cell
co-stimulatory ligands (Fc-huGITRL, Fc-huCD137L, Fc-
B7.1) or agonist antibodies (anti-huCD137, anti-huGITR,
anti-huCD28) to suppression assays failed to signifi-
cantly reverse inhibition of T cell proliferation (p = NS)
(data not shown). Two surface markers, CD30 and
CD103, found o n other immune suppressor cell popula-
tions [34,35] were examined in this study as potential
unique markers of active MDSC, but were not found to
correlate w ith their suppressive function (p = NS) (Fig-
ure 8). Macrophage marker CD68 and granulocyte mar-
ker CD66b expression were low or absent and not
differentially expressed by su ppressiv e and non-suppres-
sive CD33
+
or CD11b
+
cells in this study, emphasizing
that that these phenotypes likely do not represent
tumor-associated macrophages [1] or the granulocytic
MDSC subsets described elsewhere [36].
Comparison of suppressive function in CD33
+
and CD11b
+
MDSC subsets
A comparison of ARG-1, iNOS, and NOX2-component
NCF1 gene expression in CD33
+
and CD11b
+
human
MDSC induced by HNSCC or breast and lung carci-
noma cell lines, respectively, revealed similar levels of
expression between these subsets with a trend toward
increased ARG-1 and NOX2 expression in CD33
+
MDSC (Figure 6C). Functional studies confirmed greater
arginase activity in CD33
+
versus CD11b
+
MDSC, but
suggested that reactive oxygen species production is
similarly elevated in both subsets (Figure 6D). Nitrite
production was not found to be greatly elevated above
medium only controls (data not shown), perhaps indi-
cating that iNOS activity is a minor contributor for sup-
pressive function in these subsets. While these findings
remain preliminary, they suggest partial or complete
functional overlap of these MDSC subsets. Furthermore,
these data suggest that effective abrogation of human
MDSC activ ities by depletion of a single subset is unli-
kely to yield significant therapeutic benefit in cancer
patients that induce both subsets.
Higher Hif1a, STAT3, and C/EBPb gene expression
delineate subsets and distinguish tumor cell line-induced
human MDSC from normal myeloid cells
It is apparent that human MDSC can be induced by
multiple factors present in the tumor microenvironment
[16]. Furthermore, as a consequence of these multiple
different induction routes, at least two distinct p heno-
types of human MDSC emerge that can both mediate
suppression of T cel l responses. Interestingl y, these
CD33
+
and CD11b
+
MDSC subsets showed some phe-
notypic (HLA-DR
low
and lineage
-
) and functional con-
vergence despite preferential induction by different
tumor models and predominant expression of either
CD33 or CD11b. We wondered whether a common
transcription factor was activated by these multiple
Lechner et al. Journal of Translational Medicine 2011, 9:90
/>Page 13 of 20
pathways and might be act as a “master switch” to control
both of these human MDSC. Several transcription factors
have been proposed for control of MDSC, primarily
in mice, including CCAAT-enhancer-binding proteins
(C/EBP) b [37], hypoxia inducible factor (HIF) 1a [14],
and signal transducer and activator of t ranscription
(STAT) 3 [26,38], STAT5 [38], and STAT6 [2]. Previously
identified as transcriptional regulators in some murine
tumor-derived MDSC subsets, we now show that these
transcription factors are elevated in human MDSC and,
importantly, are differentially expressed in CD33
+
versus
CD11b
+
MDSC subsets. We examined the expression of
HIF1a,STAT3,andC/EBPb in tumor cell line (SCCL-
MT1 or USC-HN2)-induced CD33
+
or (MCF7 breast or
NCI-H60 small cell lung carcinoma) CD11b
+
human sup-
pressor cells compared with medium only controls by
qRT-PCR techniques (data from six unique donors, two
independent experiments) (Figure 8A) and immunohisto-
chemistry (Figure 8B). Both CD33
+
and CD11b
+
function-
ally active human MDSC showed significant up-regulation
of transcription factors STAT3, C/EBPb, and HIF1a com-
pared with non-suppressive myeloid cells from medium
only cultures. However, CD33
+
and CD11b
+
MDSC sub-
sets showed differences in transcriptional changes for
these factors that were suggestive of different induction or
activation pathways. As shown previously, CD33
+
or
CD11b
+
MDSC may be induced under a variety of differ-
ent tumor conditions and following incubation with sev-
eral distinct cytokine mixtures [16]. CD33
+
MDSC showed
stronger up-regulation of STAT3 and HIF1a while CD11b
+
MDSC showed comparably greater up-regulation of C/
EBPb (Figure 8A). Differences in pSTAT3 and C/EBPb
were confirmed by immunohistochemistry studies (Figure
8B) and Western blotting techniques (data not shown)
and preliminary data are shown for HIF1a protein accu-
mulation to support gene expression findings. Treatment
of either CD33
+
or CD11b
+
tumor-cell line-induced
MDSC with lipopolysaccharide, a known activator of
MDSC function [39], caused further up-regulation of
STAT3, C/EBPb,andHIF1a concurrent with increased
expression of ARG-1, iNOS, and NOX2-component NCF1
(data not shown). These results further support a role for
these transcription factors in promoting human MDSC
suppressive function. While suppressive abilities in both
CD11b
+
and CD33
+
subsets correlated with increased
expression of STAT3, C/EBPb, and HIF1a, the dominant
transcriptional pathway may be different. Indeed, thera-
peutic reversal of CD11b
+
or CD33
+
MDSC-mediated sup-
pression corresponded with different transcript ional
changes.
Inhibitors of MDSC function show differential
activity on MDSC subsets
As reviewed by Lechner and Epstein [40], tyrosine
kinase inhibitor Sunitinib and all-trans retinoic acid
(ATRA) have previously been shown to inhibit MDSC
[26,33]. Studies in our laboratory have also identified
celecoxib (CXB) and analogs dimethyl celecoxib (DMC)
[41] and unmethylated celecoxib (UMC) [41] as inhibi-
tors of suppressive function in CD33
+
,butnotCD11b
+
,
MDSC in vitro (Figure 8C). Of note, the reversal of
MDSC effects by CXB and analogs DMX and UMC
does not appear to rely upon cyclo-oxygenase (COX)2
enzyme inactivation, as demonstra ted by the persistence
Figure 7 Expanded phenotype of canonical CD33
+
human MDSC subset induced by tumor cell lines. Phenotype Expression of antigen
presenting cell (left) and suppressor cell (right) markers on strongly suppressive (induced by HNSCC cell lines SCCL-MT1, SCC-4, CAL-27) versus
non-suppressive (induced by SW 2224, RPMI 2650, or medium only) CD33
+
myeloid cells as measured by flow cytometry. Median fluorescence
above isotype control (data from 3 unique donors; mean shown for all three induction conditions (n = 9) +SEM). * indicates statistical
significance, p <0.05, † indicates p = 0.59 for comparisons between suppressive cell and non-suppressive cells mean.
Lechner et al. Journal of Translational Medicine 2011, 9:90
/>Page 14 of 20
Figure 8 Transcription factors promoti ng human MDSC suppressive function. A, HIF1a, STAT3, and C/EBPb expression in tumor cell line-
induced CD33
+
or CD11b
+
MDSC compared with medium only controls as measured by qRT-PCR. Mean shown (data from six unique donors,
two independent experiments) +SEM; * indicates statistical significance, p <0.05, † indicates p = 0.06. B, Immunohistochemisty of C/EBPb,p-
STAT3, and HIF1a in CD33
+
(left) and CD11b
+
(right) MDSC and CD33
+
medium controls (middle). Representative images shown from multiple
samples stained (400x, original magnification) with arrows showing positive staining areas for p-STAT3 and HIF1a. C, Inhibition of CD33
+
human
MDSC subset by celecoxib and celecoxib analogs via a non-COX2 dependent mechanism. Studies in our laboratory have identified Celecoxib
and analogs dimethyl celecoxib (DMC) and unmethylated celecoxib (UMC) as inhibitors of suppressive function in CD33
+
MDSC in vitro. Of note,
the reversal of MDSC effects by CXB and analogs DMX and UMC does not appear to rely upon cyclo-oxygenase (COX)2 enzyme inactivation, as
demonstrated by the persistence of therapeutic effects in the presence of prostaglandin E
2
rescue, efficacy of analog DMC with low to absent
COX inhibitory action, and the absence of effect seen with the structurally-unrelated COX2-seletcive inhibitor naproxen. For these studies, human
CD33
+
MDSC induced by cancer cell lines were co-cultured with fresh, autologous CFSE-labeled T cells at a ratio of 1:4 in the presence or
absence of drugs (black bars) and prostaglandin E2 (PGE2, gray bars) as indicated. T cell stimulation was provided by anti CD3/CD28 microbeads.
After three days in culture, T cell proliferation was measured as CFSE dilution by flow cytometry. Mean T cell proliferation shown where possible
(n = 2 for no drug, 1 μM, and 10 μM; n = 1 for 20 μ M and 20 μM + PGE2) + SD, two independent experiments. D, Transcriptional changes in
MDSC subsets associated with inactivation of suppressive function. (left panel) Reversal of CD33
+
MDSC suppressive function by ATRA, sunitinib,
and CXB correlated with decreased STAT3 and HIF1a expression (green arrows). (right panel) Functional inhibition of human CD11b
+
MDSC by
ATRA and Sunitinib correlated with decreased C/EBPb levels (green arrow), but no change in STAT3 and HIF1a mRNA levels. CXB was not found
to have inhibitory actions on CD11b
+
MDSC and it was not observed to decrease C/EBPb levels in this population. Mean shown (data from
three unique donors) + SEM, * indicates statistically significant decrease (p <0.05) in transcript level in drug-treated MDSC compared with
untreated MDSC (ANOVA with Dunnett post-test).
Lechner et al. Journal of Translational Medicine 2011, 9:90
/>Page 15 of 20
of therapeutic effects in the presence of prostaglandin E
2
rescue, efficacy of analog DMC with low to absent C OX
inhibitory action, a nd the absence of effect seen with
the structurally-unrelated COX2-selective inhibitor
naproxen (Figure 8C). Gene expression patterns in
ATRA, Sunitinb, or CXB-treated CD33
+
or CD11b
+
human MDSC were used to understand better factors
promoting suppressive function in these cells. As shown
in Figure 8D, functional inhibition of human CD33
+
MDSC by ATRA, Sunitinib, and Celecoxib correlated
with decreased S TAT3 and HIF1a transcription. In
comparison, functional inhibition of human CD11b
+
MDSC by ATRA and Sunitinib correl ated with
decreased C/EBPb levels, but no change in STAT3 and
HIF1a mRNA levels. Celecoxib was not found to have
inhibitory actions on CD11b
+
MDSC and it was not
observed to decrease C/EBPb levels in this population.
While preliminary, these data suggest that HIF1a,
STAT3, and C/ EBPb may be key transcription factors
related to suppressive function in tumor cell line-
induced human MDSC, as was recently demonstrated
for murine MDSC, and warrant further studies at the
protein level as master regulators of suppressive activity
with differential effects of human MDSC subsets.
Discussion
Human MDSC comprise a diverse and complex group
of suppressive cells that have been poorly characterized
to date. Their accumulation and suppression of T cell
responses in cancer patients, however, are quite clear
and remain a barrier to successful cancer immunother-
apy. In this study, using a new model for in vitro gen-
eration of tumor-associated human MDSC, we describe
MDSC induction as a universal feature of human can-
cers and identify two distinct subsets of MDSC.
Studies to characterize human MDSC have been lim-
ited by the primary accumulation of these suppressor
cells in individuals with significant illness (i.e .cancer,
sepsis, trauma) a nd relative absence in healthy indivi-
duals [6]. In our laboratory, induction of human MDSC
from healthy donor PBMC by a one-week co-culture
with select human cancer cell lines has allowed the gen-
eration of highly pure populations of MDSC in signifi-
cant quantities for characterization studies and
functional evaluation with autologous donor T cells.
Using this induction method, we evaluated over 100
human solid tumor cell lines for the ability to induce
canonical CD33
+
human MDSC from healthy donor
PBMC and found that these suppressor cells could be
generated by tumor cell lines of all histiologic types,
with the notable exception of breast carcinomas regard-
less of their HER2 and hormone receptor positivity.
This finding prompted us to look for the induction of a
different MDSC subset, and indeed we found that many
tumor models with absent or poor CD33
+
MDSC induc-
tion preferentia lly generated CD11b
+
MDSC. Taken col-
lectively, these data indicate that induction of MDSC is
a common feature of human cancers and as such their
presence may have a role in cancer detection and
monitoring.
Using this model system, we then probed the path-
ways of induction and functional characteristics of these
two cancer-associated MDSC subsets. Combining our
previously published cytokine and gene expression data
[16] w ith new gene expression, cytokine-induction, and
antibody neutralization studies presented here, we iden-
tified IL-6, I L-1b and GM-CSF as the major inducing
factors of CD33
+
MDSC and FLT3L and TGFb as major
contributors to CD11b
+
MDSC induct ion. Although
generated by different tumor co-culture conditions,
these two subsets appear to show at least part ial overlap
in morphology, phenotype, and function. Compared
with their normal, non-suppressive myeloid counter-
parts, CD33
+
and CD11b
+
MDSC both showed imma-
ture myeloid morphology, low HLA-DR expression, and
lacked lineage mature surface markers. MDSC have
multiple mechanisms by wh ich they can suppress T cell
effector responses, and both CD33
+
and CD11b
+
subsets
of MDSC showed up-regulation of canonical suppressive
mechanisms (ARG-1, iNOS, NOX2). Previously, we
demonstrated that subtle variations emerged in the pat-
ternsofsuppressivegenesthat were up-regulated i n
human myeloid suppressor cells by different cytokine
mixtures associated with active suppressive function
[16]. Similarly, human MDSC induced by a range of
human solid tumor cell lines exhibite d small differences
in the up-regulation of suppressive genes that likely
result from subsets within the broadly defined myeloid
suppressor cell population. Of note, some tumor models
were found to induce both CD33
+
and CD11b
+
MDSC
subsets, while others induced only one or neither popu-
lation. Stratification into CD11b
+
and CD33
+
subsets
showed greater arginase activ ity in the CD33
+
subset
and partial overlap of f unction. These results likely
reflect the complexity of myeloid suppressor cells, and
will require finer dissection in future studies.
The multiple pathways for induction and functional
overlap of these MDSC subsets likely reflect a highly
evolved, physiologic mechanism for tempering exuberant
immune responses and preventing auto immunity that is
pathologically co-opted by some tumor cells to escape
immune destruction. Indeed, inflammatory pathways
appear to be major drivers of the suppressive functions
in human MDSC induced by tumor cell lines and
should be investigated as means of MDSC generation in
sepsis and trauma patients where elevations of IL-6,
IL-1b,andTNF-a are common and possibly are driven
by the hypoxic environment of these conditions [15,42].
Lechner et al. Journal of Translational Medicine 2011, 9:90
/>Page 16 of 20
Given their pleotropic mechanisms of induction and
suppressive actions, human MDSC will be difficult to
inhibit for cancer therapy. A better therapeutic
appr oach, then, is likely t o evolve from inhibition of the
transcription factors promoting the suppressive pheno-
type.HereweshowedthatHIF1a and STAT3 are criti-
cal transcription factors in CD33
+
human MDSC and
C/EBPb in CD11b
+
MDSC, respectively, and that effec-
tive inhibition of these subsets is accompanied by selec-
tive down-regulation of these transcription factors.
These data suggest that therapies seeking to inhibit
human MDSC a t the le vel of c onversion from normal
myeloid cells will need to target multiple paths of
induction occurring through STAT3, HIF1a,and/orC/
EBPb. These s tudies also highlight a potential means of
high-throughp ut screening for MDSC-targeted therapies
using the down-regulation of STAT3/HIF1a or C/EBPb
as correlates of inhibited suppressor function. Lastly
these studies suggest that CD33
+
HLA-DR
low
HIF1a
+
and
CD11b
+
HLA-DR
low
C/EBPb
+
arehighlyspecificpheno-
types that may be used to isolate and study MDSC in
cancer patients. From this investigation, we are able to
propose a model for the induction and function of two
key MDSC subsets generated in the cancer setting
(Figure 9A and 9B). This model e ncompasses a role for
inflammatory mediators, tumor-derived cytokines, and
Figure 9 Schematic for the induction of human CD33
+
and CD11b
+
MDSC in cancer. A, Hypoxia and tumor-derived cytokines IL-1b,IL-6,
TNFa, VEGF, FLT3L, and TGFb in the tumor microenvironment promote signaling through STAT3, NFB/C/EBPb, SMAD2/4, and HIF1a pathways
in myeloid cells. In addition to oxygen-dependent HIF1a regulation, inflammatory cytokines up-regulate HIF1a transcription (via PI3K or MAPK)
and NO stabilizes HIF1a protein (via S-nitrosylation). Other factors influencing MDSC function include PBMC and tumor-derived GM-CSF, which
supports expansion of myeloid progenitors and survival of MDSC, and IFNg, which contributes to MDSC activation. Transactivation (*) between
JAK/STAT, HIF1a, and NFB signaling pathways amplifies the induction effects of tumor-derived cytokines and hypoxia in MDSC. B, Activated
transcription factors translocate to the nucleus where they up-regulate expression of suppressive genes (iNOS, NOX2, ARG-1, VEGF) and autocrine
production of putative MDSC inducers (e.g. IL-6, IL-1b, TNFa, and VEGF). The transcription factors driving suppressive function (and by extension
potential therapeutic targets) in human MDSC appear to vary by subset, with a dominant role for STAT3 and HIF1a in CD33
+
MDSC (purple) and
a dominant role for NFB-C/EBPb in CD11b
+
MDSC (pink).
Lechner et al. Journal of Translational Medicine 2011, 9:90
/>Page 17 of 20
Figure 10 Novel, minimally-invasive clinical assay for cancer detection and monitoring using MDSC biomarkers. A, Schematic showing a
novel, minimally-invasive clinical assay for cancer detection and monitoring. Patient peripheral blood cells are analyzed by routine flow
cytometry for the presence of myeloid-derived suppressor cells (MDSC) as a marker for tumor presence. Active MDSC are distinguished from
normal blood cells by a unique 3-marker phenotype that correlates directly with suppressive function. Accumulation of active MDSC correlates
directly with disease stage and tumor burden, allowing physicians to track disease stage, tumor response to therapy, and tumor recurrence or
progression by a simple blood test. B, Preliminary data demonstrating the CD33
+
MDSC subset in the peripheral blood of head and neck cancer
patients using a recently identified phenotype: CD33
+
HLA-DR
low
HIF1a
+
. Ten milliliters of peripheral blood was collected from normal, healthy
volunteers or HNSCC cancer patients under Institutional Review Board-approved studies HS-06-00579 and HS-09-00048. Cells were stained for
CD33
+
and HLA-DR
+
using fluorescence-labeled monoclonal antibodies, then cells were fixed and permeabilized for intracellular staining of
HIF1a by a third antibody. Stained sample PBMC and isotype controls were analyzed on a FACSCalibur flow cytometry using CellQuestPro
software and collecting 50,000 live leukocyte events. CD33
+
HLA-DR
low
HIF1a
+
cells were found to be 15.78-16.23% of myeloid cells in cancer
patients compared with 0.12-1.99% in healthy controls.
Lechner et al. Journal of Translational Medicine 2011, 9:90
/>Page 18 of 20
hypoxia in activating STAT3, SMAD2/4, NFB, and
HIF1 signaling in myeloid cells [15,26,38,43-46]. Signal-
ing through and transactivation among these pathways
yields up-regulation of key suppressive gene products
related to MDSC function, as well as activati on of auto-
crine or paracrine induction pathways to maintain and
expand this population [15,44,45,47-50]. We highlight
differential expression of STAT3/HIF1 a and C/EBPb in
the CD33
+
and CD11b
+
subsets, respectively, that may
aid other investigators in therapeutic targeting, subset
expansion, or MDSC monitoring in cancer patients.
Conclusions
This study is significant for its broad analysis of human
MDSC generation by a range of different cancer types
represented by human tumor cell lines. MDSC generated
by co-culture methods were then characterized for mor-
phology, phenotype, gene expression and function . These
data and methods provide an important pre-clinical tool
for other investigators to examine other aspects of
human MDSC biology and the development of MDSC-
directed therapies. Furthermore, from these analyses two
simplified phenotypes were identified that distinguish
functionally suppressive human MDSC from normal
myeloid cells. One potential use of these MDSC biomar-
kers is the detection of human MDSC in cancer patients
as a means to track disease progression and response to
therapy. Diaz-Montero and colleagues [30] initially sug-
gested that human MDSC levels correlate with disease
stage and preliminary data from an on-going clinical
study in our laboratory suggests that MDSC detection in
peripheral blood using definitive biomarkers for CD33
+
and CD11b
+
subsets can dis tinguish cancer patients from
healthy individuals (Figure 10). In conclusion, we show
MDSC induction to be a universal feature of human solid
tumors and present a novel model system for pre-clinical
studies of this important regulatory cell population.
Note
1
RussellSM,LechnerMG,GongL,MegielC,Liebertz
DJ,MasoodR,CorreaAJ,HanJ,PuriJK,SinhaUK,
Epstein AL. USC-HN2, a new model cell line for recur-
rent oral cavity squamous cell carcinoma, with immu-
nosuppressive characteristics. Oral Oncology, in press.
Abbreviations
(ARG-1): arginase-1; (C/EBP) β, 5- (and 6-): CCAAT/enhancer-binding protein;
(CFSE): carboxyfluorescein diacetate succinimidyl ester; (c-kit L): c-kit ligand
or stem cell factor; (COX2): cyclo-oxygenase 2; (FLT3L): fms-related tyrosine
kinase 3 ligand; (GAPDH): glyceraldehyde 3-phosphate dehydrogenase; (GM-
CSF): granulocyte-macrophage colony stimulating factor; (HIF-1α): hypoxia
inducible factor-1 alpha; indoleamine 2,3-dioxygenase; (iNOS): inducible nitric
oxide synthase;(IFNγ): interferon gamma; (IL): interleukin; (M-CSF):
macrophage colony stimulating factor; (MDSC): myeloid-derived suppressor
cells; (NOX2): NADPH oxidase; (NFκB): nuclear factor kappa B; (PBMC):
peripheral blood mononuclear cells; (PGE): prostaglandin E2; (Treg):
regulatory T cells; (STAT3): Signal transducer and activator of transcription 3;
(TGFβ): transforming growth factor beta; (TNFα): tumor necrosis factor alpha;
(VEGF): vascular endothelial growth factor-a.
Acknowledgements and Funding
The authors thank Dr. Dixon Gray for flow cytometry support, Lillian Young
for performing immunohistochemistry studies, Dr. Daniel Liebertz for
creation of the schematic in Figure 1, and Dr. Axel Schonthal for providing
celecoxib analogs. Furthermore, the authors thank Dr. Adi Gadzar (UT
Southwestern Medical Center, Dallas, TX), the Scott and White Clinic
(Temple, TX) and Dr. Liz Jaffe (Johns Hopkins Medical Center, Baltimore, MD)
for their generous contributions of cell lines used in these studies. This work
was supported by National Institutes of Health Training Grant Award
3T32GM067587-07S1, USC Institute for Innovation Ideas Empowered
Program, Philanthropic Educational Organization Scholars Award, and Cancer
Therapeutics Laboratories, Inc. (Los Angeles, CA).
Authors’ contributions
MGL designed the study and wrote the paper. MGL and CM developed the
methods, screened the tumor cell lines, and performed phenotype and
gene expression studies. SMR, BB, TW, and NA assisted with these studies.
ALE contributed to method development, supervised the studies, provided
tumor cell line bank and maintained cell lines, and assisted with data
interpretation. All authors reviewed the paper.
Competing interests
A.L.E. is a co-founder and was previously part-owner of Cancer Therapeutics
Laboratories, Inc. (Los Angeles, CA). All other authors declare that they have
no conflicts of interest.
Received: 31 May 2011 Accepted: 9 June 2011 Published: 9 June 2011
References
1. Stewart TJ, Smyth MJ: Improving cancer immunotherapy by targeting tumor-
induced immune suppression. Cancer Metastasis Reviews 2011, 30:125-140.
2. Peranzoni E, Zilio S, Marigo I, Dolcetti L, Zanovello P, Mandruzzato S,
Bronte V: Myeloid-derived suppressor cell heterogeneity and subset
definition. Curr Opin Immunol 2010, 22:238-244.
3. Youn JI, Nagaraj S, Collazo M, Gabrilovich DI: Subsets of myeloid-derived
suppressor cells in tumor-bearing mice. Journal of Immunology 2008,
181:5791-5802.
4. Movahedi K, Guilliams M, Van den Bossche J, Van den Bergh R, Gysemans C,
Beschin A, De Baetselier P, Van Ginderachter JA: Identification of discrete
tumor-induced myeloid-derived suppressor cell subpopulations with
distinct T cell-suppressive activity. Blood 2008, 111:4233-4244.
5. Condamine T, Gabrilovich DI: Molecular mechanisms regulating myeloid-
derived suppressor cell differentiation and function. Trends in
Immunology 2011, 32:19-25.
6. Gabrilovich DI, Nagaraj S: Myeloid-derived suppressor cells as regulators
of the immune system. Nat Rev Immunol 2009, 9:162-174.
7. Bak SP, Alonso A, Turk MJ, Berwin B: Murine ovarian cancer vascular
leukocytes require arginase-1 activity for T cell suppression. Mol Immunol
2008, 46:258-268.
8. Nagaraj S, Gabrilovich DI: Tumor escape mechanism governed by
myeloid-derived suppressor cells. Cancer Res 2008, 68:2561-2563.
9. Corzo CA, Cotter MJ, Cheng P, Cheng F, Kusmartsev S, Sotomayor E,
Padhya T, McCaffrey TV, McCaffrey JC, Gabrilovich DI: Mechanism
regulating reactive oxygen species in tumor-induced myeloid-derived
suppressor cells. J Immunol 2009, 182:5693-5701.
10. Donkor MK, Lahue E, Hoke TA, Shafer LR, Coskun U, Solheim JC, Gulen D,
Bishay J, Talmadge JE: Mammary tumor heterogeneity in the expansion
of myeloid-derived suppressor cells. Int Immunopharmacol 2009,
9:937-948.
11. Srivastava MK, Sinha P, Clements VK, Rodriguez P, Ostrand-Rosenberg S:
Myeloid-derived suppressor cells inhibit T-cell activation by depleting
cystine and cysteine. Cancer Res 2010, 70:68-77.
12. Serafini P, Mgebroff S, Noonan K, Borrello I: Myeloid-derived suppressor
cells promote cross-tolerance in B cell lymphoma by expanding
regulatory T cells. Cancer Res 2008, 68:5439-5449.
13. Dumitriu IE, Dunbar DR, Howie SE, Sethi T, Gregory CD: Human dendritic
cells produce TGF-beta 1 under the influence of lung carcinoma cells
Lechner et al. Journal of Translational Medicine 2011, 9:90
/>Page 19 of 20
and prime the differentiation of CD4+CD25+Foxp3+ regulatory T cells. J
Immunol 2009, 182:2795-2807.
14. Corzo CA, Condamine T, Lu L, Cotter MJ, Youn JI, Cheng P, Cho HI, Celis E,
Quiceno DG, Padhya T, McCaffrey TV, McCaffrey JC, Gabrilovich DI: HIF-1α
regulates function and differentiation of myeloid-derived suppressor
cells in the tumor microenvironment. J Exp Med 2010, 207:2439-2453.
15. Eltzschig HK, Carmeliet P: Hypoxia and inflammation. New England Journal
of Medicine 2011, 364:656-665.
16. Lechner MG, Liebertz DJ, Epstein AL: Characterization of cytokine-induced
myeloid-derived suppressor cells from normal human peripheral blood
mononuclear cells. J Immunol 2010, 185:2273-2284.
17. Kusmartsev S, Gabrilovich DI: Effect of tumor-derived cytokines and
growth factors on differentiation and immune suppressive features of
myeloid cells in cancer. Cancer Metastasis Rev 2006, 25:323-331.
18. Serafini P, Borrello I, Bronte V: Myeloid suppressor cells in cancer:
recruitment, phenotype, properties, and mechanisms of immune
suppression. Semin Cancer Biol 2006, 16:53-65.
19. Zhou Z, French DL, Ma G, Eisenstein S, Chen Y, Divino CM, Keller G,
Chen SH, Pan PY: Development and function of myeloid-derived
suppressor cells generated from mouse embryonic and hematopoietic
stem cells. Stem Cells 2010, 28:620-632.
20. Poschke I, Mougiakakos D, Hansson J, Masucci GV, Kiessling R: Immature
immunosuppressive CD14+HLA-DR-/low cells in melanoma patients are
Stat3hi and overexpress CD80, CD83, and DC-sign. Cancer Res 2010,
70:4335-4345.
21. Cui W, Taub DD, Gardner K: qPrimerDepot: a primer database for quantitative
real time PCR. Nucleic Acids Res 2007, 35(Database issue):D805-809.
22. Mandruzzato S, Solito S, Falisi E, Francescato S, Chiarion-Sileni V, Mocellin S,
Zanon A, Rossi CR, Nitti D, Bronte V, Zanovello P: IL4Ralpha+ myeloid-
derived suppressor cell expansion in cancer patients. J Immunol 2009,
182:6562-6568.
23. Filipazzi P, Valenti R, Huber V, Pilla L, Canese P, Iero M, Castelli C, Mariani L,
Parmiani G, Rivoltini L: Identification of a new subset of myeloid
suppressor cells in peripheral blood of melanoma patients with
modulation by a granulocyte-macrophage colony-stimulation factor-
based antitumor vaccine. J Clin Oncol 2007, 25:2546-2553.
24. Hoechst B, Voigtlaender T, Ormandy L, Gamrekelashvili J, Zhao F,
Wedemeyer H, Lehner F, Manns MP, Greten TF, Korangy F: Myeloid derived
suppressor cells inhibit natural killer cells in patients with hepatocellular
carcinoma via the NKp30 receptor. Hepatology 2009, 50:799-807.
25. Hoechst B, Ormandy LA, Ballmaier M, Lehner F, Krüger C, Manns MP,
Greten TF, Korangy F: A new population of myeloid-derived suppressor
cells in hepatocellular carcinoma patients induces CD4(+)CD25(+)Foxp3
(+) T cells. Gastroenterology 2008, 135:234-243.
26. Liu CY, Wang YM, Wang CL, Feng PH, Ko HW, Liu YH, Wu YC, Chu Y,
Chung FT, Kuo CH, Lee KY, Lin SM, Lin HC, Wang CH, Yu CT, Kuo HP:
Population alterations of L: -arginase- and inducible nitric oxide synthase-
expressed CD11b(+)/CD14 (-)/CD15 (+)/CD33 (+) myeloid-derived
suppressor cells and CD8 (+) T lymphocytes in patients with advanced-
stage non-small cell lung cancer. J Cancer Res Clin Oncol 2009, 136:35-45.
27. Ko JS, Zea AH, Rini BI, Ireland JL, Elson P, Cohen P, Golshayan A,
Rayman PA, Wood L, Garcia J, Dreicer R, Bukowski R, Finke JH: Sunitinib
mediates reversal of myeloid-derived suppressor cell accumulation in
renal cell carcinoma patients. Clin Cancer Res 2009, 15:2148-2157.
28. Zea AH, Rodriguez PC, Atkins MB, Hernandez C, Signoretti S, Zabaleta J,
McDermott D, Quiceno D, Youmans A, O’Neill A, Mier J, Ochoa AC:
Arginase-producing myeloid suppressor cells in renal cell carcinoma
patients: a mechanism of tumor evasion. Cancer Res 2005, 65:3044-3048.
29. Morse MA, Hall JR, Plate JM: Countering tumor-induced
immunosuppression during immunotherapy for pancreatic cancer. Expert
Opin Biol Ther 2009, 9:331-339.
30. Gordon IO, Freedman RS: Defective antitumor function of monocyte-
derived macrophages from epithelial ovarian cancer patients. Clin Cancer
Res 2006, 12:1515-1524.
31. Diaz-Montero CM, Salem ML, Nishimura MI, Garrett-Mayer E, Cole DJ,
Montero AJ: Increased circulating myeloid-derived suppressor cells
correlate with clinical cancer stage, metastatic tumor burden, and
doxorubicin-cyclophosphamide chemotherapy. Cancer Immunol
Immunother 2009, 58:49-59.
32. Brimnes MK, Vangsted AJ, Knudsen LM, Gimsing P, Gang AO, Johnsen HE,
Svane IM: Increased level of both CD4+FOXP3+ regulatory T cells and
CD14+HLA-DR-/low myeloid-derived suppressor cells and decreased
level of dendritic cells in patients with multiple myeloma. Scand J
Immunol 2010, 72:540-547.
33. Sadun RE, Sachsman SM, Chen X, Christenson KW, Morris WZ, Hu P,
Epstein AL: Immune signatures of murine and human cancers reveal
unique mechanisms of tumor escape and new targets for cancer
immunotherapy. Clin Cancer Res 2007, 13:4016-4025.
34. Nefedova Y, Fishman M, Sherman S, Wang X, Beg AA, Gabrilovich DI:
Mechanism of all-trans retinoic acid effect on tumor-associated myeloid-
derived suppressor cells. Cancer Research 2007, 67:11021-11028.
35. de Kleer I, Vercoulen Y, Klein M, Meerding J, Albani S, van der Zee R,
Sawitzki B, Hamann A, Kuis W, Prakken B: CD30 discriminates heat shock
protein 60-induced FOXP3+ CD4+ T cells with a regulatory phenotype. J
Immunol 2010, 185:2071-2079.
36. del Rio ML, Bernhardt G, Rodriguez-Barbosa JI, Förster R: Development and
functional specialization of CD103+ dendritic cells. Immunol Rev 2010,
234:268-281.
37. Rodriguez PC, Ernstoff MS, Hernandez C, Atkins M, Zabaleta J, Sierra R,
Ochoa AC: Arginase I-producing myeloid-derived suppressor cells in
renal cell carcinoma are a subpopulation of activated granulocytes.
Cancer Research 2009, 69:1553-1560.
38. Marigo I, Bosio E, Solito S, Mesa C, Fernandez A, Dolcetti L, Ugel S, Sonda N,
Bicciato S, Falisi E, Calabrese F, Basso G, Zanovello P, Cozzi E, Mandruzzato S,
Bronte V: Tumor-induced tolerance and immune suppression depend on
the C/EBPbeta transcription factor. Immunity
2010, 32:790-802.
39. Ko JS, Rayman P, Ireland J, Swaidani S, Li G, Bunting KD, Rini B, Finke JH,
Cohen PA: Direct and differential suppression of myeloid-derived
suppressor cell subsets by sunitinib is compartmentally constrained.
Cancer Res 2010, , 70: 3526-3536.
40. Bunt SK, Clements VK, Hanson EM, Sinha P, Ostrand-Rosenberg S:
Inflammation enhances myeloid-derived suppressor cell cross-talk by
signaling through Toll-like receptor 4. Journal of Leukocyte Biology 2009,
85:996-1004.
41. Lechner MG, Epstein AL: A new mechanism for blocking myeloid-derived
suppressor cells by CpG. Clin Cancer Res 2011, 17:1645-1648.
42. Lin HP: Celecoxib: Its non-COX-2 targets and its anti-cancer effects. PhD
Thesis Ohio State University, Pharmacy Department; 2005.
43. Adib-Conquy M, Cavaillon JM: Stress molecules in sepsis and systemic
inflammatory response syndrome. FEBS Letter 2007, 581:3723-3733.
44. Li F, Sonveaux P, Rabbani ZN, Liu S, Yan B, Huang Q, Vujaskovic Z,
Dewhirst MW, Li CY: Regulation of HIF-1α Stability through S-
nitrosylation. Mol Cell 2007, 26:63-74.
45. Kaluz S, Van Meir EG: At the crossroads of cancer and inflammation: Ras
rewires an HIF-driven IL-1 autocrine loop. J Mol Med 2011, 89:91-94.
46. Peyssonnaux C, Cejudo-Martin P, Doedens A, Zinkernagel AS, Johnson RS,
Nizet V: Cutting edge: Essential role of hypoxia inducible factor-1alpha in
development of lipopolysaccharide-induced sepsis. J Immunol 2007,
178:7516-7519.
47. Semenza GL: Targeting HIF-1 for cancer therapy. Nat Rev Cancer 2003,
3:721-732.
48. Matsusaka T, Fujikawa K, Nishio Y, Mukaida N, Matsushima K, Kishimoto T,
Akira S: Transcription factors NF-IL6 and NF-kappa B synergistically
activate transcription of the inflammatory cytokines, interleukin 6 and
interleukin 8. Proc Natl Acad Sci USA 1993, 90:10193-10197.
49. Rius J, Guma M, Schachtrup C, Akassoglou K, Zinkernagel AS, Nizet V,
Johnson RS, Haddad GG, Karin M: NF-kappaB links innate immunity to the
hypoxic response through transcriptional regulation of HIF-1alpha.
Nature 2008, 453:807-811.
50. Walmsley SR, Chilvers ER, Whyte MK: Hypoxia, hypoxia inducible factor
and myeloid cell function. Arthritis Research and Therapy 2009, 11:219-225.
51. Huang WL, Yeh HH, Lin CC, Lai WW, Chang JY, Chang WT, Su WC: Signal
transducer and activator of transcription 3 activation up-regulates
interleukin-6 autocrine production: a biochemical and genetic study of
established cancer cell lines and clinical isolated human cancer cells.
Mol Cancer 2010, 9:309.
doi:10.1186/1479-5876-9-90
Cite this article as: Lechner et al.: Functional characterization of human
Cd33
+
And Cd11b
+
myeloid-derived suppressor cell subsets induced
from peripheral blood mononuclear cells co-cultured with a diverse set
of human tumor cell lines. Journal of Translational Medicine 2011 9:90.
Lechner et al. Journal of Translational Medicine 2011, 9:90
/>Page 20 of 20