báo cáo hóa học: " Cross-diagnostic validity of the Nottingham health profile index of distress (NHPD)" doc
Bạn đang xem bản rút gọn của tài liệu. Xem và tải ngay bản đầy đủ của tài liệu tại đây (290.38 KB, 13 trang )
BioMed Central
Page 1 of 13
(page number not for citation purposes)
Health and Quality of Life Outcomes
Open Access
Research
Cross-diagnostic validity of the Nottingham health profile index of
distress (NHPD)
Christine Wann-Hansson
1
, Rosemarie Klevsgård
2
and Peter Hagell*
2,3
Address:
1
Faculty of Health and Society, Malmö University, SE-205 06, Malmö, Sweden,
2
Department of Health Sciences, Lund University, PO Box
157, SE-221 00, Lund, Sweden and
3
Department of Neurology, Lund University Hospital, SE-221 85, Lund, Sweden
Email: Christine Wann-Hansson - ; Rosemarie Klevsgård - ;
Peter Hagell* -
* Corresponding author
Abstract
Background: The Nottingham Health Profile index of Distress (NHPD) has been proposed as a
generic undimensional 24-item measure of illness-related distress that is embedded in the
Nottingham Health Profile (NHP). Data indicate that the NHPD may have psychometric advantages
to the 6-dimensional NHP profile scores. Detailed psychometric evaluations are, however, lacking.
Furthermore, to support the validity of the generic property of outcome measures evidence that
scores can be interpreted in the same manner in different diagnostic groups are needed. It is
currently unknown if NHPD scores have the same meaning across patient populations. This study
evaluated the measurement properties and cross-diagnostic validity of the NHPD as a survey
instrument among people with Parkinson's disease (PD) and peripheral arterial disease (PAD).
Methods: Data from 215 (PD) and 258 (PAD) people were Rasch analyzed regarding model fit,
reliability, differential item functioning (DIF), unidimensionality and targeting. In cases of cross-
diagnostic DIF this was adjusted for and the impact of DIF on the total score and person measures
was assessed.
Results: The NHPD was found to have good overall and individual item fit in both disorders as
well as in the pooled sample, but seven items displayed signs of cross-diagnostic DIF. Following
adjustment for DIF some aspects of model fit were slightly compromised, whereas others
improved somewhat. DIF did not impact total NHPD scores or resulting person measures, but the
unadjusted scale displayed minor signs of multidimensionality. Reliability was > 0.8 in all within- and
cross-diagnostic analyses. Items tended to represent more distress (mean, 0 logits) than that
experienced by the sample (mean, -1.6 logits).
Conclusion: This study supports the within- and cross-diagnostic validity of the NHPD as a survey
tool among people with PD and PAD. We encourage others to reassess available NHP data within
the NHPD framework to further evaluate the strengths and weaknesses of this simple patient-
reported index of illness-related distress.
Published: 2 July 2008
Health and Quality of Life Outcomes 2008, 6:47 doi:10.1186/1477-7525-6-47
Received: 5 November 2007
Accepted: 2 July 2008
This article is available from: />© 2008 Wann-Hansson et al; licensee BioMed Central Ltd.
This is an Open Access article distributed under the terms of the Creative Commons Attribution License ( />),
which permits unrestricted use, distribution, and reproduction in any medium, provided the original work is properly cited.
Health and Quality of Life Outcomes 2008, 6:47 />Page 2 of 13
(page number not for citation purposes)
Background
The Nottingham Health Profile (NHP) is a widely used 6-
dimensional (energy, pain, emotional reactions, sleep,
social isolation, and physical mobility) generic health sta-
tus questionnaire [1]. The NHP has undergone extensive
evaluation and both strengths and weaknesses have been
demonstrated [2]. A commonly observed limitation of the
NHP has been skewed score distributions with large ceil-
ing and, particularly, floor effects [3-5]. This complicates
interpretation of extreme scores and impairs the ability to
detect changes and differences. Furthermore, some of the
NHP domains have relatively few (3 to 5) dichotomous
items. This limits the precision of scores [6-8].
The NHP index of Distress (NHPD) is a 24-item measure
of illness-related distress embedded in the NHP [9]. While
it has not been extensively used or evaluated, available
data have shown promise and suggest that it can provide
a unidimensional measure of illness-related distress
[4,10-12]. Indeed, the NHPD has the potential, at least in
part, to overcome limitations associated with NHP
domain scores. The larger number of items should
improve reliability and precision of scores. Accordingly,
available studies have shown less floor/ceiling effects and
indicated better responsiveness and reliability of the
NHPD than the six NHP domain scores [4,9-12]. How-
ever, its generic properties, i.e. whether scores can be inter-
preted the same way across different diagnoses, remain to
be determined. This is particularly important because a
main assumption and theoretical advantage with generic
outcome measures is the possibility to make valid com-
parisons across patient groups. Support for these proper-
ties is gained when scales work the same way and have the
same meaning in different groups. This can be assessed by
analyzing the presence of differential item functioning
(DIF) [13,14].
Generic outcome measures can be more or less suitable
for certain groups of people. As such, the NHP has been
found to work best with chronic, disabling conditions,
and with elderly populations who are likely to have at
least some of the problems represented in each of its six
domains [2]. Parkinson's disease (PD) and peripheral
arterial disease (PAD) exemplify two chronic disabling
disorders associated with aging where the NHP has been
commonly used [4,11,15-18]. PD is a chronic progressive
neurodegenerative condition characterized by motor
symptoms such as bradykinesia, rigidity and resting
tremor. However, non-motor features such as fatigue,
depression, sleep disturbances, pain and autonomic dys-
functions are also frequent and a common source of disa-
bility [19]. PAD is associated with a wide spread arterial
disease and significantly increased risk of stroke, myocar-
dial infarction and cardiovascular death. Symptoms range
from leg pain while walking to severe pain in the limb also
at rest, non-healing ulcers and gangrene [20]. Besides pain
and restricted mobility, fatigue, emotional distress and
sleep disturbances are common problems in PAD [18].
PD and PAD therefore appear to represent suitable diag-
nostic groups for assessing the NHPD and explore its
cross-diagnostic validity and comparability.
The Rasch measurement model [21] offers particular
advantages over traditional psychometric methods in
evaluating measurement scales [8,22,23]. The model rests
on a mathematical definition of the requirements for lin-
ear measurement, which is achieved when data accord
with model specifications. Because the model articulates
measurement requirements, sources of violations to
model assumptions are sought and adjusted for in the
data rather than trying to fit another model [24]. Rasch
analysis thus determines the extent to which observed
data conform with model specifications and provides a
powerful means of assessing a scale's measurement prop-
erties, including DIF [14,23,25-28].
This study assessed the measurement properties and cross-
diagnostic validity of the NHPD as a survey instrument
among people with PD and PAD.
Methods
Samples
Data from people with PD were taken from three sources:
postal survey data from patients receiving care at a neurol-
ogy department (n = 71) [4], consecutive patients fulfill-
ing criteria for neurosurgical interventions for PD (n = 26)
[29], and consecutive PD outpatients without other signif-
icant disorders (n = 118) [30] (Table 1). All PD patients
had a neurologist diagnosed PD [31] and two of the orig-
inal samples [4,30] provided ratings (mild, moderate or
severe) of their overall perceived severity of PD [32].
PAD data were taken from two different sources: data
from 168 [16] and 90 [5] consecutive patients admitted
for treatment of lower limb ischemia at vascular surgical
units and without other diseases compromising their
walking capacity (Table 1). The severity of ischemia was
documented according to standards for grading lower
limb ischemia [33].
All original studies had cross-sectional designs and were
approved by the respective local research ethics commit-
tees.
NHP index of Distress (NHPD)
The NHPD was devised from the NHP, specifically omit-
ting items relating to physical disability and items pre-
cluding its use in hospitalized patients [9]. It consists of
24 dichotomous ("yes"/"no") items that yield a score
ranging between 0 and 24, with higher scores indicating
Health and Quality of Life Outcomes 2008, 6:47 />Page 3 of 13
(page number not for citation purposes)
more distress. In this study, the NHPD was derived from
the full 38-item NHP (Swedish version [34]), as self com-
pleted either at home [4], during study visits at the clinic
[29,30] or at admission to hospital [5,16].
Rasch analysis
The Rasch model [21,22] is a probabilistic measurement
model that separately locates persons and items on a com-
mon linear logit (log-odd units) metric, which ranges
from minus infinity to plus infinity (with mean item loca-
tion set at zero). Locations along the logit scale reflect how
much of the measured construct that is represented and
possessed by each item and person, respectively, as esti-
mated from response patterns. When data accord with the
model, Rasch derived measures have the same meaning
throughout the range of measurement and the relative
locations of any two items (or persons) are independent
of the locations of other items or persons. Furthermore,
different subsets of the same class of items (or persons)
give equivalent location estimates. These features distin-
guishes the Rasch model from other approaches such as
classical test theory, 2- and 3-parameter item response
theory models [8,23,24].
The Rasch model assumes that the scale is unidimen-
sional, i.e., that items tap a common underlying latent
trait, and that items are locally independent, i.e., the
response to one item should be independent of responses
to other items. These aspects are reflected in the fit of data
to the model [22,35], which can be assessed for each item
by dividing the sample into class intervals according to
their locations on the measured construct. Accordance
between class interval responses and model expectations
(represented by the item characteristic curve, ICC) is then
studied graphically as well as quantitatively, using stand-
ardized residuals (should range between -2.5 and +2.5)
and their associated chi-square statistics (should be non-
significant) [22,35]. In general, large negative residuals
signal local dependency and large positive values indicate
violation of unidimensionality. In addition, overall fit is
reflected in the mean and standard deviation of the resid-
uals (expected values of 0 and 1, respectively) and the
total item-trait interaction chi-square statistic (expected P-
value > 0.05).
Differential item functioning (DIF) is an additional aspect
of model fit and occurs when subgroups of people at com-
parable levels on the measured construct respond systemat-
ically differently to items [13]. DIF can produce biased
scores, thereby challenging the validity of comparing data
across subgroups, and may reflect or threaten unidimen-
sionality [36]. DIF can either be uniform (item responses
differ uniformly between groups across class intervals) or
non-uniform (group differences vary across class inter-
vals) [14,26]. Uniform DIF can be adjusted for by splitting
the item into two new items, one for each subgroup,
whereby the bias is controlled for while the information
from the item is retained [14].
Unidimensionality can be further assessed based on a
principal component analysis (PCA) of residuals and an
independent t-test approach that compares estimates of
person locations based on different item subsets [37,38].
If deviation from unidimensionality is trivial, the number
of person locations that differ between the two item sets is
small.
Analysis plan
The NHPD was Rasch analyzed using the RUMM2020
software (Rumm Laboratory Pty Ltd., Perth). We first
examined the fit of the NHPD within each of the two diag-
nostic groups separately by dividing the samples into
three class intervals with 57–61 (PD) and 68–74 (PAD)
people in each. Next, the samples were pooled and
Table 1: Sample characteristics
PAD (n = 258) PD (n = 215) P-value
Age, mean (SD) 69 (10.2) 65 (9.9) .000
a
Sex (% male/female) 57/43 57/43 .980
b
Severity of disease, n (%)
Intermittent claudicatio 141 (55.0) NA
Critical limb ischemia 117 (45.0) NA
Perceived PD severity, n (%)
c
Mild NA 37 (20.0)
Moderate NA 118 (63.0)
Severe NA 33 (17.0)
NHPD, md (q1–q4) 20.8 (8.3–37.5) 16.7 (4.2–29.2) .002
a
a
Mann-Whitney U-test.
b
Chi-square test.
c
As rated by a subset of 188 patients [4,30].
PAD, peripheral arterial disease; PD, Parkinson's disease; SD, standard deviation; NHPD, Nottingham Health Profile index of Distress; md, median;
NA, not applicable.
Health and Quality of Life Outcomes 2008, 6:47 />Page 4 of 13
(page number not for citation purposes)
divided into six class intervals with 51–78 people in each
before examination of model fit, reliability, and DIF by
diagnosis. If DIF was identified, this was adjusted for by
splitting items into disease specific items followed by re-
analyses of measurement properties. Due to the large
number of statistical tests, P-values were interpreted as sig-
nificant at the 0.05 level following Bonferroni correction
[39].
The clinical significance of any observed DIF was studied
by assessing if DIF influenced the estimated person loca-
tions (logit measures). First, the person locations
obtained after adjustment for DIF were compared to those
estimated from the non-DIF-adjusted scale. Before doing
so, items without DIF in the original scale were anchored
by their item locations from the DIF-adjusted scale to
assure that the two sets of person estimates measured on
the same metric. The two sets of person locations were
then plotted and correlated with each other to assess the
influence of DIF on people's estimated distress levels. Sec-
ond, we tested whether the same total scores reflected the
same levels of distress across samples [27]. In this proce-
dure one item block was created for each diagnosis and
arranged next to each other with missing values recorded
as responses from people with PD to the PAD specific
item block, and vice verse. A third, vertical block of items
contains the item responses for both diagnoses together,
thus providing linkage in the dataset. The three item
blocks were then treated as multiple tests and the logit val-
ues of the same summed raw scores were compared across
the samples [27].
To assess unidimensionality, two sets of person locations
were produced; one from the items with the largest (≥ 0.3)
positive residual loadings on the first principal compo-
nent and one from items with the largest negative load-
ings [38]. This was followed by independent t-tests of the
two estimated locations for each person. Unidimensional-
ity was considered statistically supported when the pro-
portion of significant individual t-tests, or the lower
bound of the associated 95% binomial confidence inter-
val, did not exceed 0.05 [38].
Finally, we assessed how well the best fitting unidimen-
sional NHPD solution accorded with the levels of illness-
related distress experienced by the sample.
Results
Raw NHPD scores covered the full range (0–24) in the
PAD sample (median, 5; q1–q3, 2–9) and ranged
between 0 and 21 (median, 4; q1–q3, 1–7) in the PD sam-
ple. The median in the combined sample was 5 (q1–q3,
2–8).
Within-diagnoses analyses
Within-diagnoses Rasch analyses showed good overall
model fit in both PD (item residual mean [SD], -0.402
[1.191]; item-trait interaction, P = 0.077) and PAD (item
residual mean [SD], -0.512 [1.064]; item-trait interaction,
P = 0.164). Reliabilities were 0.848 (PD) and 0.838
(PAD). There was no significant item level misfit in either
of the samples.
Pooled data and cross-diagnoses validity
The NHPD displayed good reliability and overall fit to the
measurement model (Table 2). At the item level, item 9
displayed a non-significant (following Bonferroni adjust-
ment) but relatively large negative fit residual value and a
somewhat large chi-square value relative to the other
items (Table 3). No other items showed signs of misfit
(Table 3).
DIF analyses identified uniform DIF by diagnosis for
seven items (Table 4; Fig. 1). After splitting these items
into two each (one for PD and one for PAD) the overall
item-trait interaction was somewhat significant (P =
0.03), whereas the overall item residual mean and stand-
ard deviation, as well as reliability, showed some
Table 2: Overall Rasch model fit statistics and reliability of the NHPD
Original NHPD NHPD adjusted for DIF
d
Item fit residual
Mean
a
-0.571 -0.488
SD
b
1.416 1.250
Total item-trait interaction
Chi-square (df) 134.337 (120) 188.538 (155)
P-value 0.175 0.034
Reliability
c
0.841 0.844
a
Should be close to 0 [35].
b
Should be close to 1 [35].
c
Index of person separation, a Rasch based reliability statistic analogous to Cronbach's alpha/KR-20 [22,35]. Indicates the degree to which people
can be separated into discrete groups. Values of 0.7 and 0.8 are the minimum required to discern two and there groups, respectively [44].
d
Items 4, 6, 7, 8, 11, 17 and 18 split by diagnosis.
NHPD, Nottingham Health Profile index of Distress; DIF, differential item functioning; SD, standard deviation; df, degrees of freedom.
Health and Quality of Life Outcomes 2008, 6:47 />Page 5 of 13
(page number not for citation purposes)
Table 3: Rasch item and fit statistics for the NHPD
a
Item statistics
c
Fit statistics
Item
b
Location SE Residual
d
Chi square
e
P-value
1 (1) Tired all the time -1.154 0.116 1.383 9.057 0.10681
2 (2) Pain at night -0.97 0.113 1.914 8.695 0.121867
3 (3) Things get me down -0.732 0.116 -1.841 5.612 0.345829
4 (4) Unbearable pain 0.425 0.14 -1.025 2.982 0.702838
5 (6) Joy forgotten 0.231 0.134 -2.03 9.32 0.09695
6 (7) Feeling on edge -1.127 0.112 0.257 4.383 0.495644
7 (8) Painful to change position -1.874 0.113 1.964 2.8 0.73085
8 (9) Feel lonely 0.297 0.136 0.521 2.791 0.732098
9 (12) Everything is an effort -0.95 0.113 -3.107 13.87 0.016456
10 (16) Days seem to drag 0.617 0.146 -1.448 3.529 0.619006
11 (20) Losing temper easily -0.409 0.12 1.321 7.45 0.189241
12 (21) Feel close to nobody 1.302 0.177 -0.336 6.317 0.276545
13 (22) Lie awake most of night 1.269 0.174 -1.313 1.735 0.884403
14 (23) Feel as if losing control 1.05 0.164 -1.557 9.758 0.082392
15 (26) Soon run out of energy -1.724 0.111 -1.318 5.277 0.383036
16 (28) In constant pain -0.356 0.12 -1.228 5.276 0.38318
17 (29) Takes long to get to sleep -0.485 0.118 0.928 4.264 0.512122
18 (30) Feel like a burden 0.075 0.13 -1.224 3.12 0.681545
19 (31) Kept awake by worries 0.904 0.157 -1.776 5.506 0.357274
20 (32) Life not worth living 0.815 0.153 -1.759 5.433 0.365301
21 (33) Sleep badly at night -0.966 0.113 0.799 1.207 0.944184
22 (34) Hard to get on with people 3.458 0.401 -0.896 1.985 0.85118
23 (37) Depressed when waking up 0.263 0.134 -2.121 6.171 0.28995
24 (38) In pain when sitting 0.042 0.129 0.193 7.798 0.167709
a
Performed with the sample divided into six class intervals according to person locations on the measured variables.
b
Original NHP item numbers in parenthesis.
c
Expressed in linear log-odds units (logits), with mean item location set at 0.
d
Residuals summarize the deviation of observed from expected responses. Deviation from the recommended [35] range of -2.5 to +2.5, indicating
item misfit, are bold.
e
Higher values represent larger deviations from model expectations.
NHPD, Nottingham Health Profile index of Distress; SE, standard error.
Table 4: NHPD items with uniform DIF by diagnosis (PD vs PAD)
a, b
Item
c
F-value
d
P-value DIF direction
e
4 (4) Unbearable pain 15.32361 0.000107 PAD > PD
6 (7) Feeling on edge 32.24345 0.000000 PD > PAD
7 (8) Painful to change position 23.15150 0.000004 PAD > PD
8 (9) Feel lonely 10.95699 0.001024 PD > PAD
11 (20) Losing temper easily 28.24274 0.000000 PD > PAD
17 (29) Takes long to get to sleep 26.16763 0.000000 PAD > PD
18 (30) Feel like a burden 12.83750 0.000385 PD > PAD
a
Performed with the sample divided into six class intervals according to person locations on the measured variables.
b
Nonuniform DIF was not detected.
c
Original NHP item numbers in parenthesis.
d
Analyses of variance of deviations from model expectation along the latent trait across people with PD and PAD.
e
Direction of observed DIF, PAD > PD indicates higher probability for people with PAD to endorse an item, and vice verse.
NHPD, Nottingham Health Profile index of Distress; DIF, differential item functioning; PD, Parkinson's disease; PAD, peripheral arterial disease.
Health and Quality of Life Outcomes 2008, 6:47 />Page 6 of 13
(page number not for citation purposes)
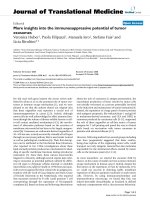
Differential item functioning (DIF) between people with PD and PADFigure 1
Differential item functioning (DIF) between people with PD and PAD. Examples of two NHPD items (panel A, item
4/"unbearable pain"; panel B, item 6/"feeling on edge") displaying cross-diagnostic DIF. The item characteristic curves (ICCs;
grey curves) represent the expected probabilities of item endorsement (y-axis) at various levels of the measured construct (x-
axis). Superimposed plots represent the observed responses by people with PD and PAD, as divided into six class intervals
according to their levels of illness-related distress. Observed differences indicate that items do not work the same way in the
two diagnostic groups. For comparison, panel C illustrates an item without DIF (item 14/"feel as if losing control").
A
B
C
Health and Quality of Life Outcomes 2008, 6:47 />Page 7 of 13
(page number not for citation purposes)
improvement (Table 2). This pattern was similar also
when considering fit statistics after successive splitting of
each item one at a time. That is, fit residual means and
standard deviations, as well as reliability, displayed vari-
ous degrees of improvements whereas chi-square values
and their associated p-values did not [see Additional file
1].
After splitting the seven DIF associated items the negative
residual for item 9 remained relatively large (-2.946) but
non-significant. Inspection of the class interval plots rela-
tive to the ICC of item 9 indicated that the overall devia-
tion from expectation primarily concerned the least
distressed class interval (Fig. 2A). Other individual item fit
residuals were not significant (range, -2.007 to 2.306).
However, item 24 showed a relatively large chi-square
value (14.019) compared to the other items (range,
1.024–11.396), although its fit residual value was good
(0.338) (Fig. 2B).
An attempt was made to improve the measure by omitting
items 9 and 24 from the DIF adjusted scale. Both resulted
in improved and non-significant overall item-trait interac-
tion statistics (omitting item 9: P = 0.133; omitting item
24: P = 0.194). However, the overall residual means and
standard deviations did not improve (omitting item 9:
mean [SD], -0.498 [1.171]; omitting item 24: mean [SD],
-0.494 [1.282]) and reliability decreased slightly (omit-
ting item 9: 0.831; omitting item 24: 0.840). Similarly,
when both items 9 and 24 were deleted the item-trait
interaction improved (P = 0.353) whereas the overall
residual mean (-0.506), standard deviation (1.228) and
reliability (0.828) did not. No additional DIF or individ-
ual item misfits were detected in either of these analyses.
Taken together, these analyses showed good model fit but
DIF by diagnosis for the original NHPD, modest signs of
misfit after adjusting for DIF, and lack of unequivocal
improvement of fit following item deletion. Given these
observations in combination with clinical considerations,
it was decided to assess the clinical significance of
observed DIF based on all 24 NHPD items.
Plots of estimated person levels of illness-related distress
derived from items with and without adjustment for DIF
were virtually identical (Fig. 3) with Pearson and intra-
class correlations of 1.0 and 0.99, respectively. We then
tested whether the same total scores reflected the same
levels of distress across samples by examining the equiva-
lence of raw scores-to-locations estimates between diag-
nosis specific and common item sets. The results showed
virtually no differences (Fig. 4).
PCA of residuals showed that the first principal compo-
nent explained 13% of the total variance among residuals
in the original NHPD and 11% of the total variance in the
DIF-adjusted scale. Using independent t-tests, person
location estimates based on items with large (> 0.3) posi-
tive and negative loadings on the first principal compo-
nent were compared. When only respondents without
minimum or maximum scores on the two subsets of items
were taken into account the proportions of significant t-
tests from the DIF-adjusted and the non-DIF-adjusted
NHPD were 0.008 and 0.037, respectively. When the full
sample was taken into account the proportions of differ-
ent estimates for the DIF-adjusted and the non-DIF-
adjusted scales were 0.064 and 0.081 (lower 95% CI
bounds, 0.04 and 0.06), respectively. This suggests some
degree of multidimensionality in the non-DIF-adjusted
scale.
Figure 5 depicts the distribution of persons relative to
items for the DIF-adjusted NHPD. The mean (SD) person
location was -1.619 (1.454), meaning that the items rep-
resent more distress than that experienced by the sample.
In terms of raw score floor and ceiling effects of the origi-
nal NHPD, 48 people who responded to all 24 items
scored 0 (10% floor effect), and another 3 people (0.06%)
with missing item responses (range, 1–10) scored 0 based
on the items they had responded to. One person who
responded to all 24 items scored maximum (0.2% ceiling
effect).
Discussion
The aim of this study was to evaluate the measurement
properties and cross-diagnostic validity of the NHPD as a
survey tool among people with PD and PAD. We found
that the NHPD displayed generally good measurement
properties but signs of DIF by diagnosis for seven items.
However, this DIF did not impact the total score, thus sup-
porting the generic measurement properties of the NHPD
among people with PD and PAD.
The most important observation from this study is that
observed DIF cancelled out and was not found to have any
meaningful effects on the total NHPD score. This conclu-
sion is based on the observation that estimated person
locations were virtually identical regardless of whether
DIF was adjusted for or not, and the linear measures cor-
responding to different raw total scores were also very
similar. The approach employed here to assess the impact
and clinical significance of DIF on the total score is rea-
sonable because the total raw score is directly related to,
and a sufficient statistic for estimation of, the linear meas-
ure of a person [35]. These results provide empirical sup-
port for the assumed generic properties of the NHPD.
However, additional studies in other target populations
are needed to generalize these conclusions.
Health and Quality of Life Outcomes 2008, 6:47 />Page 8 of 13
(page number not for citation purposes)
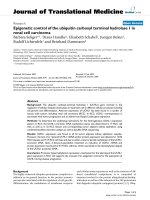
Two items with some signs of misfit in the DIF-adjusted NHPDFigure 2
Two items with some signs of misfit in the DIF-adjusted NHPD. Item characteristic curves (ICCs) of items 9 ("every-
thing is an effort"; panel A) and 24 ("in pain when sitting"; panel B) following scale adjustment for cross-diagnostic DIF. Black
dots represent the observed responses in the sample as divided into six class intervals according to their levels of illness-
related distress, indicated by red marks on the x-axis.
A
B
Health and Quality of Life Outcomes 2008, 6:47 />Page 9 of 13
(page number not for citation purposes)
Overall model fit did not improve but showed signs of
deterioration following adjustment for cross-diagnostic
DIF. This may be considered somewhat surprising given
that DIF violates model assumptions [22]. However, DIF
represents an aspect of model fit additional to that pro-
vided by residual based assessments across class intervals.
One possible explanation for the significant item-trait
interaction statistic following item splits may be that the
observed DIF were signs of multidimensionality rather
than "true" DIF among these items. This view is supported
by the lack of improved overall fit following item split and
signs of multidimensionality in the independent t-test
protocol (see below). An additional explanation could be
that item 24 displayed some signs of misfit in the DIF-
adjusted scale, although removing this item did not lead
to unequivocal improvements. The statistically significant
item-trait interaction statistic also needs to be interpreted
in view of the sample size [35,40]. If, for example, the
sample studied here had consisted of ten people less, this
statistic would not have been significant. Taken together,
we therefore consider the statistically significant item-trait
interaction not to be of any greater practical significance.
Similarly, it also appears reasonable to retain items 9 and
24 since the observed misfit largely stemmed from one
(item 9) or two (item 24) class intervals. Furthermore,
these items behaved well otherwise and their removal did
not result in unequivocal scale improvements.
The independent t-test protocol [37,38] identified signs of
multidimensionality in the scale when not adjusted for
DIF. However, given that this finding was just marginally
significant (lower 95% CI bound, 0.06) it may be argued
whether this is of any practical concern. Indeed, this test,
as any other statistical test [40], is dependent on sample
size. If, for example, half or two thirds of the current sam-
ple size had been used instead (with the same proportion
of significant individual t-tests), the statistical conclusion
would have supported unidimensionality. Therefore,
although the independent t-test protocol appears more
useful in detecting multidimensionality than residual
based fit indices and factor analytic approaches [37,38] it
must be borne in mind that this, in itself, also is a some-
what arbitrary test. Inferences are dependent on and,
therefore, differ according to sample sizes [40]. Other
aspects of this test also need to be considered. First,
although often considered non-problematic with sample
sizes above 200 [41], methods such as PCA assumes that
data are normally distributed. Secondly, the rationale for
the suggested loading of 0.3 as a cut-off to define items to
be included in the independent t-test protocol [38] is
unclear and other criteria could also be conceivable; addi-
tional studies regarding the optimal approach to using
this test are warranted. Unidimensionality is not an abso-
lute but a relative matter and there is no single agreed-
upon method to test unidimensionality. Therefore, the
decision whether a scale is sufficiently unidimensional
should ultimately come from outside the data and be
driven by the purpose of measurement and clinical/theo-
retical considerations [22].
In accordance with expectations and previous observa-
tions [4,10,12] we found the NHPD to display considera-
bly less floor effects than the original NHP dimension
scores typically have and that the observed proportion
met the suggested 15% criterion [42]. This is an important
observation because large floor and ceiling effects impact
the possibility to differentiate between respondents and
detect changes over time [43]. However, examination of
the distribution of persons and items in this study
revealed that a proportion of people exhibited levels of
distress that were lower than that covered by the NHPD
items. The implication of this observation is that those
people are measured with less precision and confidence,
which impacts the ability of the scale to reliably detect dif-
ferences and changes in this region of the outcome space.
However, the NHPD was still able to distinguish among
three different strata of people, as indicated by reliabilities
above 0.8 [44], and experiences from clinical trials in PD
and post-acute inpatient care [11,45,46] have provided
general support for its responsiveness.
Although the NHPD appears more useful than the six-
dimensional NHP, our observations are in general agree-
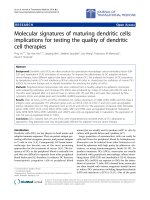
Impact of DIF on person measuresFigure 3
Impact of DIF on person measures. Scatterplot of loca-
tions (logit measures) of each person estimated from the
NHPD after adjustment for DIF by means of item split (y-
axis) compared to those obtained from the original items not
adjusted for DIF but anchored by DIF-free item calibrations
from the DIF-adjusted scale (x-axis).
Health and Quality of Life Outcomes 2008, 6:47 />Page 10 of 13
(page number not for citation purposes)
ment with recommendations for the NHP [2] and suggest
that the NHPD probably is most suitable for studies of
people with chronic, disabling conditions expected to
experience relatively high levels of distress. The suitability
of a scale relates to the purpose of its use. For example, our
observations suggest that the NHPD would not be suita-
ble for a clinical trial targeting people experiencing rela-
tively mild disease impact, whereas there is support for its
usefulness in trials aimed at more severely affected indi-
viduals. The NHPD also appears useful for survey pur-
poses, where it generally (and arguably) is of greatest
concern to identify those who fare least well. Increasing
the number of items and/or modifying the response scale
from a dichotomous to a polytomous one [47] may pro-
vide means of improving and expanding the scale's useful-
ness.
The sample used here was drawn from earlier studies not
designed for the present purpose. However, we do not
consider this a major problem since the Rasch model ena-
bles scale items to be examined in a way that is freed from
the characteristics of the study sample. Another limitation
could be the concurrent use of multiple questionnaires in
some of the original studies and the fact that people did
not respond to the 24-item NHPD but to the 38-item
NHP, from which NHPD data were derived. This may,
hypothetically, have influenced responses and, hence,
psychometric performance. However, this strategy is a
common procedure in psychometric studies and has gen-
erally not been found problematic [48-50]. Nevertheless,
further studies using only the NHPD and not the full NHP
are warranted. Furthermore, our data did not allow us to
address some important measurement properties such as
test-retest stability and responsiveness. Finally, this study
only considered two diagnostic groups. Additional analy-
ses in other patient populations are needed to further
determine the generic properties of the NHPD.
Conclusion
The NHPD displayed good measurement properties
among people with PD and PAD but exhibited varying
degrees of DIF by diagnosis for seven items. Although this
DIF may represent some degree of multidimensionality, it
did not have a clinically significant impact on the total
score. This supports the generic measurement properties
of the NHPD as a sufficiently unidimensional survey tool
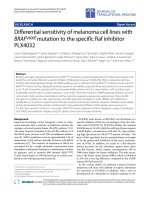
Total NHPD scores and their corresponding logit measuresFigure 4
Total NHPD scores and their corresponding logit measures. Comparison of raw total NHPD scores' (y-axis) logit val-
ues (x-axis) from the combined PD+PAD sample (curve 1, blue) and with each item treated as a diagnostic specific item (curves
2 and 3, red and green).
1 = PD+PAD 2 = PD 3 = PAD
Health and Quality of Life Outcomes 2008, 6:47 />Page 11 of 13
(page number not for citation purposes)
among people with PD and PAD. These results should
encourage others to consider using the NHPD as a simple
patient-reported index of illness-related distress in
chronic disabling disorders and to reassess available NHP
data within the NHPD framework to further evaluate its
strengths and weaknesses.
Competing interests
The authors declare that they have no competing interests.
Authors' contributions
CWH conducted literature searches, participated in
designing the study, data analyses and interpretation, and
drafting of the manuscript. RK participated in designing
the study and drafting of the manuscript. PH conceptual-
ized and participated in designing the study, conducted
the analyses and drafted the manuscript. All authors col-
lected data and read and approved the final manuscript.
Additional material
Acknowledgements
The authors wish to thank all participating patients for their cooperation.
The study was supported by the Swedish Research Council and the Skane
County Council Research and Development Foundation.
References
1. Hunt SM, McKenna SP, McEwen J, Backett EM, Williams J, Papp E: A
quantitative approach to perceived health status: a valida-
tion study. J Epidemiol Community Health 1980, 34(4):281-286.
2. McEwen J, McKenna S: Nottingham Health Profile. In Quality of
Life and Pharmacoeconomics in Clinical Trials Second edition. Edited by:
Spilker B. Philadelphia , Lippincott-Raven Publishers; 1996:281-286.
3. Bouchet C, Guillemin F, Paul-Dauphin A, Briancon S: Selection of
quality-of-life measures for a prevention trial: a psychomet-
ric analysis. Control Clin Trials 2000, 21(1):30-43.
Additional file 1
Overall fit statistics for the NHPD following successive split of NHPD
items displaying signs of DIF between PD and PAD. Step-by-step changes
in mean item fit residual values and total item-trait chi-square statistics
during successive split of of NHPD items displaying signs of DIF between
people with PD and PAD.
Click here for file
[ />7525-6-47-S1.doc]
TargetingFigure 5
Targeting. Distribution of the locations of people (upper panel) and NHPD items (lower panel) on the common logit metric
(negative values = less illness-related distress) following adjustment for DIF.
Health and Quality of Life Outcomes 2008, 6:47 />Page 12 of 13
(page number not for citation purposes)
4. Hagell P, Whalley D, McKenna SP, Lindvall O: Health status meas-
urement in Parkinson's disease: validity of the PDQ-39 and
Nottingham Health Profile. Mov Disord 2003, 18(7):773-783.
5. Wann-Hansson C, Hallberg IR, Risberg B, Klevsgard R: A compari-
son of the Nottingham Health Profile and Short Form 36
Health Survey in patients with chronic lower limb ischaemia
in a longitudinal perspective. Health Qual Life Outcomes 2004, 2:9.
6. Andrich D: On the distribution of measurements in units that
are not arbitrary. SSI 2003, 42(4):557-589.
7. Fayers PM, Machin D: Quality of life: the assessment, analysis
and interpretation of patient-reported outcomes. Second
edition. West Sussex , John Wiley & Sons, Ltd.; 2007.
8. Wright BD, Masters GN: Rating scale analysis. Chicago , MESA
Press; 1982.
9. McKenna SP, Hunt SM, Tennant A: The development of a
patient-completed index of distress from the Nottingham
Health Profile: A new measure for use in cost-utility studies.
Br J Med Econ 1993, 6:13-24.
10. Lovas K, Kalo Z, McKenna SP, Whalley D, Pentek M, Genti G: Estab-
lishing a standard for patient-completed instrument adapta-
tions in Eastern Europe: experience with the Nottingham
Health Profile in Hungary. Health Policy 2003, 63(1):49-61.
11. Martinez-Martin P, Grandas F, Linazasoro G, Bravo JL: Conversion
to controlled-release levodopa/carbidopa treatment and
quality of life as measured by the Nottingham Health Profile.
The STAR Study Group. Neurologia 1999, 14(7):338-343.
12. Nishimura K, Hajiro T, McKenna SP, Tsukino M, Oga T, Izumi T:
Development and psychometric analysis of the Japanese ver-
sion of the Nottingham Health Profile: cross-cultural adapta-
tion. Intern Med 2004, 43(1):35-41.
13. Holland PW, Wainer H: Differential item functioning. Mahwah,
NJ , Lawrence Erlbaum Associates; 1993.
14. Tennant A, Penta M, Tesio L, Grimby G, Thonnard JL, Slade A, Law-
ton G, Simone A, Carter J, Lundgren-Nilsson A, Tripolski M, Ring H,
Biering-Sorensen F, Marincek C, Burger H, Phillips S: Assessing and
adjusting for cross-cultural validity of impairment and activ-
ity limitation scales through differential item functioning
within the framework of the Rasch model: the PRO-ESOR
project. Med Care 2004, 42(1 Suppl):I37-48.
15. Karlsen KH, Tandberg E, Arsland D, Larsen JP: Health related qual-
ity of life in Parkinson's disease: a prospective longitudinal
study. J Neurol Neurosurg Psychiatry 2000, 69(5):584-589.
16. Klevsgard R, Hallberg IR, Risberg B, Thomsen MB: Quality of life
associated with varying degrees of chronic lower limb ischae-
mia: comparison with a healthy sample. Eur J Vasc Endovasc Surg
1999, 17(4):319-325.
17. Peto V, Jenkinson C: Quality of life measures in Parkinson´s dis-
ease. In Quality of life in Parkinson´s disease Edited by: Marínez-Martín
P, Koller WC. Barcelona , MASSON, S.A.; 1999:37-53.
18. Wann-Hansson C, Hallberg IR, Risberg B, Lundell A, Klevsgard R:
Health-related quality of life after revascularization for
peripheral arterial occlusive disease: long-term follow-up. J
Adv Nurs 2005, 51(3):227-235.
19. Chaudhuri KR, Healy DG, Schapira AH: Non-motor symptoms of
Parkinson's disease: diagnosis and management. Lancet Neurol
2006, 5(3):235-245.
20. Dormandy JA, Rutherford RB: Management of peripheral arte-
rial disease (PAD). TransAtlantic Inter-Society Consensus
(TASC). Eur J Vasc Endovasc Surg 2000, 19 Suppl A:Si-xxviii, S1-
250.
21. Rasch G: Probabilistic models for some intelligence and
attainment tests. Copenhagen , Danmarks Paedagogiske Institut;
1960.
22. Andrich D: Rasch models for measurement. Beverly Hills , Sage
Publications, Inc.; 1988.
23. Massof RW: The measurement of vision disability. Optom Vis Sci
2002, 79(8):516-552.
24. Andrich D: Controversy and the Rasch model: a characteristic
of incompatible paradigms? Med Care 2004, 42(1 Suppl):I7-16.
25. Hagquist C: Evaluating composite health measures using
Rasch modelling: an illustrative example. Soz Praventivmed
2001, 46(6):369-378.
26. Hagquist C, Andrich D: Is the Sense of Coherence instrument
applicable on adolescents? A latent trait analysis using Rasch
modelling.
Personality and individual differences 2004, 36:955-968.
27. Lundgren-Nilsson A, Tennant A, Grimby G, Sunnerhagen KS: Cross-
diagnostic validity in a generic instrument: an example from
the Functional Independence Measure in Scandinavia. Health
Qual Life Outcomes 2006, 4:55.
28. Tennant A, McKenna SP, Hagell P: Application of Rasch analysis
in the development and application of quality of life instru-
ments. Value Health 2004, 7 Suppl 1:S22-6.
29. Reimer J, Grabowski M, Lindvall O, Hagell P: Use and interpreta-
tion of on/off diaries in Parkinson's disease. J Neurol Neurosurg
Psychiatry 2004, 75(3):396-400.
30. Hagell P, Hoglund A, Reimer J, Eriksson B, Knutsson I, Widner H,
Cella D: Measuring fatigue in Parkinson's disease: a psycho-
metric study of two brief generic fatigue questionnaires. J
Pain Symptom Manage 2006, 32(5):420-432.
31. Gibb WR, Lees AJ: The relevance of the Lewy body to the
pathogenesis of idiopathic Parkinson's disease. J Neurol Neuro-
surg Psychiatry 1988, 51(6):745-752.
32. Hagell P, Sandlund B: Patients’ self-assessment of disease and
symptom severity in Parkinson’s disease. Qual Life Res 2000,
9(3):285.
33. Rutherford RB, Baker JD, Ernst C, Johnston KW, Porter JM, Ahn S,
Jones DN: Recommended standards for reports dealing with
lower extremity ischemia: revised version. J Vasc Surg 1997,
26(3):517-538.
34. Wiklund I, Romanus B, Hunt SM: Self-assessed disability in
patients with arthrosis of the hip joint. Reliability of the
Swedish version of the Nottingham Health Profile. Int Disabil
Stud 1988, 10(4):159-163.
35. Andrich D, Sheridan B, Luo G: Interpreting RUMM. Perth , RUMM
Laboratory Pty Ltd.; 2005.
36. Borsboom D: When does measurement invariance matter?
Med Care 2006, 44(11 Suppl 3):S176-81.
37. Smith EV Jr.: Detecting and evaluating the impact of multidi-
mensionality using item fit statistics and principal compo-
nent analysis of residuals.
J Appl Meas 2002, 3(2):205-231.
38. Tennant A, Pallant J: Unidimensionality matters. Rasch Meas
Trans 2006, 20:1048-1051.
39. Bland JM, Altman DG: Multiple significance tests: the Bonfer-
roni method. BMJ 1995, 310(6973):170.
40. Feinstein AR: P-values and confidence intervals: two sides of
the same unsatisfactory coin. J Clin Epidemiol 1998,
51(4):355-360.
41. Hair JF, Black B, Babin B, Anderson RE, Tatham RL: Multivariate
data analysis (6th edition). Upper Saddle River, NJ , Prentice Hall;
2006.
42. McHorney CA, Tarlov AR: Individual-patient monitoring in clin-
ical practice: are available health status surveys adequate?
Qual Life Res 1995, 4(4):293-307.
43. Baron R, Elashaal A, Germon T, Hobart J: Measuring outcomes in
cervical spine surgery: think twice before using the SF-36.
Spine 2006, 31(22):2575-2584.
44. Smith EV Jr.: Evidence for the reliability of measures and valid-
ity of measure interpretation: a Rasch measurement per-
spective. J Appl Meas 2001, 2(3):281-311.
45. Hagell P, Crabb L, Pogarell O, Schrag A, Widner H, Brooks DJ, Oertel
WH, Quinn NP, Lindvall O: Health-related quality of life follow-
ing bilateral intrastriatal transplantation in Parkinson's dis-
ease. Mov Disord 2000, 15(2):224-229.
46. Harris R, Wilson-Barnett J, Griffiths P: Effectiveness of nursing-
led inpatient care for patients with post-acute health care
needs: secondary data analysis from a programme of rand-
omized controlled trials. J Eval Clin Pract 2007, 13(2):198-205.
47. Cleopas A, Kolly V, Perneger TV: Longer response scales
improved the acceptability and performance of the Notting-
ham Health Profile. J Clin Epidemiol 2006, 59(11):1183-1190.
48. Fayers PM, Machin D: Quality of life: Assessment, analysis and
interpretation. West Sussex , John Wiley & Sons, Ltd.; 2000.
49. Gandek B, Ware JE, Aaronson NK, Apolone G, Bjorner JB, Brazier JE,
Bullinger M, Kaasa S, Leplege A, Prieto L, Sullivan M: Cross-valida-
tion of item selection and scoring for the SF-12 Health Sur-
vey in nine countries: results from the IQOLA Project.
International Quality of Life Assessment. J Clin Epidemiol 1998,
51(11):1171-1178.
50. Jenkinson C, Fitzpatrick R, Peto V, Greenhall R, Hyman N: The
PDQ-8: Development and validation of a short-form Parkin-
Publish with BioMed Central and every
scientist can read your work free of charge
"BioMed Central will be the most significant development for
disseminating the results of biomedical research in our lifetime."
Sir Paul Nurse, Cancer Research UK
Your research papers will be:
available free of charge to the entire biomedical community
peer reviewed and published immediately upon acceptance
cited in PubMed and archived on PubMed Central
yours — you keep the copyright
Submit your manuscript here:
/>BioMedcentral
Health and Quality of Life Outcomes 2008, 6:47 />Page 13 of 13
(page number not for citation purposes)
son’s disease questionnaire. Psychology & Health 1997,
12(6):805-814.