báo cáo hóa học: " Patterns of health-related quality of life and patterns associated with health risks among Rhode Island adults" doc
Bạn đang xem bản rút gọn của tài liệu. Xem và tải ngay bản đầy đủ của tài liệu tại đây (320.51 KB, 11 trang )
BioMed Central
Page 1 of 11
(page number not for citation purposes)
Health and Quality of Life Outcomes
Open Access
Research
Patterns of health-related quality of life and patterns associated
with health risks among Rhode Island adults
Yongwen Jiang* and Jana Earl Hesser
Address: Center for Health Data and Analysis, Rhode Island Department of Health, Providence, Rhode Island, USA
Email: Yongwen Jiang* - ; Jana Earl Hesser -
* Corresponding author
Abstract
Background: Health-related quality of life (HRQOL) has become an important consideration in
assessing the impact of chronic disease on individuals as well as in populations. HRQOL is often
assessed using multiple indicators. The authors sought to determine if multiple indicators of
HRQOL could be used to characterize patterns of HRQOL in a population, and if so, to examine
the association between such patterns and demographic, health risk and health condition
covariates.
Methods: Data from Rhode Island's 2004 Behavioral Risk Factor Surveillance System (BRFSS)
were used for this analysis. The BRFSS is a population-based random-digit-dialed telephone survey
of adults ages 18 and older. In 2004 RI's BRFSS interviewed 3,999 respondents. A latent class
regression (LCR) model, using 9 BRFSS HRQOL indicators, was used to determine latent classes
of HRQOL for RI adults and to model the relationship between latent class membership and
covariates.
Results: RI adults were categorized into four latent classes of HRQOL. Class 1 (76%) was
characterized by good physical and mental HRQOL; Class 2 (9%) was characterized as having
physically related poor HRQOL; Class 3 (11%) was characterized as having mentally related poor
HRQOL; and Class 4 (4%) as having both physically and mentally related poor HRQOL. Class 2
was associated with older age, being female, unable to work, disabled, or unemployed, no
participation in leisure time physical activity, or with having asthma or diabetes. Class 3 was
associated with being female, current smoking, or having asthma or disability. Class 4 was
associated with almost all the same predictors of Classes 2 and 3, i.e. older age, being female, unable
to work, disabled, or unemployed, no participation in leisure time physical activity, current
smoking, with having asthma or diabetes, or with low income.
Conclusion: Using a LCR model, the authors found 4 distinct patterns of HRQOL among RI
adults. The largest class was associated with good HRQOL; three smaller classes were associated
with poor HRQOL. We identified the characteristics of subgroups at higher-risk for each of the
three classes of poor HRQOL. Focusing interventions on the high-risk populations may be one
approach to improving HRQOL in RI.
Published: 11 July 2008
Health and Quality of Life Outcomes 2008, 6:49 doi:10.1186/1477-7525-6-49
Received: 19 December 2007
Accepted: 11 July 2008
This article is available from: />© 2008 Jiang and Hesser; licensee BioMed Central Ltd.
This is an Open Access article distributed under the terms of the Creative Commons Attribution License ( />),
which permits unrestricted use, distribution, and reproduction in any medium, provided the original work is properly cited.
Health and Quality of Life Outcomes 2008, 6:49 />Page 2 of 11
(page number not for citation purposes)
Background
Two overarching US Healthy People 2010 objectives are
"to increase quality and years of healthy life," and "to
eliminate health disparities" [1]. With the transition from
infectious disease and acute illness to chronic disease and
degenerative illness as leading causes of death, quality of
life has become an important aspect in assessing the bur-
den of disease.
Health-related quality of life (HRQOL) refers to an indi-
vidual's perception of their own physical and mental
health, and their ability to react to factors in the physical
and social environments [1]. It also includes aspects of life
that affect perceived physical or mental health [2-4].
HRQOL is predictive of morbidity and mortality and is
recognized as an important public health indicator [2-4].
It is increasingly used to monitor the burden of disease in
a population [3] and is taken into consideration in deci-
sion-making regarding resource allocation, intervention
design, and chronic disease management [5]. Continuous
monitoring of population HRQOL gives public health
agencies data they need to assess, protect, and promote
population health. Tracking population HRQOL helps
identify health disparities, evaluate progress on achieving
broad health goals such as Healthy People 2010, and
informs public health policy [4].
HRQOL is subjective and, therefore, cannot be measured
directly [1]. Individual HRQOL indicators have been
developed to assess different aspects of HRQOL. Building
on our earlier analyses of HRQOL indicators for the
Rhode Island population [6], we wished to answer the fol-
lowing questions: Is it possible to characterize HRQOL
with summary measures so health planners can track
Rhode Island's HRQOL over time? Is it possible to charac-
terize patterns of HRQOL in Rhode Island's population?
What are the predictors of different patterns of HRQOL?
Can we quantify the percentage of RI's population that
has good versus compromised HRQOL? To explore these
questions, we applied a latent class regression model
(LCR) to data from RI's 2004 BRFSS, including 9 HRQOL
indicators.
Methods
A LCR model is a statistical model for categorical data that
can be used to identify classes of respondents and exam-
ine the association between covariates and latent class
membership [7]. In this study, a LCR model was fit to
identify a pattern of HRQOL in the Rhode Island popula-
tion, to determine what proportion of the population can
be characterized by classes of HRQOL within this pattern,
and to examine associations between demographics,
health risks, and health conditions and classes of HRQOL
among Rhode Island adults, adjusted for all other varia-
bles in the model. We used the nine HRQOL indicators
from the 2004 Rhode Island BRFSS data.
The BRFSS is an ongoing, state-based, cross-sectional,
annual random-digit-dialed telephone survey of the non-
institutionalized civilian population ages 18 years or
older. It has been sponsored since 1984 by the Centers for
Disease Control and Prevention (CDC), which provides
funding, methodological specifications, and technical
assistance to participating states. The BRFSS is conducted
currently in all 50 states, the District of Columbia, Guam,
Puerto Rico, and the Virgin Islands [8]. The survey moni-
tors the prevalence of key health- and safety-related
behaviors and characteristics for the leading causes of dis-
ease and death among adults [8,9]. In 1993, the CDC
developed the "Healthy Days Measures", a set of 4 ques-
tions for the Behavioral Risk Factor Surveillance System
(BRFSS) core survey [5]. CDC designed these questions to
measure HRQOL in the general population and to assess
an individual's perceptions of their general health status,
physical and mental health, and activity limitations
related to physical or mental health [5]. In response to
growing interest in HRQOL, CDC developed an expanded
set of questions, which have been available for use with
the BRFSS since 1995. These questions measure multiple
dimensions of HRQOL including "specific types of activ-
ity limitation and common physical and emotional symp-
toms" [10]. Rhode Island has included the "core" and
expanded HRQOL questions on its annual BRFSS from
1997 through 2006.
Data source
The authors used Rhode Island's 2004 BRFSS data for this
analysis. A professional survey organization under con-
tract to the Rhode Island Department of Health con-
ducted Rhode Island's 2004 BRFSS. From January through
December 2004, the Rhode Island BRFSS conducted
approximately 333 random-digit-dialed telephone inter-
views each month with adults ages 18 and older, for a
total of 3,999 (1,531 males and 2,468 females) during the
calendar year. The response rate in 2004, as defined by the
Council of American Survey Research Organizations
(CASRO), was 51%. Rhode Island's 2004 BRFSS data and
technical details are available upon request from the
Center for Health Data and Analysis, Rhode Island
Department of Health [11].
Indicators
This study used data from nine HRQOL questions. The
first question asked respondents to rate their general
health as excellent, very good, good, fair, or poor. These
responses were dichotomized into (1) excellent, very
good, or good and (2) fair or poor. The remaining eight
questions asked respondents to estimate the frequency of
various conditions during the previous 30 days as follows:
Health and Quality of Life Outcomes 2008, 6:49 />Page 3 of 11
(page number not for citation purposes)
"How many days did poor physical or mental health keep
you from doing your usual activities?" (Activity limita-
tion); "How many days was your physical health, which
includes physical illness or injury, not good?" (Physically
unhealthy); "How many days did pain make it difficult to
do your usual activities?" (Pain related activity limita-
tion); "How many days have you felt very healthy and full
of energy?" (We used the converse for Lack of energy.);
"How many days did you feel you did not get enough rest
or sleep?" (Lack of rest/sleep), "How many days did you
feel worried, tense, or anxious?" (Worried/tense/anxious);
"How many days was your mental health, which includes
stress, depression, and problems with emotions, not
good?" (Mentally unhealthy); and "How many days did
you feel sad, blue, or depressed?" (Sad/blue/depressed)
[6,8,12,13]. Responses were dichotomized into 0 to 13
(infrequent) and 14 to 30 (frequent) unhealthy days
[14,13]. The authors used the cut-off of 14 or more days
vs. 13 or fewer days because most of the publications we
reviewed utilized this convention in analyzing the BRFSS
HRQOL indicators [2,14-20]. Adopting this precedent
assured comparability. In addition, clinicians and clinical
researchers often use "14 or more days" as a marker for
clinical depression and anxiety disorders, and longer
symptomatic durations are associated with higher levels
of activity limitation [12,21]. Detailed definitions of the
nine indicators are available in our previous paper [6] or
are accessible via CDC's HRQOL website [12].
Covariates
The authors examined twelve characteristics as potential
confounders in the analyses. These included: five standard
demographic measures (age, sex, race/Hispanic ethnicity,
income, and employment); four health conditions
(asthma, diabetes, obesity, and physical disability); and
three health risk behaviors (smoking, chronic alcohol use,
and no leisure physical activity). Current asthma status
was ascertained by asking respondents, "Has a doctor ever
told you that you had asthma", and then "do you still
have asthma?" Diabetes status was ascertained by asking
respondents, "Have you ever been told by a doctor that
you have diabetes?" Responses were coded as "yes", "yes
during pregnancy", or "no". Gestational diabetes was
coded as "no" diabetes. Disability status was based on
responses to two questions: "Are you limited in any way
in any activities because of physical problems?" "Do you
now have any health problem that requires you to use spe-
cial equipment, such as a cane, a wheelchair, a special bed,
or a special telephone?" Responses were coded as "yes" if
they answered "yes" to either of these two questions.
Body mass index was calculated as weight in kilograms
divided by the square of height in meters. A respondent
was considered obese if their body mass index was ≥ 30
kg/m
2
. A current smoker was defined as someone who
had smoked at least 100 cigarettes in their lifetime and
who indicated they presently smoke every day or some
days. Men were considered chronic drinkers if they drank
an average of 2 drinks or more every day during the past
30 days, while women were considered chronic drinkers if
they drank an average of 1 or more drinks per day during
the past 30 days. A respondent was considered to be phys-
ically inactive if they did not participate in any leisure
time physical activity or exercise during the previous 30
days [13]. Selection of these variables paralleled the meth-
ods employed by other studies which have examined rela-
tionships between a specific HRQOL indicator and
various predictors [16,22], or which have examined mul-
tiple HRQOL indicators in relation to demographics
[2,23], health risks [2,19,24], or specific health conditions
[2,17,18,25-27]. In addition, our preliminary modelling
identified these as important variables to retain while a
number of others were eliminated. We dichotomized
some variables for the analysis (i.e., sex, current smoking,
alcohol use, physical activity, asthma, diabetes, obesity,
disability), while others had multiple categories (i.e., age,
race/Hispanic ethnicity, income, and employment sta-
tus). The definitions of the 12 variables are available in
our previous paper [6]. Reference groups chosen for the
LCR model were those having the lowest risk for poor/fair
general health and usually the lowest risk for the other
HRQOL variables as well.
Statistical analysis
The latent class regression (LCR) model was proposed ini-
tially by Dayton and Macready [28,29]. It aims to identify
a set of classes of a latent variable from a set of observed
discrete variables [30-32]. It also provides the probability
of a particular individual belonging to a latent class [33].
The LCR model is a model for multiple indicators of latent
classes. In contrast to logistic or linear regression models,
it focuses attention on the set of latent classes identified in
the analysis, rather than considering each of the observed
indicators separately or all possible combinations of the
observed indicators [30]. Detailed descriptions of the LCR
model are available elsewhere [28,29,34,35].
In the LCR model, the unit of analysis is the response pat-
tern [7,36]. A response pattern is the set of responses given
by an individual to a set of indicator questions. In our
study, there are nine indicators of HRQOL with a total of
512 possible response patterns (2
9
). The authors used the
LCR model to group these 512 patterns into a much
smaller number of classes.
The LCR model is specified in two parts: (1) a model for
the relationship between the latent classes and the
observed indicators; (2) a regression model for the rela-
tionship between covariates and latent class membership
[34].
Health and Quality of Life Outcomes 2008, 6:49 />Page 4 of 11
(page number not for citation purposes)
The LCR model has two fundamental quantities: the mar-
ginal and the conditional probabilities [30]. The marginal
probabilities can be interpreted as the prevalence of each
latent class, and they must sum to 1.00, indicating that in
addition to being mutually exclusive, the classes are
exhaustive. The marginal probabilities tell us what pro-
portion of the population is located in each class. The con-
ditional probabilities are the class-specific response
probabilities of each indicator variable. The conditional
probabilities are considered before considering the mar-
ginal probabilities of the classes [30,37].
The one-class model was fit first, followed by sequentially
increasing the number of latent classes in order to deter-
mine the most parsimonious model providing an ade-
quate fit to the data [31,33,36]. Having compared all the
models, the LCR model with the optimal number of latent
classes was selected. It is common in latent class analysis
to fit models with different numbers of classes and com-
pare them by Bayesian information criterion (BIC) and
choose the model with the smallest BIC values [37,38].
Then, the prevalence of participants in each of the latent
classes, and the conditional probability of the indicator
variables for a participant in a given class, are assessed.
Finally, the LCR model also makes it possible to estimate
the effects of covariates on predicting latent class member-
ship [39].
The study utilized the Mplus (version 3.11) software to
implement these procedures, because it can accommodate
the BRFSS weight variable. All models were estimated
using maximum likelihood estimation. Ten sets of ran-
dom starting values were specified for the final stage of
maximum likelihood optimization to avoid the issue of
local maxima and to ensure all values converge to identi-
cal solutions [32,33,37]. We obtained parameter esti-
mates and standard errors of estimates for each indicator
of poor HRQOL, in relation to each of the 12 independent
variables. The t-test was used to identify statistically signif-
icant relationships (p (two-sided) ≤ 0.05).
In order to maintain maximal sample size and retain all
valid data for the LCR, we simulated missing data for all
variables using multiple imputation (MI). MI has been
extensively applied to handle missing data in survey sam-
ples [40,41]. A basic assumption of MI is that missing data
are missing at random [40]. In our study, 6 complete data-
sets were created by replacing missing values with simu-
lated values. A detailed description of MI is available in
our previous paper [6].
Results
Descriptive information
Frequencies and percentages for demographic characteris-
tics, health risks, health conditions, and HRQOL indica-
tors appear in Table 1. Overall, 14.85% had fair or poor
general health. Results for the other 8 indicators based on
the criterion of 14 or more days of poor health in the past
month were as follows: 6.75% had activity limitations
due to a physical or mental health problem; 10.55% had
poor physical health; 9.7% had pain related activity limi-
tations; 28.8% reported lack of energy; 23.8% reported
inadequate sleep or rest; 13.2% were worried, tense or
anxious; 10.5% had poor mental health; and 8.2% were
sad, blue or depressed.
Patterns of HRQOL
During the first stage of analysis, conventional latent class
models, ignoring covariates, were fit to the HRQOL indi-
cator data, demographics and health risks, starting with a
1-class model, and progressing to a model with four
classes of HRQOL. The analysis indicated that the four-
class model is the better model. During the second stage
of analysis, when covariates were included in the models,
the four-class LCR model with 12 covariates was selected
as it had the lowest BIC score. The four latent classes are
characterized as follows: Class 1 is characterized by phys-
ically and mentally good HRQOL; Class 2 was character-
ized as having physically related poor HRQOL; Class 3
was characterized as having mentally related poor
HRQOL; and Class 4 as having both physically and men-
tally related poor HRQOL.
Table 2 presents estimates of (1) the marginal probability
(proportion) of each of the 4 latent classes and (2) the
conditional probabilities of each indicator for each latent
class. RI adults in latent Class 1 (referred to as "healthy
people"), accounted for 76% of the population; latent
Class 2 (referred to as "physically unhealthy people"),
comprised 9%; latent Class 3 ("mentally unhealthy peo-
ple"), comprised 11%; and latent Class 4 ("both mentally
and physically unhealthy people"), comprised 4% (see
Table 2).
Healthy people (class 1) have low probabilities (less than
17%) for each of the indicators of poor HRQOL. Con-
versely, both physically and mentally unhealthy people
(class 4) have large probabilities (larger than 63%) for
each of the poor HRQOL indicators. Physically unhealthy
people (class 2) have high probabilities for the physical
health indicators and low probabilities for the mental
health indicators, while mentally unhealthy people (class
3) have low probabilities for the physical health indica-
tors and high probabilities for the mental health indica-
tors (see Table 2).
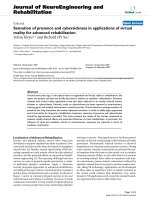
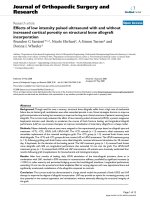
Figure 1 is a diagrammatic representation of RI adults in
latent classes 1–4. It visually demonstrates the unique
divergence between Classes 2 and 3 and the magnitude of
the difference between Classes 1 and 4.
Health and Quality of Life Outcomes 2008, 6:49 />Page 5 of 11
(page number not for citation purposes)
Predictors regressed on classes of HRQOL
The LCR model was used to determine which variables are
significant predictors of latent class membership, when
adjusting for all other variables in the model. Odds ratios
are presented in Table 3 with latent Class 1 (healthy peo-
ple) treated as the reference group.
Table 1: Percentage for selected demographics, risk factors, health conditions, and HRQOL indicators among Rhode Island adults,
2004
†
Demographics, risk factors & health conditions n % HRQOL indicators n %
Age group 18–44 years 1524 51.0 Poor/fair general health 670 14.8
45–64 years 1588 30.4 Activity limitation
‡
311 6.7
65 + years 837 18.5 Physically unhealthy
‡
495 10.5
Gender Men 1531 47.2 Pain related activity limitation
‡
417 9.7
Women 2468 52.8 Lack of energy
‡
1117 28.8
Race/ethnicity White, non-Hispanic 3367 84.7 Mentally unhealthy
‡
455 10.5
Hispanic 332 8.8 Sad/blue/depressed
‡
343 8.2
Other 244 6.5 Worried/tense/anxious
‡
516 13.2
Income < $25 k 960 24.9 Lack of rest/sleep
‡
879 23.8
$25 k-49,999 986 28.2
$50 k + 1519 46.9
Employment Unable to work 246 4.7
Unemployed 237 6.0
Homemaker/Student 298 10.3
Retired 795 17.3
Employed 2410 61.7
Current smoker Current smoker 820 21.3
Not current smoker 3168 78.7
Chronic drinker Chronic drinker 270 7.6
Not chronic drinker 3700 92.4
Activity Leisure time activity 1026 24.2
No leisure time activity 2971 75.8
Asthma Asthma 421 9.6
No asthma 3559 90.4
Diabetes Diabetes 328 7.2
No diabetes 3670 92.8
Obesity Obese (BMI>30) 762 19.0
Not obese 3016 81.0
Disability Have disability 717 15.3
No disability 3064 84.7
†: Sample size is 3999.
‡: Criteria is >=14 days/month, see methods for complete variable description.
Table 2: Estimated parameters for the 4-class model
Indicators Healthy people (Class 1) Physically unhealthy people
(Class 2)
Mentally unhealthy people
(Class 3)
Both physically and mentally
unhealthy people (Class 4)
Marginal probability
(Proportion)
0.759 0.090 0.108 0.042
Conditional probability
Poor/fair general health 0.062 0.682 0.081 0.749
Activity limitation
†
0.000 0.383 0.054 0.658
Physically unhealthy
†
0.017 0.641 0.061 0.702
Pain related activity
limitation
†
0.013 0.515 0.130 0.631
Lack of energy
†
0.166 0.703 0.588 0.890
Lack of rest/sleep
†
0.162 0.247 0.615 0.724
Worried/tense/anxious
†
0.021 0.134 0.605 0.889
Mentally unhealthy
†
0.017 0.122 0.430 0.866
Sad/blue/depressed
†
0.002 0.037 0.336 0.936
†: Criteria is >=14 days/month, see methods for complete variable description.
Health and Quality of Life Outcomes 2008, 6:49 />Page 6 of 11
(page number not for citation purposes)
Statistically significant results occur for each of the three
latent classes for sex, current asthma, and disability. In
general, women, people with asthma, and people with
disability have greater odds of poor HRQOL in each Class
than men, people without asthma, and non-disabled peo-
ple. Disability is a highly relevant health condition for
poor HRQOL. People with disability have exceptionally
high odds ratios for each class of poor HRQOL, e.g. Class
2 OR = 21.43, Class 3 OR = 3.34, Class 4 OR = 19.16.
Being unable to work, unemployed, having no leisure
time physical activity, and having diabetes were associated
significantly with Classes 2 and 4. They predicted poor
physical HRQOL among RI adults.
Current smokers were 1.93 times more likely to be men-
tally unhealthy than non-smokers, and 3.26 times more
likely to be both physically and mentally unhealthy.
Table 3 shows that older age has a significantly increased
association with membership in Class 2 (OR = 1.75 for
45–64 years and OR = 2.39 for 65+ years). On the other
hand, increased age is related inversely to membership in
Class 3 (OR = 0.72 for 45–64 year and OR = 0.22 for 65+
years).
The lowest income category was associated significantly
with Class 4 (being both physically and mentally
unhealthy) (OR = 3.67). There were no significant rela-
tionships observed for race/ethnicity, chronic drinking, or
obesity.
To summarize: Class 2 was associated significantly with
older age, being female, unable to work, disabled, or
unemployed, having no leisure time physical activity, or
having asthma or diabetes. Class 3 was associated with
being female, being disabled, current smoking, or having
asthma. Class 4 combined almost all the predictors of
both Classes 2 and 3, e.g. being female, unable to work,
disabled or unemployed, current smoking, having no lei-
sure time physical activity, having asthma or diabetes, or
having very low household income.
Discussion
Several observations were made in utilizing a two-stage
LCR model to determine latent classes of HRQOL. First,
latent class models with different numbers of classes
(1,2,3, and 4) were estimated initially without any covari-
ates. Then, covariates (e.g., age, gender, race/ethnicity,
income, employment, etc.) were included in the models.
Since the inclusion of covariates changed the number of
Latent class membership of Rhode Island adults in relation to HRQOL indicatorsFigure 1
Latent class membership of Rhode Island adults in relation to HRQOL indicators.
0.0
0.1
0.2
0.3
0.4
0.5
0.6
0.7
0.8
0.9
1.0
P
o
o
r
/
f
a
i
r
g
e
n
e
r
a
l
h
e
a
l
t
h
A
c
t
i
v
i
t
y
l
i
m
i
t
a
t
i
o
n
P
h
y
s
i
c
a
l
l
y
u
n
h
e
a
l
t
h
y
P
a
i
n
r
e
l
a
t
e
d
a
c
t
i
v
i
t
y
l
i
m
i
t
a
t
i
o
n
L
a
c
k
o
f
e
n
e
r
g
y
L
a
c
k
o
f
r
e
s
t
/
s
l
e
e
p
W
o
r
r
i
e
d
/
t
e
n
s
e
/
a
n
x
i
o
u
s
M
e
n
t
a
l
l
y
u
n
h
e
a
l
t
h
y
S
a
d
/
b
l
u
e
/
d
e
p
r
e
s
s
e
d
Probability
Class 1: Healthy (76%)
Class 2: Physically unhealt hy (9 %)
Class 3: M ent ally unhealt hy (11%)
Class 4: Unhealt hy (4 %)
Health and Quality of Life Outcomes 2008, 6:49 />Page 7 of 11
(page number not for citation purposes)
cases in each class, we found it was necessary to conduct
classification simultaneously with class membership pre-
dictions [42]. Second, the local maximum is often
encountered in likelihood estimation with LCR models.
Thus, we used multiple sets of different starting values as
recommended by [33,37]. Third, in choosing a LCR clas-
sification model it is important that each class have a rea-
sonable number of observations, and that the latent
classes estimated be interpretable [37].
As a result of our analysis, we have divided the Rhode
Island population into four latent classes of HRQOL. The
single class having good HRQOL has been labelled
"healthy". The three classes having poor HRQOL have
been labelled "physically unhealthy", "mentally
unhealthy", and "both physically and mentally
unhealthy". Three-fourths (76%) of Rhode Island adults
are in the "healthy" class, while about one-fourth is in the
"unhealthy" classes. The classes of "physically unhealthy"
(9%), and "mentally unhealthy" (11%), together com-
prise 20% of RI adults, while 4% of adults are classed as
"both physically and mentally unhealthy".
After controlling for all variables in the models, we iden-
tified the demographic characteristics, health conditions,
and health risks having significantly increased odds, inde-
pendent of one another, of being associated with one or
more or the three classes of poor HRQOL. Other investi-
gators assessing one or more of the HRQOL indicators in
relation to demographics, health risks and health condi-
tions have found similar associations
[2,3,10,13,15,17,20,22,25].
Disability, Asthma, and Gender
Significantly increased odd ratios for each of the three
classes of poor HRQOL are associated with being disa-
bled, having asthma, or being female in our study of
Rhode Island's 2004 BRFSS data. The odds ratios for
"physically unhealthy" and "physically and mentally
unhealthy" poor HRQOL associated with being disabled
Table 3: Demographic characteristics and risk factors regressed on three classes of HRQOL
†
Demographics, risk factors & health conditions Physically unhealthy (Class 2)
‡
Mentally unhealthy (Class 3)
‡
Both physically and mentally
unhealthy (Class 4)
‡
Age group 18–44 years Reference Reference Reference
45–64 years 1.75(1.01–3.01)* 0.72(0.46–1.11) 1.12(0.59–2.13)
65+ years 2.39(1.04–5.47)* 0.22(0.10–0.49)*** 0.29(0.09–0.89)*
Gender Men Reference Reference Reference
Women 1.57(1.05–2.34)* 1.63(1.11–2.41)* 2.15(1.25–3.71)**
Race/ethnicity White, non-Hispanic Reference Reference Reference
Hispanic 1.05(0.45–2.46) 0.64(0.25–1.60) 2.07(0.81–5.27)
Other 1.20(0.49–2.90) 0.89(0.44–1.77) 1.28(0.46–3.58)
Income <$25 k 1.56(0.87–2.80) 1.90(0.94–3.83) 3.67(1.50–8.98)**
$25 k-49,999 0.97(0.56–1.68) 1.53(0.94–2.49) 1.39(0.57–3.38)
$50 k + Reference Reference Reference
Employment Unable to work 6.35(2.98–13.54)*** 0.80(0.17–3.78) 12.34(4.45–34.27)***
Unemployed 2.25(1.05–4.84)* 1.67(0.79–3.51) 4.70(1.63–13.52)**
Retired 0.96(0.50–1.86) 0.35(0.14–0.88)* 2.45(0.86–7.00)
Homemaker/student 0.42(0.17–1.04) 0.72(0.32–1.62) 0.91(0.30–2.81)
Employed Reference Reference Reference
Current smoker Current smoker 1.19(0.73–1.97) 1.93(1.26–2.95)** 3.26(1.90–5.61)***
Not current smoker Reference Reference Reference
Chronic drinker Chronic drinker 0.96(0.32–2.92) 1.55(0.84–2.86) 0.74(0.10–5.35)
Not chronic drinker Reference Reference Reference
Activity Leisure time activity Reference Reference Reference
No leisure time activity 3.04(1.98–4.67)*** 1.20(0.68–2.12) 4.22(2.19–8.12)***
Asthma Asthma 2.44(1.29–4.59)** 1.94(1.12–3.36)* 4.99(2.46–10.15)***
No asthma Reference Reference Reference
Diabetes Diabetes 3.00(1.71–5.25)*** 0.82(0.37–1.81) 3.68(1.75–7.74)***
No diabetes Reference Reference Reference
Obesity Obese (BMI>30) 1.19(0.78–1.82) 1.54(0.97–2.45) 1.31(0.76–2.25)
Not obese Reference Reference Reference
Disability Have disability 21.43(13.87–33.12)*** 3.34(1.93–5.77)*** 19.16(9.98–36.81)***
No disability Reference Reference Reference
†: Data are reported as adjusted odd ratios (AORs) by all other variables in the model, 95% confidence intervals (CIs) are reported in parentheses.
‡: Healthy people (Class 1) as reference group.
*: Statistically significant, ***p < 0.001; **p < 0.01; *p < 0.05.
Health and Quality of Life Outcomes 2008, 6:49 />Page 8 of 11
(page number not for citation purposes)
were exceptionally high (OR = 21.43 and 19.16 respec-
tively), and conform with findings of Strine et al. [13] who
used the BRFSS to examine disability in relation to the
individual indicators of poor HRQOL. Likewise, Strine
[20], and Ford et al. [2] found that persons with asthma
were significantly more likely than those without asthma
to be at increased risk for several of the single indicators of
poor HRQOL. Another study [43] found that people with
asthma from Los Angeles county, CA experienced worse
quality of life than people without asthma. These studies
have also identified that women are significantly more
likely than men to have poor HRQOL [13,20,44]. Women
in the reproductive age group, who tend to carry more of
the load than men for household labor, child-care, and
parental care, frequently experience a substantial amount
of physical and mental distress, depression, and stress or
anxiety, and a high proportion of these women do not get
enough rest or sleep [15].
Several subpopulations in our study had significantly
increased odds ratios of having "physically unhealthy" as
well as "physically and mentally unhealthy" poor
HRQOL. These included: those unable to work, unem-
ployed, lacking any leisure physical activity, or with diabe-
tes. Other studies have also identified these same risk
groups at high risk for poor HRQOL [3,43].
Employment
Brown et al. [2] showed, after multivariable adjustment,
that unemployed adults were twice as likely as employed
adults to have poor quality of life. Unemployment may
affect health directly; it can also provoke adverse risk
behaviors, like smoking and heavy drinking [2]. Unem-
ployed persons represent a population in need of public
health intervention to reduce the burden of physical and
mental distress.
Physical inactivity
Unger [45] reported that the lack of any leisure physical
activity was associated with a high risk of reporting poor
physical health for men, and these relationships were sig-
nificant only in the older age groups for women. Brown et
al. [2] found an association between no leisure physical
activity and HRQOL for both physical and mental health,
but being physically unhealthy appeared to be more
strongly associated with inactivity than being mentally
unhealthy. Considering that one of the ultimate goals of
Healthy People 2010 is to improve quality of life, these
results highlight the need for health promotion programs
that encourage physically active lifestyles and increase
participation in regular physical activity [2,45].
Diabetes
In a study among adults 50 years and older by Brown et
al. [3,46], diabetes was associated with impaired physical
health but not with impaired mental health, after multi-
variable adjustment. Preventing diabetes and its compli-
cations through health education that stresses a balanced
diet and increased activity should be a public health pri-
ority [3].
Smoking
Current smokers had increased odd ratios for "mentally
unhealthy" and for "mentally and physically unhealthy"
poor HRQOL. These findings of poor HRQOL are consist-
ent with previous studies [6,47,48]. Lasser et al. [47] sug-
gested that people with poor mental health are more
likely to smoke than those who have good mental health.
Strine et al. [49] found there is a significant association
between smoking and impaired mental health, and cur-
rent smokers were more likely to drink heavily, and to
report mental health symptoms. Providing mental health
services in conjunction with smoking-cessation programs,
and vice versa, is indicated.
Income
Having an annual household income under $25,000 in
our study increased the odds ratios of having "mentally
and physically unhealthy" poor HRQOL (OR 3.67), com-
pared with the high income group. A strong relationship
between low income and poor physical and mental
HRQOL is consistent with the results of other research
[6,46,50]. Ôunpuu et al. [48] showed low income is asso-
ciated with health impairment. Kahn et al. [50] found
women with young children in the lowest fifth of distribu-
tion of household income were at substantially higher risk
of poor health and depression. Household income influ-
ences physical and mental health, which indicates the
need to target interventions on such households.
Older age
Our research found that the odds ratios of having "physi-
cally unhealthy" poor HRQOL was elevated for those ages
45 and older, and especially for those over age 65, com-
pared with younger adults. CDC (Zahran et al.) [51]
reported that low-income adults aged 45–64 years have
worse HRQOL than all other adults. Unemployment, ina-
bility to work, and activity limitation partially explain
these HRQOL disparities in this age-income group [51].
Targeting these risk factors and improving social services
(e.g., job training programs) could help increase the qual-
ity and years of healthy life and eliminate health dispari-
ties for persons in this age group [51]. However,
independent of these other covariates, our findings dem-
onstrate the positive relationship between older age and
physically unhealthy poor HRQOL, which is not surpris-
ing considering the vast array of physical ailments that are
prevalent among older individuals. Public policy and
interventions related to the promotion of healthier life-
styles and improved access and affordability of health care
Health and Quality of Life Outcomes 2008, 6:49 />Page 9 of 11
(page number not for citation purposes)
and medications should be targeted at this age group to
improve and prolong physical health, longevity, and qual-
ity of life.
Associations with better HRQOL
The odds ratios of having "mentally unhealthy" poor
HRQOL in our study decreased with increasing age, and
for retired people, compared with those currently
employed. This observation likely reflects that older
healthy and independent adults are more able to partici-
pate in the phone survey.
Study limitations
There are five major limitations to our study and method-
ology. First, because of the cross-sectional design of the
survey, we cannot determine the temporal relationship
between classes of poor HRQOL and any of the risk fac-
tors. Future longitudinal studies are needed to investigate
these relationships appropriately. Second, the BRFSS
excludes households without land-line telephones, and
adults living in institutional settings, such as group homes
and nursing homes. Such exclusions undoubtedly under-
estimate the proportion of the adult population with
compromised quality of life [46]. Third, self-reported data
are affected by recall bias, that is over- and under-report-
ing of behaviors and existing disease [52]. Fourth, no sta-
tistical software package currently available for complex
design survey data (e.g. SAS, SUDAAN, SPSS, STATA) can
do any modeling other than logistic and regression analy-
ses. We use a logistic regression analysis to test the differ-
ence between results obtained using survey design SAS
procedures (SURVEYLOGISTIC) and standard SAS proce-
dures (LOGISTIC). These two procedures are almost the
same except that the SURVEYLOGISTIC procedure
includes strata and cluster statements, while the LOGIS-
TIC procedure does not include strata and cluster state-
ments. The LOGISTIC Procedure uses the weight variable
rescaled to sample size (wt = n*_finalwt/Σ_finalwt). The
parameter estimates from the two procedures are the
same. The standard errors are slightly different; the stand-
ard error from the LOGISTIC procedure is less than the
standard error from the SURVEYLOGISTIC procedure,
because the latter uses a sandwich-type robust estimator
to account for strata and the sampling proportion. The
sampling proportion is used to adjust the finite popula-
tion. In addition, every individual in the BRFSS is a PSU,
so the results with the cluster statement are the same as the
results without the cluster statement. Whether we used
_finalwt or the rescaled weight variable to run the SUR-
VEYLOGISTIC procedure, the results are the same. When
we do two Latent Class Regression analyses, one using
_finalwt and one using the rescaled weight variable, the
results are the same. Considering the acceptable difference
between standard error estimates using LOGISTIC and
SURVEYLOGISTIC, we have generalized this finding to
LCR, which can be run with Mplus statistical software.
Mplus can accommodate sample weights in performing
latent class analyses, but not the strata used in the sam-
pling design. Fifth, the limitations of the BRFSS survey
meant some chronic health conditions which likely have
a significant impact on quality of life, such as heart disease
or cancer, could not be included in identifying high risk
subgroups.
Study advantages
Despite these limitations, the BRFSS is the only data
source available for assessment of HRQOL in Rhode
Island's adult population. Because it is a continuing
annual survey, it allows us to track the prevalence of
health behaviours, health conditions, and HRQOL over
time and among populations at risk. Public health practi-
tioners can use these data to target resources and interven-
tions for both the mental and physical needs of
subpopulations of Rhode Islanders with risk factors that
are most associated with different types of poor HRQOL.
Because it is easier to communicate about four classes of
HRQOL than about each of nine individual HRQOL indi-
cators, these classes provide an effective means of assess-
ing progress towards RI's Healthy People 2010 goal of
increasing the quality of life for Rhode Islanders [1].
Conclusion
Using a LCR model we found four distinct classes of
HRQOL among Rhode Island adults and were able to
quantify the prevalence of each. The largest class has good
HRQOL; three smaller classes have poor HRQOL, includ-
ing physically unhealthy, mentally unhealthy, and both
physically and mentally unhealthy. We also identified the
demographic, health risk, and health condition character-
istics of groups at high risk for the three classes with poor
HRQOL.
The difference between our approach and others which
have assessed the individual HRQOL indicators are: (1)
we have created a meaningful and simple model to char-
acterize and quantify population HRQOL; (2) we have
identified subgroups within the population that have an
elevated risk for three, two or one classes of poor HRQOL,
these subgroups being: persons with disabilities, with
asthma, with diabetes, who are unemployed or unable to
work, women, smokers, and the elderly. These subgroups
are identifiable and potentially reachable with creative
policy and intervention initiatives. Focusing interventions
on high-risk groups may be more beneficial in reducing
the burden of poor physical and mental health and
improving HRQOL for Rhode Island as a whole than if
broad efforts are directed to the entire population. Fur-
thermore, this strategy could certainly be more cost effec-
tive and could reduce the total economic cost of health
care in the state.
Health and Quality of Life Outcomes 2008, 6:49 />Page 10 of 11
(page number not for citation purposes)
Further investigation would be needed to gain a better
understanding about the relationship between specific
disease conditions, health risks, or demographics and
compromised quality of life. Our results substantiate the
need for ongoing support for individuals with specific
chronic disease conditions (e.g. diabetes and asthma) to
enhance their quality of life, and indicate how important
early intervention and prevention are for these condi-
tions. Our study also substantiates the importance of
physical activity as a behavioral mediator that affects both
health conditions and quality of life. Furthermore, it calls
particular attention to the critical importance of having
adequate mental health services if quality of life is to
improve for Rhode Island's population.
List of abbreviations
BRFSS: Behavioral Risk Factor Surveillance System; CDC:
Centers for Disease Control and Prevention; CI: Confi-
dence Interval; HRQOL: Health-Related Quality of Life;
LCR: Latent Class Regression Model; MI: Multiple Imputa-
tion.
Competing interests
The authors declare that they have no competing interests.
Authors' contributions
YJ contributed to the preparation of the database, con-
ducted the literature review, collaborated on analytic deci-
sions and data interpretation, performed the statistical
analyses, prepared the data tables, and drafted the manu-
script. JEH manages the RI BRFSS, collaborated on ana-
lytic decisions and data interpretation, and revised and
edited the manuscript. Both authors have read and
approved the final version of the manuscript.
Acknowledgements
The authors would like to express their thanks to Matthew M. Zack for
reviewing and commenting on earlier versions of this article, and Donald
Perry for reviewing and commenting on the final draft. We would like to
thank our colleagues in the Rhode Island Department of Health for their
comments and suggestions as the manuscript evolved. Research for, and
preparation of, this article were supported by the BRFSS Cooperative
Agreement #U58/CCU10058 from CDC. The views expressed in this
paper are those of the authors and do not necessarily represent the views
of the Rhode Island Department of Health.
References
1. U.S. Department of Health and Human Services: Healthy People
2010: understanding and improving health. Washington, DC
2nd edition. 2000.
2. Brown DW, Balluz LS, Heath GW, Moriarty DG, Ford ES, Giles WH,
Mokdad AH: Associations between recommended levels of
physical activity and health-related quality of life. Findings
from the 2001 Behavioral Risk Factor Surveillance System
(BRFSS) survey. Prev Med 2003, 37(5):520-528.
3. Brown DW, Balluz LS, Giles WH, Beckles GL, Moriarty DG, Ford ES,
Mokdad AH: Diabetes mellitus and health-related quality of
life among older adults. Findings from the behavioral risk
factor surveillance system (BRFSS). Diabetes Res Clin Pract 2004,
65(2):105-115.
4. Moriarty DG, Zack MM, Kobau R: The Centers for Disease Con-
trol and Prevention's Healthy Days Measures – Population
tracking of perceived physical and mental health over time.
Health Qual Life Outcomes 2003, 1(1):37.
5. Currey SS, Rao JK, Winfield JB, Callahan LF: Performance of a
generic health-related quality of life measure in a clinic pop-
ulation with rheumatic disease. Arthritis Rheum 2003,
49(5):658-664.
6. Jiang Y, Hesser JE: Associations between health-related quality
of life and demographics and health risks. Results from
Rhode Island's 2002 behavioral risk factor survey. Health Qual
Life Outcomes 2006, 4:14.
7. Flaherty BP: Assessing reliability of categorical substance use
measures with latent class analysis. Drug Alcohol Depend 2002,
68(Suppl 1):S7-20.
8. CDC's Behavioral Risk Factor Surveillance System Website
[ />]
9. U.S. Centers for Disease Control and Prevention: Behavioral Risk
Factor Surveillance System user's guide. Atlanta 1996.
10. Centers for Disease Control and Prevention: Health-related qual-
ity of life and activity limitation – eight states, 1995. MMWR
1998, 47(7):134-140.
11. Rhode Island Department of Health: 2004 Behavioral Risk Factor
Surveillance System Technical Report. Providence: Center for
Health Data and Analysis 2004.
12. CDC's Health-Related Quality of Life Website [http://
www.cdc.gov/hrqol/]
13. Strine TW, Hootman JM, Chapman DP, Okoro CA, Balluz L: Health-
related quality of life, health risk behaviors, and disability
among adults with pain-related activity difficulty. Am J Public
Health 2005, 95(11):2042-2048.
14. Barrett DH, Boehmer TK, Boothe VL, Flanders WD, Barrett DH:
Health-related quality of life of U.S. military personnel: a
population-based study. Mil Med 2003, 168(11):941-947.
15. Ahluwalia IB, Holtzman D, Mack KA, Mokdad A: Health-related
quality of life among women of reproductive age: Behavioral
Risk Factor Surveillance System (BRFSS), 1998–2001. J Wom-
ens Health (Larchmt) 2003, 12(1):5-9.
16. Centers for Disease Control and Prevention: Self-reported fre-
quent mental distress among adults – United States, 1993–
2001. MMWR 2004, 53(41):963-966.
17. Ford ES, Moriarty DG, Zack MM, Mokdad AH, Chapman DP: Self-
reported body mass index and health-related quality of life:
findings from the Behavioral Risk Factor Surveillance Sys-
tem. Obes Res 2001, 9(1):21-31.
18. Hassan MK, Joshi AV, Madhavan SS, Amonkar MM: Obesity and
health-related quality of life: a cross-sectional analysis of the
US population. Int J Obes Relat Metab Disord 2003,
27(10):1227-1232.
19. Okoro CA, Brewer RD, Naimi TS, Moriarty DG, Giles WH, Mokdad
AH: Binge drinking and health-related quality of life: do pop-
ular perceptions match reality? Am J Prev Med 2004,
26(3):230-233.
20. Strine TW, Balluz L, Chapman DP, Moriarty DG, Owens M, Mokdad
AH: Risk behaviors and healthcare coverage among adults by
frequent mental distress status, 2001. Am J Prev Med 2004,
26(3):213-216.
21. Milazzo-Sayre LJ, Henderson MJ, Manderscheid RW: Serious and
severe mental illness and work: what do you know? In Mental
Disorder, Work Disability and the Law Edited by: Bonnie RJ, Monahan J.
Chicago: University of Chicago Press; 1997.
22. Kobau R, Safran MA, Zack MM, Moriarty DG, Chapman D: Sad,
blue, or depressed days, health behaviors and health-related
quality of life, Behavioral Risk Factor Surveillance System,
1995–2000. Health Qual Life Outcomes
2004, 2:40.
23. Centers for Disease Control and Prevention: Public health and
aging: health-related quality of life among low-income per-
sons aged 45–64 years – United States, 1995–2001. MMWR
2003, 52(46):1120-1124.
24. Rejeski WJ, Brawley LR, Shumaker SA: Physical activity and
health-related quality of life. Exerc Sport Sci Rev 1996, 24:71-108.
25. Dominick KL, Ahern FM, Gold CH, Heller DA: Health-related
quality of life among older adults with arthritis. Health Qual
Life Outcomes 2004, 2(1):5.
Publish with BioMed Central and every
scientist can read your work free of charge
"BioMed Central will be the most significant development for
disseminating the results of biomedical research in our lifetime."
Sir Paul Nurse, Cancer Research UK
Your research papers will be:
available free of charge to the entire biomedical community
peer reviewed and published immediately upon acceptance
cited in PubMed and archived on PubMed Central
yours — you keep the copyright
Submit your manuscript here:
/>BioMedcentral
Health and Quality of Life Outcomes 2008, 6:49 />Page 11 of 11
(page number not for citation purposes)
26. Goins RT, Spencer SM, Krummel DA: Effect of obesity on health-
related quality of life among Appalachian elderly. South Med J
2003, 96(6):552-557.
27. Larsson U, Karlsson J, Sullivan M: Impact of overweight and obes-
ity on health-related quality of life – a Swedish population
study. Int J Obes Relat Metab Disord 2002, 26(3):417-424.
28. Dayton CM, Macready GB: Concomitant-Variable Latent-Class
Models. Journal of the American Statistical Association 1988,
83(401):173-178.
29. Xue QL, Bandeen-Roche K: Combining complete multivariate
outcomes with incomplete covariate information: a latent
class approach. Biometrics 2002, 58(1):110-120.
30. McCutcheon AL: Latent class analysis. Newbury Park, Calif.: Sage
Publications; 1987.
31. Reboussin BA, Song EY, Shrestha A, Lohman KK, Wolfson M: A
latent class analysis of underage problem drinking: evidence
from a community sample of 16–20 year olds. Drug Alcohol
Depend 2006, 83(3):199-209.
32. van Lang ND, Ferdinand RF, Ormel J, Verhulst FC: Latent class
analysis of anxiety and depressive symptoms of the Youth
Self-Report in a general population sample of young adoles-
cents. Behav Res Ther 2006, 44(6):849-860.
33. Monga N, Rehm J, Fischer B, Brissette S, Bruneau J, El-Guebaly N,
Noel L, Tyndall M, Wild C, Leri F, et al.: Using latent class analysis
(LCA) to analyze patterns of drug use in a population of ille-
gal opioid users. Drug Alcohol Depend 2006.
34. Larsen K: Joint analysis of time-to-event and multiple binary
indicators of latent classes. Biometrics 2004, 60(1):85-92.
35. Bandeen-Roche K, Miglioretti DL, Zeger SL, Rathouz PJ: Latent Var-
iable Regression for Multiple Discrete Outcomes. Journal of
the American Statistical Association 1997, 92(440):1375-1386.
36. Strauss SM, Rindskopf DM, Astone-Twerell JM, Des Jarlais DC, Hagan
H: Using latent class analysis to identify patterns of hepatitis
C service provision in drug-free treatment programs in the
U.S. Drug Alcohol Depend 2006, 83(1):15-24.
37. Carlson RG, Wang J, Falck RS, Siegal HA: Drug use practices
among MDMA/ecstasy users in Ohio: a latent class analysis.
Drug Alcohol Depend 2005, 79(2):167-179.
38. Guo J, Wall M, Amemiya Y: Latent class regression on latent fac-
tors. Biostatistics 2006, 7(1):145-163.
39. Linzer DA, Lewis J: poLCA: Polytomous Variable Latent Class
Analysis. 2006 [ />poLCA/].
40. Rubin DB: Multiple imputation after 18+ years. J Am Stat Assoc
1996, 91:473-489.
41. Schafer JL: Multiple imputation: a primer. Stat Methods Med Res
1999, 8(1):3-15.
42. Yamaguchi K: Multinomial Logit Latent-Class Regression Mod-
els: An Analysis of the Predictors of Gender-Role Attitudes
among Japanese Women. American Journal of Sociology 2000,
105(6):1702-1740.
43. Andresen EM, Vahle VJ, Lollar D: Proxy reliability: health-related
quality of life (HRQoL) measures for people with disability.
Qual Life Res 2001, 10(7):609-619.
44. Zack MM, Moriarty DG, Stroup DF, Ford ES, Mokdad AH: Worsen-
ing trends in adult health-related quality of life and self-rated
health-United States, 1993–2001. Public Health Rep 2004,
119(5):493-505.
45. Unger JB: Sedentary lifestyle as a risk factor for self-reported
poor physical and mental health. Am J Health Promot 1995,
10(1):15-17.
46. Wubben DP, Porterfield D: Health-related quality of life among
North Carolina adults with diabetes mellitus. N C Med J 2005,
66(3):179-185.
47. Lasser K, Boyd JW, Woolhandler S, Himmelstein DU, McCormick D,
Bor DH: Smoking and mental illness: A population-based
prevalence study. Jama 2000, 284(20):2606-2610.
48. Ounpuu S, Krueger P, Vermeulen M, Chambers L: Using the U.S.
Behavior Risk Factor Surveillance System's health related
quality of life survey tool in a Canadian city. Can J Public Health
2000, 91(1):67-72.
49. Strine TW, Okoro CA, Chapman DP, Balluz LS, Ford ES, Ajani UA,
Mokdad AH: Health-related quality of life and health risk
behaviors among smokers. Am J Prev Med 2005, 28(2):182-187.
50. Kahn RS, Wise PH, Kennedy BP, Kawachi I: State income inequal-
ity, household income, and maternal mental and physical
health: cross sectional national survey. Bmj 2000,
321(7272):1311-1315.
51. Public health and aging: health-related quality of life among
low-income persons aged 45–64 years – United States, 1995–
2001. MMWR Morb Mortal Wkly Rep 2003, 52(46):1120-1124.
52. Greenlund KJ, Giles WH, Keenan NL, Croft JB, Mensah GA: Physi-
cian advice, patient actions, and health-related quality of life
in secondary prevention of stroke through diet and exercise.
Stroke 2002, 33(2):565-570.