báo cáo hóa học: " Magnitude and meaningfulness of change in SF-36 scores in four types of orthopedic surgery" ppt
Bạn đang xem bản rút gọn của tài liệu. Xem và tải ngay bản đầy đủ của tài liệu tại đây (588.4 KB, 12 trang )
BioMed Central
Page 1 of 12
(page number not for citation purposes)
Health and Quality of Life Outcomes
Open Access
Research
Magnitude and meaningfulness of change in SF-36 scores in four
types of orthopedic surgery
Lucy Busija*
1
, Richard H Osborne
1
, Anna Nilsdotter
2
, Rachelle Buchbinder
3
and EwaMRoos
4,5
Address:
1
Centre for Rheumatic Diseases, Department of Medicine (Royal Melbourne Hospital), the University of Melbourne, Melbourne,
Australia,
2
R&D Department, Halmstad Central Hospital, Halmstad, Sweden,
3
Monash Department of Clinical Epidemiology at Cabrini Hospital,
Department of Epidemiology and Preventive Medicine, Monash University, Melbourne, Australia,
4
Department of Orthopedics, Clinical Sciences
Lund, Lund University, Sweden and
5
Institute of Sports Science and Clinical Biomechanics, University of Southern Denmark, Odense, Denmark
Email: Lucy Busija* - ; Richard H Osborne - ;
Anna Nilsdotter - ; Rachelle Buchbinder - ;
Ewa M Roos -
* Corresponding author
Abstract
Background: The Medical Outcomes General Health Survey (SF-36) is a widely used health status measure;
however, limited evidence is available for its performance in orthopedic settings. The aim of this study was to
examine the magnitude and meaningfulness of change and sensitivity of SF-36 subscales following orthopedic
surgery.
Methods: Longitudinal data on outcomes of total hip replacement (THR, n = 255), total knee replacement (TKR,
n = 103), arthroscopic partial meniscectomy (APM, n = 74) and anterior cruciate ligament reconstruction (ACL,
n = 62) were used to estimate the effect sizes (ES, magnitude of change) and minimal detectable change
(sensitivity) at the group and individual level. To provide context for interpreting the magnitude of changes in SF-
36 scores, we also compared patients' scores with age and sex-matched population norms. The studies were
conducted in Sweden. Follow-up was five years in THR and TKR studies, two years in ACL, and three months in
APM.
Results: On average, large effect sizes (ES≥0.80) were found after orthopedic surgery in SF-36 subscales
measuring physical aspects (physical functioning, role physical, and bodily pain). Small (0.20–0.49) to moderate
(0.50–0.79) effect sizes were found in subscales measuring mental and social aspects (role emotional, vitality,
social functioning, and mental health). General health scores remained relatively unchanged during the follow-up.
Despite improvements, post-surgery mean scores of patients were still below the age and sex matched population
norms on physical subscales. Patients' scores on mental and social subscales approached population norms
following the surgery. At the individual level, scores of a large proportion of patients were affected by floor or
ceiling effects on several subscales and the sensitivity to individual change was very low.
Conclusion: Large to moderate meaningful changes in group scores were observed in all SF-36 subscales except
General Health across the intervention groups. Therefore, in orthopedic settings, the SF-36 can be used to show
changes for groups in physical, mental, and social dimensions and in comparison with population norms. However,
SF-36 subscales have low sensitivity to individual change and so we caution against using SF-36 to monitor the
health status of individual patients undergoing orthopedic surgery.
Published: 31 July 2008
Health and Quality of Life Outcomes 2008, 6:55 doi:10.1186/1477-7525-6-55
Received: 28 January 2008
Accepted: 31 July 2008
This article is available from: />© 2008 Busija et al; licensee BioMed Central Ltd.
This is an Open Access article distributed under the terms of the Creative Commons Attribution License ( />),
which permits unrestricted use, distribution, and reproduction in any medium, provided the original work is properly cited.
Health and Quality of Life Outcomes 2008, 6:55 />Page 2 of 12
(page number not for citation purposes)
Background
The Medical Outcomes Study Short Form Health Survey
(SF-36) is a health status questionnaire that was devel-
oped almost 20 years ago for the assessment of functional
status and well-being [1]. Its 36 items assess eight health-
related concepts thought to be affected by disease and
treatment interventions: physical functioning, role limita-
tions due to physical health problems (role physical),
bodily pain, general health, energy levels/fatigue (vital-
ity), social functioning, role limitations due to emotional
problems (role emotional), and psychological distress
(mental health). The SF-36 has been applied in a variety
of clinical settings [2-6] including orthopedic surgery
where it has been frequently used to evaluate psychomet-
ric and clinometric properties of other self-report ques-
tionnaires [7-9].
The popularity of the SF-36 is in part related to accumulat-
ing support for its satisfactory validity and reliability
across study settings and populations [10-13]. Population
norms for SF-36, by age and sex, are available for several
countries, allowing comparisons of the health status of
the patient groups with the general population [1,14-16].
To be of practical use in clinical and research settings,
measures that are used to assess outcomes of an interven-
tion must have been shown to be able to detect change in
health status. Given that statistical significance of change
is sample-dependent (in large studies minute and clini-
cally unimportant changes may be statistically significant
and fallaciously regarded as clinically significant), the
magnitude of change (effect size) following an interven-
tion is more informative to clinical practitioners. Informa-
tion on effect size is also useful in research settings, where
it can be used to calculate the sample size required to
detect changes of a certain magnitude.
An additional measurement issue associated with com-
paring pre- and post-intervention scores is that change
scores may be due to random measurement error, real
change in health status, or both. Therefore, an important
characteristic of a sound measure is the ability to detect
meaningful change in participants' health state. The abil-
ity of a questionnaire to detect a meaningful change is
known as sensitivity, with instruments that are more sen-
sitive being able to detect smaller changes. Ideally, the
measurement properties of a questionnaire should be
tested in the settings in which it will be used. However,
relatively few studies have specifically examined the mag-
nitude and meaningfulness of changes in SF-36 scores fol-
lowing orthopedic surgery, and mixed results have been
reported in those that have [9,17,18].
The aim of this study was to assess the utility of SF-36 sub-
scales in orthopedics by examining the magnitude and
meaningfulness of change and sensitivity of SF-36 scores
in orthopedic surgery. To provide context for interpreting
the magnitude of changes in SF-36 scores, we also com-
pared patients' pre- and post-operative scores with the age
and sex adjusted population norms.
Methods
To estimate magnitude of change and sensitivity of SF-36
subscales in orthopedic settings, we utilized secondary
data from prospective follow-up studies of outcomes in
total hip replacement (THR), total knee replacement
(TKR), arthroscopic partial meniscectomy (APM), and
anterior cruciate ligament (ACL) reconstruction surgery.
The methods of these studies have been previously pub-
lished and are summarized here only briefly.
Total hip replacement (THR) groups
This group included 274 consecutive patients having THR
for hip osteoarthritis at the Department of Orthopedics at
Halmstad Central Hospital, Sweden and 110 controls,
matched to the patients by age, sex and municipality [19].
Controls were identified from the Swedish National Pop-
ulation Records. In all, 258 eligible controls were identi-
fied, with 45% (n = 116) agreeing to take part in the study.
After exclusion of those who reported hip complaints
(pain or diminished range of motion) (n = 6), the remain-
ing number (110) was regarded as sufficient for group
comparisons. Patients' mean age was 70.5 years and 53%
were women. Mean age of controls was 70.7 years and
55% were women. Patients were assessed before the sur-
gery (baseline) and reassessed at six months and five years
after the surgery. Controls were assessed at the time of
recruitment, with follow-up assessments also at six
months and five years. Five-year follow-up rates were 65%
for both groups (Table 1).
Total knee replacement (TKR) group
This group included data from 105 consecutive patients
having TKR for knee osteoarthritis at the Department of
Orthopedics at Lund University Hospital, Sweden. Their
mean age was 71.3 years and 63% were women [20].
Patients were assessed before the surgery (baseline), with
follow-ups at six months, one year, and five years. At final
follow-up data were available from 76% of patients.
Arthroscopic partial meniscectomy (APM) group
This group included 74 consecutive patients from Depart-
ment of Orthopedics at Lund University Hospital, Sweden
who received arthroscopic partial meniscectomy as the
only intervention. Their mean age was 44.8 years and 32%
were women [21]. The assessments were conducted before
the surgery (baseline) and three months after the surgery
(85% follow-up rate).
Anterior cruciate ligament (ACL) reconstruction group
This group included data from 62 Swedish patients rand-
omized to an ACL reconstruction within a trial of surgical
versus non-surgical treatment of acute ACL tear (ISRCTN
Health and Quality of Life Outcomes 2008, 6:55 />Page 3 of 12
(page number not for citation purposes)
84752559). Inclusion criteria were age between 18 and 35
years, having a moderate to high physical activity level
and no more than four weeks since ACL rupture at time of
reconstruction. Their mean age was 25.9 years and 19%
were women [22]. Patients were assessed before surgery
(baseline), with follow-ups at six months, one year, and
two years (74% follow-up rate).
Ethical approval and informed consent
Research carried out for the studies reported here com-
plies with the Helsinki Declaration. Each study was
approved by the Ethics Committee of the Medical Faculty
of Lund University, Lund, Sweden. Written informed con-
sent was obtained from the participants for the publica-
tion of results. Copies of the written consent are available
for review by the Editor-in-Chief of this journal.
Measures
All study groups were administered SF-36 at each assess-
ment. The SF-36 is a self-report generic health status ques-
tionnaire comprised of eight subscales: physical
functioning (PF), role physical (RP), bodily pain (BP),
general health (GH), vitality (VT), social functioning (SF),
role emotional (RE), and mental health (MH) [23-25].
The scores range between 0 and 100, with higher scores
representing better health.
Statistical analyses
The original data for each study were extracted for the
analyses.
Effect sizes
Magnitude of change in SF-36 subscale scores was
assessed using Cohen's d [26]. Cohen's d is a standardized
measure of effect size (ES) and provides information on
the amount of change in the measure relative to the vari-
ation within the measure. Cohen's d is computed as the
difference between the baseline and follow-up scores
divided by the standard deviation of baseline scores.
Benchmarks to classify the importance of the change are
available, with ES values of 0.20–0.49 considered small,
values of 0.50–0.79 considered moderate, and values ≥
0.80 considered large [26]. ES were calculated so that pos-
itive values represent improvement and negative values
represent deterioration.
Given that questionnaire change scores cannot be reliably
estimated for the participants with extreme scores, we also
examined the presence of floor and ceiling effects at each
assessment time. The subscales were deemed to have floor
or ceiling effects if 15% of respondents or more reported
the worst (0) or best (100) possible scores, respectively.
Sensitivity
Sensitivity of subscales was evaluated using Minimal
Detectable Change (MDC), calculated at individual and
group levels. While individual and group MDC are related
concepts, they convey different information. Individual
level MDC provide information on whether observed
changes in the individual's health status are greater than
chance variations [27] whereas group level MDC are use-
ful for comparing meaningfulness of change across sam-
ples [28].
Differences in the scores on the same measure obtained
on different occasions may be due to random error, real
change in health status, or a combination of both [27].
Therefore, MDC used for this study was based on standard
error of measurement (SEM). Since the smaller the meas-
urement error, the smaller the changes can be de detected
beyond random error, with lower values of SEM indicat-
ing more sensitive subscales. SEM was derived from
within subjects analysis of variance [29] with time of
assessment (i.e., baseline, follow-up) as the within sub-
jects factor [30]. This study design partitions the within-
person variations in SF-36 scores into between-assessment
variance and the residual variance [30]. The former repre-
sents systematic differences between assessment times,
such as intervention effects, while the latter represents
residual variance due to random error and error from
unknown systematic sources. SEM was calculated as a
square root of this residual within person variance [30].
To determine with 95% confidence whether observed
changes were larger than the random error, individual
Table 1: Follow-up rates for the study groups
Group Number of participants (% of baseline)
Baseline 3 months 6 months 1 year 2 years 5 years
Total hip replacement
(controls)
110 - 74 (67%)- -71 (65%)
Total hip replacement
(patients)
274 - 222 (81%) - - 179 (65%)
Total knee replacement 105 - 94 (90%) 87 (83%) - 80 (76%)
Arthroscopic partial meniscectomy 74 63 (85%) - - - -
Anterior cruciate ligament reconstruction 62 - 62 (100%) 55 (89%) 46 (74%) -
Health and Quality of Life Outcomes 2008, 6:55 />Page 4 of 12
(page number not for citation purposes)
level MDC (MDC
ind
) were calculated as 1.96*√2*SEM
[29,31-33]. Group level MDC (MDC
grp
) were based on
standard errors of the sample means. Standard error of the
mean is influenced by both the within-subjects variability
and the sample size, therefore MDC
grp
were calculated as
(1.96*√ 2*SEM)/√n [32,34,35]. The differences in group
scores between baseline and follow-ups were interpreted
as 'real' change if they exceed values of MDC [28].
MDC reflects changes that are greater than measurement
error (i.e., statistically significant change) and should not
be equated with clinically important change (change that
clinicians and patients regard as important). Since mini-
mal clinically important changes (MCIC) for SF-36 sub-
scales are not well studied in orthopedic settings, we
utilized the published standards for minimal "clinically
and socially relevant" change in group scores as a measure
of MCIC at a group level [36]. The standards for clinically
and socially relevant changes at a group level are based on
Cohen's d, with minimal important change represented
by a moderate effect size (0.50–0.79), which corresponds
to at least 5-point change in scores on the 0–100 scale
(5%) [36]. SF-36 subscales with MDC
grp
less than five
were considered to have acceptable sensitivity to change
in group scores. To determine whether the observed
changes in SF-36 scores were statistically and clinically
meaningful, we also compared the average group changes
with values of MDC group and MCIC, respectively.
Established standards for MCIC at an individual level are
essential for interpretation of intra-individual change as
they help to determine clinical meaningfulness of the
observed change in individual scores. Estimates of indi-
vidual level MCIC are also important for evaluating sensi-
tivity of a measure since a scale can only be regarded as
sufficiently sensitive to detect meaningful changes in indi-
vidual health status if the values of MDC
ind
do not exceed
values of individual level MCIC [33,37]. However, gener-
ally accepted standards for individual level MCIC in
orthopedic surgery currently do not exist. Since scale's
sensitivity to change is affected by measurement error, we
used values of 95% confidence intervals (CI; calculated as
1.96*SEM) around SF-36 scores from a normative popu-
lation-based sample [36] to gauge measurement error in
SF-36 scores in orthopedic settings. As the CI and MDC
represent boundary for true score and boundary for
change, respectively, change could not be regarded as
'real' if the amount of measurement error around the true
score exceeded the amount of measurement error around
the change score. Therefore, SF-36 subscales were
regarded as sufficiently sensitive to detect real changes in
individual scores if MDC
ind
were smaller than the norma-
tive values of 95% CI: 12 points for PF, 23 points for RP,
15 points for BP, 18 points for GH, 16 points for VT, 26
points for SF, 28 points for RE, and 24 points for MH sub-
scales [36]. It is important to note however that CI values
were used as an external standard for the expected amount
of measurement error in SF-36 scores and not as a substi-
tute for individual level MCIC.
Proportion improved or deteriorated
MDC
ind
was used to categorize change in participants'
scores. Those who had scores that decreased by an amount
greater than the MDC
ind
were classified as 'worse'; those
whose scores increased by an amount greater than the val-
ues of MDC
ind
were classified as 'better', and those with
change scores less than or equal to MDC
ind
were classified
as 'no change'.
Population norm comparisons
To provide context for interpreting changes in health sta-
tus following orthopedic surgery, patients' SF-36 scores
were compared with the published norms for SF-36 for
the Swedish population of the same age and sex [1,15]. As
the standard errors for the published norm scores were
very small, the mean values of the normative scores were
used to represent the 'real' values for the population of
each age and sex group. Average group scores within +/- 5
points of the population norm were considered to be
within the norm [1,36].
All statistical analyses were performed using SPSS Version
15. Longitudinal changes were calculated using data from
participants with complete follow-up only.
Results
SF-36 baseline data were available for 515 patients who
underwent orthopedic surgery, including 274 THR, 105
TKR, 74 APM, and 62 ACL reconstruction patients. In the
THR study, there were also 110 age and sex matched con-
trols. Follow-up rates for the patients varied between 81%
(APM) and 100% (ACL) at first post-surgical assessment
(three months in APM study and six months in THR, TKR,
and ACL studies) and between 65% (THR) and 76%
(TKR) at final follow-up (two years for the ACL and five
years for THR and TKR studies), see Table 1. Demographic
characteristics are in Table 2. The proportion of men var-
ied from 37% in TKR study to 81% in ACL study. On aver-
age, patients in the ACL study were youngest (mean [sd]
25.9 [5.1] at baseline), while patients in TKR study were
the oldest (71.3 [8.1] years at baseline).
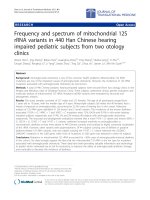
Baseline Scores
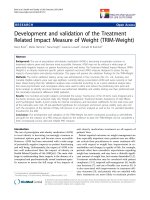
Average baseline scores are presented in Figure 1. The
overall pattern of SF-36 subscale scores was similar across
groups, with lowest scores recorded on RP subscale in all
groups. The scores on GH, SF, and MH subscales tended
to be similar within the groups and were generally better
than the scores on other subscales. The greatest difference
between the best and the worst subscale scores was
Health and Quality of Life Outcomes 2008, 6:55 />Page 5 of 12
(page number not for citation purposes)
observed for the ACL patients (GH versus RP subscales).
THR and TKR patients had the worst baseline scores across
all SF-36 subscales, and were well below the mid point
(50 points) scores on PF, RP, BP, and SF subscales.
Changes in SF-36 Scores
Average SF-36 scores of the study groups at baseline and
at first and final follow-ups are presented in Table 3.
While the THR control group did not change or deterio-
rated slightly, the intervention groups generally improved
in their SF-36 scores during the follow-up. One exception
was the GH subscale, with small deteriorations relative to
baseline scores recorded for THR and TKR groups at five
years and for the APM group at three months follow-up.
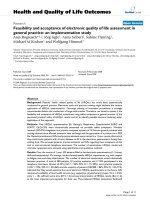
Effect sizes
ES for the first follow-up are presented in Figure 2 and in
Table 3. Generally, the magnitude of changes in SF-36 was
similar for patients in THR, TKR, and ACL groups, with
smaller changes in the APM group. In the THR study, large
improvements (ES≥0.80) at first follow-up occurred in PF,
RP, BP, VT and SF scores, moderate improvements (ES
0.50–0.79) in RE and MH scores and small change in GH
scores (ES = 0.20). For TKR patients, improvements at first
follow-up were large in PF, RP, and BP scores, moderate in
VT, SF, and RE scores and small in GH and MH scores.
Improvements for APM patients could be classified as
large on BP subscale only, with moderate improvements
on PF and RP, small improvements on VT, RE, and MH,
no change on SF, and a small deterioration on GH sub-
scale. In the ACL study, improvements at first follow-up
were large in PF, RP, and BP scores, moderate in VT, SF,
RE, and MH scores, and small in GH scores.
The ES across SF-36 subscales have changed only slightly
over time, with similar values recorded for fist and final
follow-ups (see Table 3). In the studies where data were
available on intermediate follow-up (one year after the
surgery in TKR and the ACL groups) ES were generally
highest at one year (data not shown).
Floor and ceiling effects
Baseline floor effects, indicating worst possible scores,
were present in the RP subscale for all groups and the RE
subscale for THR, TKR, and ACL groups (see Table 4).
More troublesome for documenting potential improve-
ments in scores were ceiling effects at baseline, which were
observed in the SF and RE subscales for all groups and in
the RP and GH subscales for APM group. Ceiling effects
generally increased during the follow-up. PF and VT were
the only subscales that displayed no ceiling effects at base-
line or at follow-ups across all surgical groups.
Sensitivity: Group changes
The values of MDC
grp
varied across the study groups and
across the subscales but were generally lager than or equal
to the values of MCIC (5 points or more), see Table 5. This
suggests that at least some of the meaningful changes in
group scores could not be detected with 95% confidence.
The observed changes in the average SF-36 subscale scores
however were larger than either the values of MDC
grp
or
MCIC across all intervention groups, indicating that statis-
tically and clinically meaningful change in subscale scores
had occurred following orthopedic surgery. Overall, GH
Table 2: Age and sex characteristics of the study groups at baseline
Group % male Age
M (SD) Range
Total hip replacement (controls) 44.6 70.7 (7.6) 52–86
Total hip replacement (patients) 47.2 70.5 (8.9) 41–96
Total knee replacement 37.1 71.3 (8.1) 43–86
Arthroscopic partial meniscectomy 67.6 44.8 (12.2) 14–75
Anterior cruciate ligament reconstruction 80.6 25.9 (5.1) 18–35
Baseline SF-36 scores of the study groupsFigure 1
Baseline SF-36 scores of the study groups. Note: PF =
Physical Functioning, RP = Role Physical, BP = Bodily Pain,
GH = General Health, VT = Vitality, SF = Social Functioning,
RE = Role Emotional, MH = Mental Health.
0
10
20
30
40
50
60
70
80
90
100
PF RP BP GH VT SF RE MH
SF-36 subscales
SF-36 baseline scores
Total hip replacement (controls) Total hip replacement (patients)
Total knee replacement Arthroscopic partial meniscectomy
Anterior cruciate ligament reconstruction Subscales midpoint
Health and Quality of Life Outcomes 2008, 6:55 />Page 6 of 12
(page number not for citation purposes)
subscale had the best ability to detect MCIC in orthopedic
surgery, with MDC
grp
values of five or less in all interven-
tion groups (Table 5). RP and RE subscales had the worst
ability to detect MCIC in group scores, with values of
MDC
grp
ranging from 8 (THR patients) to 12 (TKR and
ACL) and from 9 (THR and APM) to 14 (TKR), respec-
tively.
Sensitivity: Individual changes
Sensitivity of SF-36 subscales to individual change was
very low, as indicated by the high values of SEM and
MDC
ind
(Table 5). The MDC
ind
in all study groups far
exceeded the normative values of 95% CI (Table 5), indi-
cating much greater amount of measurement error in SF-
36 subscale in orthopedic settings than in the normative
sample. Across all surgical groups, the GH subscale had
the best sensitivity, with lowest values of MDC
ind
in all
intervention groups. However a change as large as 27% or
greater needed to occur on this subscale before it could be
considered 'real'. RP and RE subscales were least sensitive
to individual change with values of MDC
ind
ranging from
81 (ACL) to 91 (THR patients) and from 74 (APM) to 97
(THR patients), respectively.
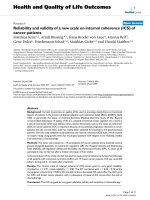
Proportion improved or deteriorated
The proportion of participants who could be classified as
either improved or deteriorated during the follow-up is
presented in Figure 3. Participants in the control group of
the THR study were approximately equally likely to dete-
riorate or improve while in the intervention groups, the
participants were more likely to improve. An exception
was the GH subscale, with the vast majority classified as
unchanged: 96% in THR (patients) and TKR groups, 93%
in ACL group, and 92% in APM group. Overall, surgical
group with the greatest proportion of patients who
improved was ACL, followed by TKR and THR groups,
with APM patients being generally least likely to improve.
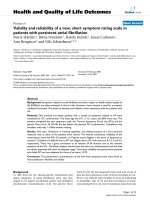
Population norm comparisons
Figure 4 indicates that at baseline, all the surgical groups
deviated most from the population norms on the RP sub-
scale and were most similar to the norms on the GH sub-
scale. As expected, the controls in the THR study changed
Table 3: Average SF-36 subscale scores and effect sizes for the study groups at first and final follow-up*
SF-36 scores Total hip replacement
(controls)
Total hip replacement
(patients)
Total knee
replacement
Arthroscopic partial
meniscectomy
Anterior cruciate
ligament
reconstruction
N M (SD) ES N M (SD) ES N M (SD) ES N M (SD) ES N M (SD) ES
PF Baseline 44 79.6 (17.7) 147 30.7 (20.1) 68 30.0 (14.9) 62 59.0 (21.8) 46 44.2 (21.8)
First follow-up 44 78.2 (21.8) -0.1 147 60.5 (22.0) 1.5 68 60.6 (21.1) 2.1 62 73.7 (21.9) 0.7 46 79.6 (17.7) 1.6
Final follow-up 44 74.5 (24.1) -0.3 147 57.6 (27.3) 1.3 68 52.3 (24.1) 1.5 46 83.4 (20.2) 1.8
RP Baseline 42 68.5 (41.0) 139 8.5 (20.2) 64 12.6 (23.7) 62 36.7 (38.3) 46 14.1 (26.7)
First follow-up 42 69.6 (42.6) 0.0 139 49 (42.6) 2.0 64 42.7 (42.4) 1.3 62 62.5 (42.2) 0.7 46 64.7 (40.0) 1.9
Final follow-up 42 60.1 (42.4) -0.2 139 49.6 (43.2) 2.0 64 48.0 (43.9) 1.5 46 80.4 (34.9) 2.5
BP Baseline 50 75.7 (24.2) 154 30.9 (17.2) 66 30.6 (18.8) 62 44.4 (19.2) 46 41.8 (20.4)
First follow-up 50 73.0 (27.6) -0.1 154 70.3 (23.6) 2.3 66 70.9 (23.7) 2.1 62 63.3 (24.9) 1.0 46 74.4 (20.7) 1.6
Final follow-up 50 70.2 (28.0) -0.2 154 67.1 (26.0) 2.1 66 63.9 (25.1) 1.8 46 75.8 (25.3) 1.7
GH Baseline 46 70.2 (20.3) 139 68.8 (19.1) 59 66.0 (18.3) 61 82.4 (15.1) 46 81.5 (15.8)
First follow-up 46 68.6 (22.0) -0.1 139 72.5 (20.7) 0.2 59 70.0 (20.9) 0.2 61 80.1 (19.4) -0.2 46 85.0 (15.8) 0.2
Final follow-up 46 61.8 (22.7) -0.4 139 63.6 (22.9) -0.3 59 62.7 (24.0) -0.2 46 83.4 (17.1) 0.1
VT Baseline 45 69.8 (21.7) 135 50.9 (20.1) 59 50.3 (26.7) 62 60.8 (22.1) 46 59.5 (19.3)
First follow-up 45 69.1 (21.6) 0.0 135 70.9 (19.2) 1.0 59 67.3 (24.4) 0.6 62 69.4 (22.3) 0.4 46 71.6 (22.5) 0.6
Final follow-up 45 63.8 (22.6) -0.3 135 64.3 (22.4) 0.7 59 61.0 (27.7) 0.4 46 72.1 (20.0) 0.7
SF Baseline 49 87.8 (19.7) 157 65.4 (26.2) 66 72.7 (23.0) 62 86.3 (18.6) 46 72.6 (26.0)
First follow-up 49 84.9 (18.9) -0.1 157 87.9 (19.5) 0.9 66 86.7 (19.1) 0.6 62 87.5 (22.6) 0.1 46 90.8 (16.1) 0.7
Final follow-up 49 82.7 (24.0) -0.3 157 84.3 (22.3) 0.7 66 83.5 (25.2) 0.5 46 94.3 (14.6) 0.8
RE Baseline 37 76.1 (34.4) 139 39.3 (43.6) 56 40.5 (43.0) 62 68.8 (38.1) 46 52.9 (43.6)
First follow-up 37 76.6 (37.6) 0.0 139 68.1 (39.7) 0.7 56 64.0 (43.1) 0.5 62 77.4 (36.6) 0.2 46 81.9 (36.3) 0.7
Final follow-up 37 77.5 (40.9) 0.0 139 65.5 (42.0) 0.6 56 57.7 (42.4) 0.4 46 92.0 (20.1) 0.9
MH Baseline 45 86.6 (13.7) 136 69.8 (21.6) 59 71.0 (21.0) 62 78.1 (18.4) 46 71.8 (18.9)
First follow-up 45 85.2 (13.9) -0.1 136 83.8 (17.7) 0.6 59 80.0 (19.7) 0.4 62 83.6 (17.6) 0.3 46 84.3 (17.0) 0.7
Final follow-up 45 82.0 (15.6) -0.3 136 80.6 (17.9) 0.5 59 77.2 (20.1) 0.3 46 86.2 (12.8) 0.8
*Note: First follow-up was three months for APM and six months for THR, TKR, and ACL groups; Final follow-up was five years for THR and TKR
groups and two years for ACL.
PF = Physical Functioning, RP = Role Physical, BP = Bodily Pain, GH = General Health, VT = Vitality, SF = Social Functioning, RE = Role Emotional,
MH = Mental Health.
Health and Quality of Life Outcomes 2008, 6:55 />Page 7 of 12
(page number not for citation purposes)
little throughout the follow-up and were comparable to
population norms at each assessment. At baseline, only
GH scores were within the population norms for THR and
TKR patients. The THR patients generally improved but
were still below the population norms on PF, RP, and RE
subscales at six months and five years follow-up (Figure
4a). TKR patients also generally improved, scoring slightly
above the norm on the GH, BP, and VT subscales (Figure
4b), but below the norms on PF, RP, and RE at six months.
At five years follow-up, TKR patients had a slight drop in
their PF, BP, VT, and RE scores and were still below the
norm on PF, RP, and RE subscales.
In the APM study, patients' baseline scores were slightly
above the norm on the GH subscale and within the norm
on SF and MH subscales. At three months follow-up,
patients improved on PF, RP, BP, VT, and RE subscales but
reached population norms on VT subscale only (Figure
4c). The ACL group had lower baseline scores than the
norm on all subscales except GH. At six months, patients
generally improved, but stayed below the norm on PF, RP,
BP, and RE subscales. At two years follow-up, further
improvements were recorded on RP and RE subscales,
with patients scoring slightly above the norm on RE, but
remaining below the norm on RP subscale (Figure 4d).
Discussion
Orthopedic surgery is performed in response to a broad
spectrum of conditions, including degenerative disorders
and sports injury. We examined the magnitude and mean-
ingfulness of changes in SF-36 subscales in four ortho-
pedic populations and compared changes in patients'
health status with the age and sex matched population
norms. Large improvements (ES≥0.80) were observed on
physical dimensions of the SF-36 (PF, RP, and BP sub-
scales). Improvements on the mental and social dimen-
sions (SF, RE, VT, and MH subscales) were small to
moderate, while GH scores remained relatively
unchanged during the study period. Group changes on all
subscales but GH were clinically and statistically mean-
ingful. Despite improvements, patients were still below
the age and sex matched population norms on physical
dimensions but scores on mental and social dimensions
generally approached population norms following the
surgery. On an individual level, floor and ceiling effects
were observed on several subscales and the sensitivity to
individual change was very low. Of the eight SF-36 sub-
scales, the GH subscale had the best sensitivity to detect
changes in health status of individual patients, although
values of MDC
ind
were very high even on this subscale. PF
subscale generally performed best, with no floor or ceiling
effects and large changes in patients' scores following sur-
gery however it had low sensitivity to change in individual
or group scores.
Our results also indicate that overall, patients who under-
went THR, TKR, APM, and ACL reconstruction surgery
showed improvements in the health domains assessed by
the SF-36 subscales. While the magnitude of the changes
in SF-36 domains varied between the surgical groups, gen-
erally, greatest improvements were recorded for the phys-
ical dimensions, including physical function, role
physical, and bodily pain, with more moderate changes in
vitality, social functioning, role emotional, and mental
health. Although no comparable data are currently availa-
ble for APM, previous studies with THR, TKR, and ACL
patients also documented greatest changes in the physical
domains [18,38-42]. This study supports findings of past
studies and extends them to a wider range of orthopedic
surgery types.
Several researchers have previously recommended that
interventions conducted with orthopedic populations
should include at least one generic health status question-
naire in addition to condition-specific measures [8,41,43-
45]. Disease-specific instruments, such as the Knee Injury
and Osteoarthritis Outcome Score (KOOS), Western
Ontario and McMaster Universities Osteoarthritis Index
(WOMAC), and Arthritis Impact Measurement Scales
(AIMS) for example, have been found reliable, valid, and
sensitive measures of patient-reported outcomes in arthri-
tis [20,46,47]. Disease-specific measures were also
reported to be more sensitive in detecting change follow-
ing surgical interventions than the generic instruments
[8]. However, generic health status measures, such as SF-
Effect sizes for SF-36 subscales across the study groups at first follow-up*Figure 2
Effect sizes for SF-36 subscales across the study
groups at first follow-up*. * Note: First follow-up was
three months for APM and six months for TKR, THR, and
ACL groups. PF = Physical Functioning, RP = Role Physical,
BP = Bodily Pain, GH = General Health, VT = Vitality, SF =
Social Functioning, RE = Role Emotional, MH = Mental
Health.
-0.4 -0.2 0.0 0.2 0.4 0.6 0.8 1.0 1.2 1.4 1.6 1.8 2.0 2.2 2.4 2.6
PF
RP
BP
GH
VT
SF
RE
MH
SF-36 subscales
Effect size
Total hip replacement (controls)
Total hip replacement (patients)
Total knee replacement
Arthroscopic partial meniscectomy
Anterior cruciate ligament
reconstruction
Health and Quality of Life Outcomes 2008, 6:55 />Page 8 of 12
(page number not for citation purposes)
Table 4: Floor and ceiling effects for SF-36 subscale scores for the study groups at first and final follow-up*
SF-36 scores Total hip
replacement
(controls)
Total hip
replacement
(patients)
Total knee
replacement
Arthroscopic
partial
meniscectomy
Anterior cruciate
ligament
reconstruction
%
scoring
0
%
scoring
100
%
scoring
0
%
scoring
100
%
scoring
0
%
scoring
100
%
scoring
0
%
scoring
100
%
scoring
0
%
scoring
100
PF Baseline - 12.0 8.3 - 1.4 - 1.6 0.0 2.2 -
First follow-up - 13.6 1.3 0.7 - 1.4 - 6.3 - 4.3
Final follow-up 2.2 8.7 3.9 - 2.7 - - 28.3
RP Baseline 19.6 54.3 80.8 2.0 70.4 2.8 39.7 19.0 76.1 -
First follow-up 21.4 61.9 35.3 31.7 40.8 26.8 20.6 50.8 19.6 45.7
Final follow-up 26.2 42.9 35.3 35.3 38.0 19.4 10.9 71.7
BP Baseline - 40.0 9.0 1.3 8.3 1.4 - 1.6 - 2.2
First follow-up - 36.0 0.6 27.1 - 26.4 -12.7-21.7
Final follow-up 2.0 38.0 0.6 25.8 - 19.4 2.2 41.3
GH Baseline - 8.7 - 4.3 - 1.5 - 16.1 -8.7
First follow-up - 13.0 0.7 5.7 - 8.8 - 27.4 -13.0
Final follow-up - 6.5 1.4 4.3 - 8.8 - 21.7
VT Baseline - 4.4 2.2 0.7 3.0 4.5 - 3.2 - -
First follow-up - 11.1 0.7 5.1 - 7.6 - 7.9 - 13.0
Final follow-up 2.2 4.4 0.7 4.4 3.0 4.5 - 6.5
SF Baseline - 64.0 3.2 17.7 - 22.5 - 52.4 2.2 32.6
First follow-up - 53.1 0.6 60.8 - 57.7 - 68.3 - 67.4
Final follow-up 2.0 52.0 1.9 55.7 2.8 53.5 - 84.8
RE Baseline 10.8 59.5 47.5 30.2 46.9 28.1 14.3 54.0 30.4 41.3
First follow-up 13.5 67.6 17.3 55.4 28.1 53.1 12.7 68.3 15.2 76.1
Final follow-up 18.9 75.7 23.0 54.0 26.6 43.8 - 84.8
MH Baseline - 20.0 - 6.6 - 12.1 - 9.5 - -
First follow-up - 15.6 0.7 24.1 - 21.2 - 22.2 - 21.7
Final follow-up - 13.3 - 19.0 -
16.7 - 15.2
*Note: First follow-up was three months for APM and six months for THR, TKR, and ACL groups; Final follow-up was five years for THR and TKR
groups and two years for ACL.
PF = Physical Functioning, RP = Role Physical, BP = Bodily Pain, GH = General Health, VT = Vitality, SF = Social Functioning, RE = Role Emotional,
MH = Mental Health.
Values indicating floor (15% or more with a score of 0) and ceiling (15% or more with a score of 100) effects are bolded.
Table 5: Change in SF-36 subscales across study groups
Norm
95%CI
Total hip replacement
(controls)
Total hip replacement
(patients)
Total knee
replacement
Arthroscopic partial
meniscectomy
Anterior cruciate
ligament reconstruction
SEM* MDC
#
ΔM
(SD)
SEM MDC ΔM
(SD)
SEM MDC ΔM
(SD)
SEM MDC ΔM
(SD)
SEM MDC ΔM
(SD)
Ind Grp Ind Grp Ind Grp Ind Grp Ind Grp
PF 12 12 34 5 -2 (12) 18 49 4 27 (23) 15 41 6 29 (17) 16 45 6 15 (23) 14 40 6 34 (21)
RP 23 21 57 10 -2 (26) 33 91 8 33 (33) 30 84 12 35 (34) 32 88 11 27 (45) 29 81 12 50 (30)
BP 15 15 41 6 -3 (16) 20 54 5 37 (23) 19 51 7 36 (27) 17 46 6 20 (24) 17 48 7 31 (22)
GH 18 13 36 6 -4 (13) 14 39 4 0 (17) 13 35 5 3 (14) 10 27 3 -3 (14) 11 31 5 2 (12)
VT 16 12 34 6 -2 (14) 16 44 4 17 (20) 18 50 7 16 (22) 14 39 5 9 (20) 12 34 5 11 (14)
SF 26 17 48 7 -3 (21) 19 53 5 19 (24) 19 52 7 14 (25) 14 38 5 1 (19) 17 46 7 19 (26)
RE 28 28 79 14 3 (31) 35 97 9 25 (43) 34 94 14 24 (47) 27 74 9 9 (38) 28 78 11 30 (43)
MH 24 12 33 5 -3 (14) 15 40 4 12 (17) 14 39 6 8 (18) 12 33 4 5 (17) 12 34 5 12 (17)
Note:
95%CI for population-based normative scores on SF-36 subscales [36].
* SEM (Standard error of measurement) = √within subjects variance; Derived from ANOVA model with 'time of follow-up' as the within subjects factor.
# MDC
ind
(Minimal detectable change at individual level) = 1.96*√2*SEM; MDC
grp
(Minimal detectable change at group level) = (1.96*√2*SEM)/√n.
PF = Physical Functioning, RP = Role Physical, BP = Bodily Pain, GH = General Health, VT = Vitality, SF = Social Functioning, RE = Role Emotional, MH = Mental Health.
Health and Quality of Life Outcomes 2008, 6:55 />Page 9 of 12
(page number not for citation purposes)
36, provide a broader insight into patients' quality of life
and allow comparisons across conditions. Our results
provide some support for the use of SF-36 to evaluate out-
comes of THR, TKR, and ACL surgery, as improvements in
vitality, social functioning, role emotional, and mental
health of these surgical groups would have been missed if
only disease-specific instruments were used.
In APM surgery, the changes in SF-36 scores were smaller
than in other surgical groups. The mean age in the menis-
cectomy group was 45 years, implying a large proportion
of degenerative meniscus tears in this group. Degenerative
tear is a strong risk factor for future radiographic osteoar-
thritis and have been suggested to signal incipient knee
OA [48]. Thus, the modest improvements seen in this
group might be due to the surgery being performed for the
wrong reason. A recent RCT in subjects with an MRI-veri-
fied meniscal tear compared meniscectomy and exercise
with exercise alone and found no superior effect of menis-
cectomy, further questioning the effectiveness of menis-
cectomy in middle-aged people [49].
Another important finding in this study was that observed
changes on all SF-36 subscales except GH were clinically
and statistically meaningful at a group level. However,
values of MDC
grp
in our study where higher than the
established values of MCIC [36] for almost all subscales,
indicating that at least some of the meaningful changes in
group scores of orthopedic patients could not be detected
with 95% confidence due to measurement error. Sensitiv-
ity of SF-36 subscales was even lower at an individual
level, with very large changes in scores needed to occur
before such changes could be classified as real with 95%
confidence. The disparities in the amount of measure-
ment error between ours and the normative samples [36]
highlight the importance of evaluating outcome measures
in the populations and settings for which these measures
will be used. Poor sensitivity of SF-36 to individual
change was previously observed in an analytical review of
health status measures, with confidence intervals unac-
ceptably wide to be of practical use for individual assess-
ment [50] and in prospective follow-up of THR patients
[17], raising concerns about the ability of SF-36 to reliably
detect meaningful changes in health status of individuals.
Information on sensitivity of a measure can potentially be
used by clinicians and researchers to determine whether
observed changes in the health status of individual
patients or groups of patients reflect real changes as
opposed to random variations. However, since our results
suggest poor sensitivity of SF-36 subscales to individual
change, we advise against using this questionnaire to
monitor individual patients.
Previous studies with TKR, THR, and ACL patients
reported that the GH subscale of SF-36 showed very little
change in group scores after the surgery [17,39,40,42].
Similar findings were obtained in our study, with GH sub-
scale showing little or no change across the study groups.
However, group results are not necessarily a valid indica-
tor of changes in health state of individuals, especially in
situations where there are as many patients deteriorating
as improving: when averaged for the whole group, the
results may appear to suggest no change. Examination of
individual scores in our study indicated that very few indi-
viduals could be classified as changed across the interven-
tion groups on GH subscale. This finding extends the
results of previous studies and underscores the impor-
tance of taking into account individual as well as group
changes when evaluating outcomes in longitudinal stud-
ies [51].
Our results also indicate that patients in all intervention
groups had general health scores comparable with the age
and sex adjusted population norms. Lack of improvement
in GH scores across the study groups is therefore not sur-
prising as the participants were already in very good gen-
eral health before the surgery. We also found that despite
substantial improvements in health status over the study
period, patients in the THR, TKR, APM, and ACL studies
remained below the age and sex norms for the general
population on several SF-36 subscales. While no data is
currently available that compares outcomes of APM with
the population norms, at least two previous investigations
with THR and TKR patients [39,52] reported that patients
who undergo these surgical interventions still fall short of
Proportion improved or deteriorated on SF-36 subscales across the study groups at first follow-up*Figure 3
Proportion improved or deteriorated on SF-36 sub-
scales across the study groups at first follow-up*. *
Note: First follow-up was three months for APM and six
months for TKR, THR, and ACL groups. PF = Physical Func-
tioning, RP = Role Physical, BP = Bodily Pain, GH = General
Health, VT = Vitality, SF = Social Functioning, RE = Role
Emotional, MH = Mental Health.
15 10 5 0 5 10 15 20 25 30 35 40 45 50 55 60
PF
RP
BP
GH
VT
SF
RE
MH
SF-36 subscales
% Worse % Better
-
20.0 -10.0 0.0 10.0 20.
0
Better
Worse
Total hip replacement (controls)
Total hip replacement (patients)
Total knee replacement
Arthroscopic partial meniscectomy
Anterior cruciate ligament
reconstruction
Health and Quality of Life Outcomes 2008, 6:55 />Page 10 of 12
(page number not for citation purposes)
age and sex adjusted population norms on health
domains measured by SF-36.
We also found that floor and/or ceiling effects were
present in most SF-36 subscales for nearly all intervention
groups; hence the results of magnitude of changes (effect
sizes) following orthopedic surgery need to be interpreted
with caution, as changes can not be reliably estimated for
individuals with extreme scores. The presence of floor and
ceiling effects also indicates that SF-36 is not covering the
full continuum of impairment and recovery in orthopedic
populations. Substantial floor and ceiling effects for SF-36
scores were previously reported in other investigations
[2,40], further indicating poor utility of SF-36 in ortho-
pedics.
This study is subjected to some limitations. Firstly, it was
not specifically designed to assess performance of SF-36 in
different types of orthopedic surgery. Different methodol-
ogies were used and the study groups differed on some
demographic variables. Therefore, some differences across
groups may be related to study effects. Secondly, MCIC in
the SF-36 domains are not well studied in orthopedic sur-
gery, therefore we have used established population
norms to gauge the amount of measurement error around
individual change scores in orthopedic surgery settings.
While the results indicate low sensitivity of SF-36 to indi-
vidual change, future studies need to compare the MDC
values with empirically derived estimates of MCIC follow-
ing different types of orthopedic surgery. Finally, the pres-
ence of floor and ceiling effects on several SF-36 subscales
suggests that the amount of change that could potentially
occur for individual participants during the follow-up
may have been influenced by their baseline scores, with
greater possible range of change scores for individuals
with midrange scores at baseline than for those who had
Comparisons of SF-36 subscale scores of the study groups with population normsFigure 4
Comparisons of SF-36 subscale scores of the study groups with population norms. PF = Physical Functioning, RP =
Role Physical, BP = Bodily Pain, GH = General Health, VT = Vitality, SF = Social Functioning, RE = Role Emotional, MH = Men-
tal Health.
A: Total hip replacement
0
20
40
60
80
100
PF RP BP GH VT SF RE MH
SF-36 subscales
SF-36 scores (M)
Baseline (controls)
Baseline (patients)
6 months (controls)
6 months (patients)
5 years (controls)
5 years (patients)
B: Total knee replacement
0
20
40
60
80
100
PF RP BP GH VT SF RE MH
SF-36 subscales
SF-36 scores (M)
Baseline
6 months
5 years
C: Arthroscopic partial meniscectomy
0
20
40
60
80
100
PF RP BP GH VT SF RE MH
SF-36 subscales
SF-36 scores (M)
Baseline
3 months
D: Anterior cruciate ligament reconstruction
0
20
40
60
80
100
PF RP BP GH VT SF RE MH
SF-36 subscales
SF-36 scores (M)
Baseline
6 months
2 years
Scores below population norms
Health and Quality of Life Outcomes 2008, 6:55 />Page 11 of 12
(page number not for citation purposes)
more extreme baseline scores. As a result, within-subjects
variability may have been underestimated, potentially dis-
torting estimates of MDC [29,53].
One of the major strengths of this study is the use of data
from four different types of orthopedic surgery. While sev-
eral past studies investigated measurement properties of
SF-36 in joint replacement surgery [7,9,17,38,45,54], to
the best of our knowledge, ours is the first study to con-
sider performance of SF-36 in THR, TKR, APM, and ACL
reconstruction surgery simultaneously. Additional
strengths of this study are the prospective design of the
studies included and the high follow-up rates (65–100%).
These aspects of study methodology serve to reduce bias
and improve generilizability of results. Finally, we pre-
sented estimates of change in SF-36 subscale scores
expressed in standardized units (ES) and in the original
scale of measurement (MDC and SEM). While estimates
of change in original scale of measurement have the
advantage of being conceptually easy to interpret, ES can
be used by clinicians and researchers to compare changes
in patients' health status on different measures obtained
in the same study, to evaluate efficacy of different inter-
ventions, or to compare results of different studies.
Conclusion
Large to moderate meaningful changes in group scores
were observed in all SF-36 subscales except GH across the
intervention groups. Therefore, in orthopedic settings, the
SF-36 can be used at a group level to show change in phys-
ical, mental, and social dimensions following different
types of surgery and to make comparisons of the surgical
groups with population norms. At an individual level
however, SF-36 subscale had low sensitivity to individual
change. Although further research is needed to establish
the minimal clinically important change in SF-36 scores
in orthopedic settings, we caution against using SF-36 to
monitor health status of individual patients undergoing
orthopedic surgery.
Competing interests
The authors declare that they have no competing interests.
Authors' contributions
LB participated in study design, performed the statistical
analysis, and drafted the manuscript. RHO participated in
study design and helped to draft the manuscript. AN car-
ried out data collection (THR study). RB participated in
study design and helped to draft the manuscript. EMR
conceived of the study, participated in the design of the
study, carried out data collection,TKR, APM, and ACL
studies, and helped to draft the manuscript. All authors
read and approved the final manuscript.
Acknowledgements
Lucy Busija's work was supported by a University of Melbourne Postgrad-
uate Research Scholarship and a Universitas 21 Solander Travel Scholar-
ship.
Richard H Osborne was supported in part by an Australian National Health
and Medical Research Council (NHMRC) Population Health Career Devel-
opment Award, a Universitas 21 Solander Travel Fellowship, and a Bone
and Joint Decade Fellowship.
Anna Nilsdotter's work was supported by Halmstad Central Hospital.
Rachelle Buchbinder was supported in part by an Australian NHMRC Prac-
titioner Fellowship.
Ewa M Roos' work was supported by The Swedish Research Council, the
Swedish Rheumatism Association, the Faculty of Medicine Lund University,
and Region Skåne.
We would like to thank the steering group of the KANON-study for gen-
erously allowing the use of data from the KANON-study.
The KANON study was funded by Pfizer Global Research, Thelma Zoegas
fund, Stig & Ragna Gorthon research foundation, The Swedish National
Centre for Research in Sports, The Swedish Research Council, the Medical
Faculty Lund University (ALF) and Region Skåne.
We wish to thank Professor Peter Fayers, Department of Public Health, the
University of Aberdeen, for his practical and insightful statistical advice.
References
1. Ware JE, Kosinski M, Gandek B: SF-36 Health Survey: Manual and inter-
pretation guide. 2000 edn Lincoln: Quality Metric Inc; 1993.
2. Baron R, Elashaal A, Germon T, Hobart J: Measuring outcomes in
cervical spine surgery: Think twice before using the SF-36.
Spine 2006, 31:2575-2584.
3. Coster WJ, Haley SM, Jette AM: Measuring patient-reported
outcomes after discharge from inpatient rehabilitation set-
tings. J Rehabil Med 2006, 38:237-242.
4. Angst F, Aeschlimann A, Steiner W, Stucki G: Responsiveness of
the WOMAC osteoarthritis index as compared with the SF-
36 in patients with osteoarthritis of the legs undergoing a
comprehensive rehabilitation intervention. Ann Rheum Dis
2001, 60:834-840.
5. Strine TW, Hootman JM, Chapman DP, Okoro CA, Balluz L: Health-
related quality of life, health risk behaviors, and disability
among adults with pain-related activity difficulty. Am J Public
Health 2005, 95:2042-2048.
6. Osborne RH, Hawthorne G, Lew EA, Gray LC: Quality of life
assessment in the community-dwelling elderly: Validation of
the Assessment of Quality of Life (AQoL) Instrument and
comparison with the SF-36. J Clin Epidemiol 2003, 56:138-147.
7. Blanchard C, Feeny D, Mahon JL, Bourne R, Rorabeck C, Stitt L, Web-
ster-Bogaert S: Is the Health Utilities Index valid in total hip
arthroplasty patients? Qual Life Res 2004, 13:339-348.
8. Brazier JE, Harper R, Munro J, Walters SJ, Snaith ML: Generic and
condition-specific outcome measures for people with oste-
oarthritis of the knee. Rheumatology (Oxford) 1999, 38:870-877.
9. Nilsdotter AK, Roos EM, Westerlund JP, Roos HP, Lohmander LS:
Comparative responsiveness of measures of pain and func-
tion after total hip replacement. Arthritis Rheum 2001,
45:258-262.
10. Kosinski M, Keller SD, Ware JE Jr, Hatoum HT, Kong SX: The SF-
36 Health Survey as a generic outcome measure in clinical
trials of patients with osteoarthritis and rheumatoid arthri-
tis: Relative validity of scales in relation to clinical measures
of arthritis severity. Med Care
1999, 37:MS23-39.
11. Yost KJ, Haan MN, Levine RA, Gold EB: Comparing SF-36 scores
across three groups of women with different health profiles.
Qual Life Res 2005, 14:1251-1261.
Health and Quality of Life Outcomes 2008, 6:55 />Page 12 of 12
(page number not for citation purposes)
12. Sanson-Fisher RW, Perkins JJ: Adaptation and validation of the
SF-36 Health Survey for use in Australia. J Clin Epidemiol 1998,
51:961-967.
13. Ruta DA, Hurst NP, Kind P, Hunter M, Stubbings A: Measuring
health status in British patients with rheumatoid arthritis:
reliability, validity and responsiveness of the short form 36-
item health survey (SF-36). Br J Rheumatol 1998, 37:425-436.
14. Australian Bureau of Statistics: National Health Survey: SF36
Population Norms, Australia, 1995. Cat. no. 4399.0. Can-
berra: ABS; 1997.
15. Sullivan M, Karlsson J, Ware JE: SF-36 Swedish Manual and Interpreta-
tion Guide Gothenburg: Gothenburg University; 1994.
16. Ware JE, Kosinski M, Dewey JE: How to score version 2 of the SF-36
Health Survey Lincoln: Quality Metric Inc; 2000.
17. Quintana JM, Escobar A, Bilbao A, Arostegui I, Lafuente I, Vidaurreta
I: Responsiveness and clinically important differences for the
WOMAC and SF-36 after hip joint replacement. Osteoarthritis
Cartilage 2005, 13:1076-1083.
18. Escobar A, Quintana JM, Bilbao A, Arostegui I, Lafuente I, Vidaurreta
I: Responsiveness and clinically important differences for the
WOMAC and SF-36 after total knee replacement. Osteoarthri-
tis Cartilage 2006, 15:273-280.
19. Nilsdotter AK, Petersson IF, Roos EM, Lohmander LS: Predictors of
patient relevant outcome after total hip replacement for
osteoarthritis: A prospective study. Ann Rheum Dis 2003,
62:923-930.
20. Roos EM, Toksvig-Larsen S: Knee injury and Osteoarthritis Out-
come Score (KOOS) – Validation and comparison to the
WOMAC in total knee replacement. Health Qual Life Outcomes
2003, 1:17.
21. Roos EM, Roos HP, Ryd L, Lohmander LS: Substantial disability 3
months after arthroscopic partial meniscectomy: A prospec-
tive study of patient-relevant outcomes. Arthroscopy 2000,
16:619-626.
22. Frobell RB, Lohmander LS, Roos EM: The challenge of recruiting
patients with anterior cruciate ligament injury of the knee
into a randomized clinical trial comparing surgical and non-
surgical treatment. Contemp Clin Trials 2007, 28:
295-302.
23. Keller SD, Majkut TC, Kosinski M, Ware JE Jr: Monitoring health
outcomes among patients with arthritis using the SF-36
Health Survey: overview. Med Care 1999, 37:MS1-9.
24. Kosinski M, Keller SD, Hatoum HT, Kong SX, Ware JE Jr: The SF-
36 Health Survey as a generic outcome measure in clinical
trials of patients with osteoarthritis and rheumatoid arthri-
tis: Tests of data quality, scaling assumptions and score reli-
ability. Med Care 1999, 37:MS10-22.
25. McCallum J: The SF-36 in an Australian sample: Validating a
new, generic health status measure. Aust J Public Health 1995,
19:160-166.
26. Cohen J: Statistical Power Analysis for Social and Behavioural Sciences
New York: Academic Press; 1977.
27. de Vet HC, Bouter LM, Bezemer PD, Beurskens AJ: Reproducibility
and responsiveness of evaluative outcome measures: Theo-
retical considerations illustrated by an empirical example.
Int J Technol Assess Health Care 2001, 17:479-487.
28. Angst F, Aeschlimann A, Stucki G: Smallest detectable and mini-
mal clinically important differences of rehabilitation inter-
vention with their implications for required sample sizes
using WOMAC and SF-36 quality of life measurement
instruments in patients with osteoarthritis of the lower
extremities. Arthritis Rheum 2001, 45:384-391.
29. Bland JM, Altman DG: Measurement error. BMJ 1996, 313:744.
30. Masse J, Bland JM, Doyle JR, Doyle JM: Measurement error. BMJ
1997, 314:147.
31. Beckerman H, Roebroeck ME, Lankhorst GJ, Becher JG, Bezemer PD,
Verbeek AL: Smallest real difference, a link between repro-
ducibility and responsiveness. Qual Life Res 2001, 10:571-578.
32. de Boer MR, de Vet HC, Terwee CB, Moll AC, Volker-Dieben HJ, van
Rens GH: Changes to the subscales of two vision-related qual-
ity of life questionnaires are proposed. J Clin Epidemiol 2005,
58:1260-1268.
33. de Vet HC, Terwee CB, Ostelo RW, Beckerman H, Knol DL, Bouter
LM: Minimal changes in health status questionnaires: Distinc-
tion between minimally detectable change and minimally
important change. Health Qual Life Outcomes 2006,
4:54.
34. Bland JM, Altman DG: Standard deviations and standard errors.
BMJ 2005, 331:903.
35. Spies-Dorgelo MN, Terwee CB, Stalman WAB, Windt DAWM van
der: Reproducibility and responsiveness of the Functional
Handicap Score (FHS) and Dutch Arthritis Impact Score
(Dutch-AIMS2) for patients with wrist or hand problems in
primary care. Health Qual Life Outcomes 2006, 10:87.
36. Ware JE, Kosinski MA, Gandek B: SF-36 Health Survey: Manual and
interpretation guide Lincoln: Quality Metric Inc; 2005.
37. Wyrwich K, Tierney W, Wolinsky F: Using the standard error of
measurement to identify important changes on the Asthma
Quality of Life Questionnaire. Qual Life Res 2002, 11:1-7.
38. Bachmeier CJ, March LM, Cross MJ, Lapsley HM, Tribe KL, Courtenay
BG, Brooks PM: A comparison of outcomes in osteoarthritis
patients undergoing total hip and knee replacement surgery.
Osteoarthritis Cartilage 2001, 9:137-146.
39. Jones CA, Voaklander DC, Johnston DW: The effect of age on
pain, fuction, and quality of life after total hip and knee
arthroplasty. Arch Intern Med 2001, 161:454-460.
40. Marx RG, Jones EC, Atwan NC, Closkey RF, Salvati EA, Sculco TP:
Measuring improvement following total hip and knee arthro-
plasty using patient-based measures of outcome. J Bone Joint
Surg Am 2005, 87-A:1999-2005.
41. Salaffi F, Carotti M, Grassi W: Health-related quality of life in
patients with hip or knee osteoarthritis: Comparison of
generic and disease-specific instruments. Clin Rheumatol 2005,
24:29-37.
42. Shapiro ET, Richmond JC, Rockett SE, McGrath MM, Donaldson WR:
The use of generic, patient-based health assessment (SF-36)
for evaluation of patients with anterior cruciate ligament
injuries. Am J Sports Med 1996, 24:196-200.
43. Brazier J, Roberts J, Tsuchiya A, Busschbach J: A comparison of the
EQ-5D and SF-6D across seven patient groups. Health Econ
2004, 13:873-884.
44. Dieppe P: Recommended methodology for assessing the pro-
gression of osteoarthritis of the hip and knee joints. Osteoar-
thritis Cartilage 1995, 3:73-77.
45. Kreibich DN, Vaz M, Bourne RB, Rorabeck CH, Kim P, Hardie R,
Kramer J, Kirkley A: What is the best way of assessing outcome
after total knee replacement? Clin Orthop Relat Res
1996:221-225.
46. de Groot IB, Favejee MM, Reijman M, Verhaar JAN, Terwee CB: The
Dutch version of the knee injury and osteoarthritis outcome
score: A validation study. Health Qual Life Outcomes 2008, 6:.
47. Rosemann TT, Joos SS, Koerner TT, Szecsenyi JJ, Laux GG: Compar-
ison of AIMS2-SF, WOMAC, x-ray and a global physician
assessment in order to approach quality of life in patients
suffering from osteoarthritis. BMC Musculoskelet Disord 2006,
7:6.
48. Englund M, Lohmander LS: Risk factors for symptomatic knee
osteoarthritis fifteen to twenty-two years after meniscec-
tomy. Arthritis Rheum 2004, 50:2811-2819.
49. Herrlin S, Hållander M, Wange P, Weidenhielm L, Werner S:
Arthroscopic or conservative treatment of degenerative
medial meniscal tears: A prospective randomised trial. Knee
Surg Sports Traumatol Arthrosc 2007, 15:393-401.
50. McHorney CA, Tarlov AR: Individual-patient monitoring in clin-
ical practice: Are available health status surveys adequate?
Qual Life Res 1995, 4:293-307.
51. Paradowski PT, Englund M, Roos EM, Lohmander LS: Similar group
mean scores, but large individual variations, in patient-rele-
vant outcomes over 2 years in meniscectomized subjects
with and without radiographic knee osteoarthritis. Health
Qual Life Outcomes 2004, 2:38.
52. March LM, Cross MJ, Lapsley H, Brnabic AJM, Tribe KL, Bachmeier
CJM, Courtenay BG, Brooks PM: Outcomes after hip or knee
replacement surgery for osteoarthritis – A prospective
cohort study comparing patients' quality of life before and
after surgery with age-related population norms. Med J Aust
1999, 171:235-238.
53. Nunnally JC, Bernstein IH: Psychometric Theory New York: McGraw
Hill; 1994.
54. Soderman P, Malchau H:
Validity and reliability of Swedish
WOMAC osteoarthritis index: a self-administered disease-
specific questionnaire (WOMAC) versus generic instru-
ments (SF-36 and NHP). Acta Orthop Scand 2000, 71:39-46.