báo cáo hóa học: " The de Morton Mobility Index (DEMMI): An essential health index for an ageing world" pptx
Bạn đang xem bản rút gọn của tài liệu. Xem và tải ngay bản đầy đủ của tài liệu tại đây (346.21 KB, 15 trang )
BioMed Central
Page 1 of 15
(page number not for citation purposes)
Health and Quality of Life Outcomes
Open Access
Research
The de Morton Mobility Index (DEMMI): An essential health index
for an ageing world
Natalie A de Morton*
1,2
, Megan Davidson
3
and Jennifer L Keating
1
Address:
1
Department of Physiotherapy, School of Primary Health Care, Faculty of Medicine, Nursing and Health Sciences, Monash University –
Peninsula Campus, PO Box 527, Frankston, Victoria, 3199, Australia,
2
The Northern Clinical Research Center, Northern Health, 185 Cooper St,
Epping, Victoria, 3076, Australia and
3
School of Physiotherapy, Division of Allied Health, Faculty of Health Sciences, La Trobe University, Victoria,
3086, Australia
Email: Natalie A de Morton* - ; Megan Davidson - ;
Jennifer L Keating -
* Corresponding author
Abstract
Background: Existing instruments for measuring mobility are inadequate for accurately assessing
older people across the broad spectrum of abilities. Like other indices that monitor critical aspects
of health such as blood pressure tests, a mobility test for all older acute medical patients provides
essential health data. We have developed and validated an instrument that captures essential
information about the mobility status of older acute medical patients.
Methods: Items suitable for a new mobility instrument were generated from existing scales,
patient interviews and focus groups with experts. 51 items were pilot tested on older acute medical
inpatients. An interval-level unidimensional mobility measure was constructed using Rasch analysis.
The final item set required minimal equipment and was quick and simple to administer. The de
Morton Mobility Index (DEMMI) was validated on an independent sample of older acute medical
inpatients and its clinimetric properties confirmed.
Results: The DEMMI is a 15 item unidimensional measure of mobility. Reliability (MDC
90
), validity
and the minimally clinically important difference (MCID) of the DEMMI were consistent across
independent samples. The MDC
90
and MCID were 9 and 10 points respectively (on the 100 point
Rasch converted interval DEMMI scale).
Conclusion: The DEMMI provides clinicians and researchers with a valid interval-level method for
accurately measuring and monitoring mobility levels of older acute medical patients. DEMMI
validation studies are underway in other clinical settings and in the community. Given the ageing
population and the importance of mobility for health and community participation, there has never
been a greater need for this instrument.
Background
Contemporary beliefs are that physical decline is not the
natural partner of aging and that people can remain phys-
ically able and independent for the duration of their lives.
This progressive position is reflected in encouragement of
regular exercise and activity in older people [1,2]. How-
ever, by systematically reviewing existing instruments, we
identified that a broadly applicable instrument that accu-
Published: 19 August 2008
Health and Quality of Life Outcomes 2008, 6:63 doi:10.1186/1477-7525-6-63
Received: 26 March 2008
Accepted: 19 August 2008
This article is available from: />© 2008 de Morton et al; licensee BioMed Central Ltd.
This is an Open Access article distributed under the terms of the Creative Commons Attribution License ( />),
which permits unrestricted use, distribution, and reproduction in any medium, provided the original work is properly cited.
Health and Quality of Life Outcomes 2008, 6:63 />Page 2 of 15
(page number not for citation purposes)
rately measures and monitors mobility of older adults
across the spectrum of health does not exist [3]. In this
systematic review, the Elderly Mobility Scale (EMS) [4],
Hierarchical Assessment of Balance and Mobility
(HABAM) [5] and the Physical Performance Mobility
Examination (PPME) [6] were identified as potentially
suitable. However, clinimetric evaluation indicated signif-
icant limitations with each of these mobility instruments.
The HABAM, EMS and PPME were each designed for
measuring the mobility of hospitalised older patients. Fol-
lowing clinimetric evaluation [3], the HABAM was identi-
fied to have the most desirable properties of these existing
instruments. However, an important limitation of the
HABAM is a ceiling effect (25% of persons scoring the
highest possible score) in an older acute medical popula-
tion [5]. These findings support the proposal that a new
mobility instrument is required for older acute medical
patients.
Two common instruments for assessing mobility in the
acute hospital environment are the Timed Up and Go test
(TUG) [7] and the Barthel Index (BI)[8]. However, these
instruments have inadequate scale width [9-13] to capture
changes in physical health for people whose limitations
are either severe or relatively modest. The TUG has a floor
effect with approximately one quarter of patients unable
to complete this test because they are too weak [10] and
the BI has a ceiling effect with approximately one quarter
of patients scoring within the error margin of the highest
score [10].
Mobility is an important indicator of the health status of
older people. According to the World Health Organisa-
tion's International Classification of Functioning (ICF)
[14] 'mobility' is classified as one of nine domains of
'activity and participation' and is defined as "moving by
changing body position or location or by transferring
from one place to another, by carrying moving or manip-
ulating objects, by walking, running or climbing, and by
using various forms of transportation."
Without an accurate mobility instrument, healthcare pro-
viders cannot accurately monitor deterioration in mobil-
ity and appropriate strategies to maintain physical health
may not be triggered. It has been argued that inadequate
measures of physical ability, across the spectrum of abili-
ties that exist in older people, presents the most pressing
issue in exercise gerontology [15]. It has also been sug-
gested that until such measures exist, our understanding
of particular aspects of physical ageing will be limited
[16].
Hospitalised people have a diverse range of acute clinical
presentations and co-morbid conditions. The primary
aim of this research was to develop a practical and high
quality instrument with the scale width for measuring the
mobility status of all hospitalised older medical patients.
A fundamental aspect of instrument design was that data
would be based on observation of performance rather
than patient or proxy recall of mobility to avoid distortion
associated with poor recall or cognitive deficits [17].
Methods
The four phases in instrument development were
approved by the Ethics Committees at The Northern Hos-
pital and/or Monash University.
Phase 1: Item generation and development
Items were generated from existing mobility scales, 3
focus groups with academics and clinicians from relevant
healthcare disciplines (n = 24) and patient interviews (n =
12). Items were sought that assessed older people across
the spectrum of mobility from bed bound to fully active
and the search for relevant items continued to the point
where additional information became redundant. Two
independent assessors applied pre-determined criteria. To
be included, it was necessary that the item
• was able to be easily administered i.e. can be performed
at the patient's bedside
• was brief to conduct
• was administered based on observation of patient per-
formance
• could be administered by professionals from different
healthcare professions
• was appropriate to administer in an acute care hospital
• could be safely administered to patients who have an
acute medical condition
• required minimal equipment
• provided measurable information about patient mobil-
ity
• provided objective information about patient mobility
that would facilitate goal setting
for treatment
• administration could be clearly and unambiguously
defined
• provided information that was not duplicated by
another item
Health and Quality of Life Outcomes 2008, 6:63 />Page 3 of 15
(page number not for citation purposes)
Using consensus of experts, unambiguous and practical
testing protocols were developed for 51 mobility items
that remained after two independent assessors removed
redundant items and applied inclusion criteria.
Phase 2: Item testing
Participants
Participants were recruited from general medical wards at
The Northern Hospital, Victoria, Australia. Consecutive
participants were screened by a recruiting officer and were
eligible to participate if 65 years or older and were
assessed within 48 hours of admission. Patients were
excluded if they had a planned hospital stay of less than
48 hours, severe dysphasia, documented contra-indica-
tions to mobilization, were isolated for infection, or if
death was imminent. All eligible participants were invited
to participate. Consent was obtained within 48 hours of
hospital admission. For patients deemed incompetent to
consent, this was obtained from the 'person responsible'
or next-of-kin. Interpreters were employed when required.
Testing procedure
Participants were assessed at the bedside every 48 hours
during hospitalisation or on the Monday following a
weekend. Baseline measurements included age, sex, place
of residence prior to admission, primary language, gait aid
use prior to hospitalisation, Mini Mental State Examina-
tion (MMSE) [18], Charlson Comorbidity Index [19],
APACHE11 Severity of Illness Scale [20], the Barthel Index
(BI) [8,21], Hierarchical Assessment of Balance and
Mobility (HABAM) [5] and the new mobility items. The BI
and HABAM were selected for a head-to-head comparison
with the new mobility instrument. The BI is widely used
as a self report measure of independence in activities of
daily living in the acute hospital setting [11] and, prior to
this study, the HABAM was identified as having the most
desirable properties of existing mobility instruments [3].
Each of these outcome measures are described in further
detail below.
At each assessment a researcher administered the BI and
the MMSE. As close as possible to this assessment, the
patient was assessed on the mobility items by the princi-
pal researcher, who was blind to BI scores. The HABAM
items were a subset of these mobility items.
Mobility items were administered in the order of bed,
chair, balance and walking activities to maximise patient
safety, confidence and ease of testing. Familiarisation tri-
als were not provided to minimise fatigue and time
required to administer the test. At each test the therapist
and patient independently rated the patient's current
mobility compared with admission mobility on a 5 point
scale (much worse, bit worse, same, bit better, much bet-
ter). This provided a reference standard for important
change in mobility.
Outcome measures
The APACHE 11 is a severity of illness scale with a score
range from 0 to 71, where higher scores represent increas-
ing severity of illness during the first 24 hours of hospital
admission. The Charlson Index classifies comorbid condi-
tions according to risk of mortality. One year mortality
rates in a medical population have been reported to be
12%, 26%, 52% and 85% for Charlson scores of 0, 1–2,
3–4 and greater than 5 respectively [19].
The modified BI is an ordinal scale that provides a total
score between 0 and 100 where higher scores indicate
greater independence in activities of daily living [21]. The
HABAM is an interval level mobility instrument that pro-
vides a score between 0 and 26 [5] where higher scores
indicate increasing levels of independent mobility and
was designed for application in an older acute medical
population. The MMSE is reported to be a valid and relia-
ble measure of patient cognition [18]. It provides a score
between 0 and 30 points where increasing scores indicate
better cognitive ability.
Item reduction
The complete set of 51 mobility items were pilot tested for
two weeks to remove items with practical limitations, a
process that included patient and assessor interview about
the mobility tests. The remaining 42 items were then
tested on a large sample by the principal researcher. After
completion, items with practical limitations were
removed and Rasch analysis conducted.
Rasch analysis
Data analyses were performed using SPSS version 12.0
[22] and RUMM2020 [23]. The Rasch partial credit model
was employed to identify misfitting and redundant items
and to identify a hierarchy of mobility items ranked from
easiest to hardest. Participants were divided into 3 class
intervals (ie, 3 groups of patients at different levels of
mobility). Item misfit was considered if the chi-square or
F statistic probability value was less than the Bonferroni-
adjusted a value for multiple testing or the fit residuals
were greater than ± 2.
Item residuals from Rasch analysis were also examined as
a finding of no association between residuals for individ-
ual items has been argued as evidence of local item inde-
pendence [24]. High positive correlation between
residuals provides evidence of local item dependence and
high negative correlations is thought to indicate multidi-
mensionality.
Differential item functioning (DIF) analysis [25] was
planned for age, gender, time of assessment, cognitive sta-
tus (MMSE) and whether an interpreter was required. DIF
was considered significant if the chi-square probability
value was lower than the Bonferroni-adjusted p value. A
Health and Quality of Life Outcomes 2008, 6:63 />Page 4 of 15
(page number not for citation purposes)
priori, these factors were considered potential confounders
to item functioning.
Item response thresholds were also studied to investigate
the existence of disordered thresholds, that is, response
patterns on the rating scale that are not in the expected
order. The person separation index (PSI) was reported to
provide an indication of the internal consistency (reliabil-
ity) of the scale by examining the ability of the instrument
to discriminate among respondents.
Sample size for Rasch analysis was based on recommen-
dations by Linacre et al [26]. These authors recommend a
sample size of 64 – 144 to provide 95% confidence +/- 0.5
logits. Baseline and 48 hour assessments during a 3–4
month period were expected to provide more than 200
assessments. In the absence of DIF by time, all available
assessments would be included for Rasch analysis as rec-
ommended by Wright [27] and Chang and Chang [28].
Phase 3: Interval scoring system and clinimetric evaluation
(development sample)
Based on Rasch analysis, an interval scoring system (0–
100) was developed to facilitate clinical application and
clinimetric evaluation of the reduced item set.
Reliability study
An inter-rater reliability study was conducted on a subset
of patients who reported no fatigue from the first assess-
ment. After the first assessment and a 10 minute rest, the
mobility assessment was repeated by a physiotherapist
blind to the outcomes of the first test. Test order of assess-
ing physiotherapists was randomised. Power calculations
were performed based on recommendations by Walter et
al [29]. The Minimal Detectable Change at 90% confi-
dence (MDC
90
) and accompanying 95% confidence inter-
vals were estimated [30].
Validity
Correlation coefficients and associated 95% confidence
intervals were calculated to investigate the convergent
validity of DEMMI scores with the BI (a measure of a
related construct) and HABAM (a measure of the same
construct), and discriminant validity with the MMSE,
Charlson Index and APACHE 11 (measures of different
constructs). To investigate known-groups validity, an
independent t test was performed on DEMMI scores of
patients discharged to home compared to inpatient reha-
bilitation.
Minimum clinically important difference
The MCID was calculated for DEMMI, HABAM and BI as
the mean change score for patients who rated themselves
'much better' at discharge (criterion based method). The
MCID was also calculated using distribution based
method recommended by Norman et al[31].
Responsiveness to change
The Effect Size Index (distribution method)(ESI) and
Guyatt's Responsiveness Index (criterion method)(GRI),
were selected a priori to calculate measurement respon-
siveness of the DEMMI, HABAM and BI. Inferential 95%
confidence bands were calculated to enable statistical
comparison of responsiveness estimates as recommended
by Tryon [32].
Time to administer
The time required to administer the DEMMI was rounded
to the nearest 30 seconds and was recorded using a stop
watch.
Phase 4: Final DEMMI refinement and validation in an
independent sample
Prior to testing in an independent sample, the DEMMI
was administered by clinicians from several health care
disciplines. Clinician responses to a set of structured, one-
on-one interview questions were used to refine the instru-
ment format, items and testing protocol.
The refined instrument was then tested on an independ-
ent sample of older acute medical patients and evaluated,
as per phases 2 and 3. An independent physiotherapist
(not involved in the instrument development) conducted
the mobility assessments.
Results
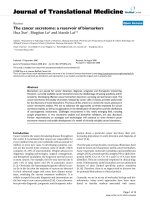
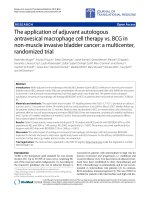
The stages of instrument development in this study are
summarised in Figure 1.
Phase 1: Item generation and development
Ninety seven mobility items were generated from focus
groups and 75 items from existing mobility instruments.
One additional item was generated from patient inter-
views. After removal based on item duplication, redun-
dancy and application of inclusion criteria, 51 items
remained for pilot testing (Table 1).
Phase 2: Item testing
Pilot testing 51 mobility items
Pilot testing on 15 consecutive older general medical
patients identified 9 items for removal based on practical
limitations (Table 1).
Testing of 42 remaining mobility items
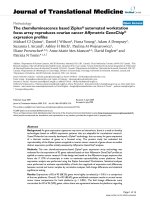
Figure 2 shows that of the 388 new hospital admissions
screened for inclusion, 219 were eligible, 104 were
recruited and 89 performed at least one mobility assess-
ment. Three patients were readmitted during the study
period and were included twice as new hospital admis-
sions. Table 2 shows the admission characteristics for the
86 patients included in this study. There were no adverse
events as a result of the mobility assessments. A further 8
items were removed due to practical limitations that were
Health and Quality of Life Outcomes 2008, 6:63 />Page 5 of 15
(page number not for citation purposes)
Stages of unidimensional instrument developmentFigure 1
Stages of unidimensional instrument development.
Phase 1
Phase 2
Phase 3
Phase 4
Item pilot testing (n = 51 items)
• Removal of items with practical limitations (n = 9 items)
Item testing (n =42 items)
• A priori inclusion criteria applied:
- Removal of items with practical limitations (n = 8 items)
- Equipment requirements minimised (n = 4 items)
- Clinically relevant information obtained is maximised (n = 8 items)
• Reframing of questions to remove local item dependence (n = 2 items)
• Misfit to the Rasch model (n = 3 items)
Inter val scor ing system for the r educed item set (n = 17 items)
• Development of a Rasch constructed interval scoring system
Instr ument r efinement (n = 17 items)
Instrument refinement based on feedback from experts from across
healthcare disciplines after administering the instrument
Validation in an independent sample by an independent assessor (n =15 items)
• Testing of the refined instrument on an independent sample
Clinimetr ic evaluation of the final instrument
(
n =15 items
)
Clinimetr ic evaluation of the reduced item set (n = 17 items)
Development of clearly defined item testing protocols (n = 51 items)
Based on:
• the opinions of experts
• the existing literature
Conceptual item r eduction by 2 independent assessors
• Remove of item redundancy and duplication across item generation methods
• Application of clinically sensible a priori inclusion criteria
Item gener ation
Based on:
• the opinions of experts (n = 97 items)
• the existing literature (n = 75 items)
• the opinions of patients (n = 1 additional item)
Health and Quality of Life Outcomes 2008, 6:63 />Page 6 of 15
(page number not for citation purposes)
Table 1: Reasons for item exclusion at each stage of instrument development
Excluded item Reason for exclusion
Pilot testing of 51 mobility items: 9 items excluded due to practical limitations
Number of times in/out of bed in 10 sec Removed to maximise patient safety. Difficult to test for patients who
have drips, drains, indwelling catheters etc. A similar item, 'lying to
sitting independently within 10 seconds' was deemed to be safer and
provided similar clinical information.
Sit to stand 3 times in 10 seconds To reduce the burden of testing by minimising redundancy of sit to stand
items. 'Independent sit to stand in 3 seconds' was retained due to
shorter administration time.
Sitting balance and turning head Many patients had significantly limited cervical range of movement and
therefore this test was difficult to standardise across patients.
Reach sideways to pick up pen from floor (sitting) Several patients reported feeling dizzy performing this task after first
attempting to reach forward to pick up pen from floor. Reaching
forwards to pick up a pen was considered to be the more functional
item and was therefore retained.
Reach sideways to pick up pen from floor (standing) As above
Walk 6 meters in 10 seconds Requires a standardised walking test environment which could not be
relied upon.
Step test Requires a standardised step. Removed due to equipment requirements.
Step Requires a standardised step. Removed due to equipment requirements.
Step over box Requires a standardised step. Removed due to equipment requirements.
Testing of 42 mobility items: 8 items excluded due to practical limitations
Skipping This is a complex movement that required practice to perform in a
standardised way.
Sit to stand using the chair seat (not using the arms of the chair) For wider patients there was not enough space to push up from the
seat. Cognitively impaired patients found this task difficult to understand
when the arms of the chair were accessible.
Immediate standing balance Required significant explanation, particularly for cognitively impaired
patients.
Semi tandem stance Required significant explanation and/or demonstration for patients to
understand task.
Reach in sitting Dizziness prevented some patients from successfully completing this
item.
360 degree turn This item was difficult to perform with patients who had lines, drips,
drains etc.
Sit to lie Asking the patient to return to bed to assess this item interrupted the
flow of testing.
Hop This is a dynamic single leg activity and was removed to maximise patient
safety.
Reframing walking items to remove potential for local item dependence (assumption of Rasch analysis)
Four walking items: 5 m, 10 m, 20 m and 50 m
(response options were levels of assistance for each distance)
4 walking items replaced with 2 items:
1. walks +/- gait aid (with distance response options)
2. walking assistance (with levels of assistance for response options)
Rasch analysis of 32 mobility items: 4 items removed
Transferring from bed to chair Required equipment and had similar threshold locations to other items
Carrying a glass of water while walking Required equipment and had similar threshold locations to other items
Timed bed transfer Required equipment and had similar threshold locations to other items
Timed chair transfer Required equipment and had similar threshold locations to other items
Removal of items that provided similar clinical information (and to avoid local item dependence): 8 items removed
Sitting arm raise Similar items: Sitting unsupported and sitting arm raise
Health and Quality of Life Outcomes 2008, 6:63 />Page 7 of 15
(page number not for citation purposes)
identified following further testing and the 4 walking
items were rescored to 2 items to limit local item depend-
ence (an assumption of Rasch analysis)(Table 1).
Rasch analysis of 32 mobility items
Following item testing and Rasch analysis, 32 items were
reduced to 17 (Table 1). DIF by time was not identified for
the 17 items and therefore Rasch analysis was performed
on data from hospital admission and subsequent 48 hour
assessments. Rescoring three items (lie to sit, sit to stand and
walking distance) produced ordered thresholds for all
items.
Data for the 17 mobility items fitted the Rasch model
(item-trait χ
2
= 41.17, df = 34, p = 0.19). The t test proce-
dure [24,33] identified that the percentage of individual t
tests outside the acceptable range was only 4.23%. (95%
CI 1.0% to 7.0%). This provides further evidence of the
unidimensionality of the 17 mobility items.
Examination of the residual correlation matrix indicated
negative correlations of greater than 0.3 between sit unsup-
ported and bridge (r = -0.55), standing on toes and stand on
one leg eyes closed (r = -0.58) and tandem standing eyes closed
and walking distance (r = 0.35). However, these findings
were not supported by high fit residuals for any of these
items. A positive correlation of greater than 0.30 was only
identified between the roll and lie to sit (r = +0.37) items.
Although this result indicates the possibility of some
response dependency between these mobility tasks, both
items were retained as each provides important clinical
information regarding patient mobility and care needs
during acute hospitalisation. In addition, examination of
the admission only dataset indicated a lower correlation
of +0.21.
Person separation was 0.92, indicating the test could dis-
criminate 5.8 strata of ability.
Phase 3: Interval scoring system and clinimetric evaluation
Raw scores for the reduced item set were converted to a 0–
100 interval scale. The clinimetric properties for the 17
item DEMMI are reported in Table 3.
Reliability
Correlation between independent assessor DEMMI inter-
val scores was high (Pearson's r = 0.94, 95% CI 0.86 to
0.98). The mean scores for assessors 1 and 2 were 57.19
(sd = 17.07) and 55.05 (sd = 13.77) points respectively. A
paired t test indicated no systematic differences between
assessors (p = 0.14). Using a pooled standard deviation of
15.51, the standard error of measurement (SEM) was 4.10
and the inter-rater reliability MDC
90
was 9.51 points
(95% CI 5.04 to 13.32) on the 100 point DEMMI interval
scale. This indicates that a patient needs to improve or
deteriorate by 10 points or more for a clinician to be 90%
'Sitting unsupported' is a simpler test and maximises scale width as it has
the lowest logit item score (easiest item).
×5 sit to stand without arms Similar items:
×1 sit to stand without arms and ×5 sit to stand without
arms.
'x1 sit to stand without arms' is a simpler and quicker test.
Standing arm raise Standing with eyes closed Similar items:
Standing unsupported, standing arm raise and standing
with eyes closed.
'Standing unsupported' is the simplest test and is an important
component of independent mobility.
Standing with feet together eyes closed Similar items:
Standing with feet together and standing with feet
together eyes closed
'Standing with feet together' is a simpler test.
Tandem standing Tandem walking Similar items:
Tandem standing, tandem standing with eyes closed and
tandem walking
'Tandem standing with eyes closed' had the second highest item logit
location (second most difficult item) and was therefore retained to
maximise scale width.
Stand on one leg Similar items:
Stand on one leg and stand on one leg eyes closed
'Stand on one leg with eyes closed' had the highest item logit location
(most difficult item) and was therefore retained to maximise scale width.
Rasch analysis of 20 mobility items: 3 items removed
Toe walk Similar threshold locations to other items and statistically significant
misfit
Heel walk Similar threshold locations to other items and statistically significant
misfit
Sideways walking Similar threshold locations to other items and statistically significant
misfit
Table 1: Reasons for item exclusion at each stage of instrument development (Continued)
Health and Quality of Life Outcomes 2008, 6:63 />Page 8 of 15
(page number not for citation purposes)
confident that a true change in patient condition has
occurred. A paired t test indicated no systematic difference
between the first and second assessment scores (p = 0.77).
Validity
DEMMI scores had a significant and high correlation with
HABAM and BI scores. This provides evidence of conver-
gent validity for the DEMMI.
Discriminant validity for the DEMMI was evidenced by a
low correlation with measures of other constructs (MMSE,
APACHE 11 severity of illness and Charlson co-morbidity
index scores).
An independent t test showed that patients who were dis-
charged to inpatient rehabilitation had significantly lower
DEMMI scores at acute hospital discharge than those dis-
charged to home. Patients discharged to inpatient rehabil-
itation had a mean DEMMI score of 39.55 (sd = 9.41, 95%
CI 33.72 to 45.38) and patients discharged to home had a
mean DEMMI score of 59.61 (sd = 13.22, 95% CI 56.30
to 62.93). This provides evidence of known groups valid-
ity for the DEMMI.
Responsiveness
There was no significant difference identified between the
responsiveness of DEMMI and HABAM measurements or
DEMMI and BI measurements using the ESI or GRI based
on patient or therapist report of change.
Minimally clinically important difference
By calculating the average change in DEMMI score for
patients who reported to be 'much better' in their mobility
between hospital admission and discharge, the MCID for
the DEMMI was identified to be 8 points, that is, a change
of 8 points or more is likely to represent a patient per-
ceived important change in mobility. Using Norman et
al.'s [31] distribution based method, the MCID was also
calculated to be 8 points for the DEMMI.
Phase 4: Final DEMMI refinement and validation in an
independent sample
Item refinement
Feedback from 15 clinicians was obtained following their
administration of the DEMMI. Minor changes were made
to the sit unsupported item and testing protocol and the
final format of the DEMMI.
Table 2: Patient baseline demographics for the instrument development and validation
Patient Baseline demographics Development study n = 86 Validation study n = 106
Mean Age years (sd) 79.2 (7.1) 81.2 (7.3)
Gender (% female) 53% 47.3%
Place of prior residence
Home alone 24 (27.9%) 31 (29.3%)
Home accompanied 52 (60.5%) 65 (61.3%)
Hostel/SRS 6 (7%) 8 (7.6%)
Nursing Home 4 (4.7%) 2 (1.9%)
Primary Language
English 59 (68.6%) 75 (69.8%)
Italian 17 (19.8%) 14 (13.2%)
Macedonian 3 (3.5%) 1 (0.9%)
Other 7 (8.1%) 17 (16.1%)
Gait aid prior to hospital admission
None 32 (37.2%) 50 (44.6%)
Walking stick 26 (30.2%) 22 (19.6%)
Frame 25 (29.1%) 37 (33%)
Other 3 (3.5%) 3 (2.7%)
Primary Diagnosis
Circulatory 20 (23.3%) 21 (19.8%)
Respiratory 13 (15.1%) 37 (34.9%)
Endocrine 9 (10.5%) 6 (5.7%)
Digestive 4 (4.7%) 7 (6.6%)
Genitourinary 4 (4.7%) 6 (5.7%)
Musculoskeletal 4 (4.7%) 3 (2.8%)
Other 32 (37.2%) 26 (24.5%)
Mean Charlson Index (sd) 1.83 (1.54), n = 84 1.94 (1.57), n = 105
Mean APACHE II (sd) 11.89 (3.10), n = 83 12.60 (3.77), n = 105
Mean MMSE (sd) 21.73 (7.57), range 0–30 n = 85 22.77 (6.30), range 1–30, n = 103
Mean Barthel Index (sd) 81.29 (22.72), range 20–100 82.47 (18.80), range 15–100, n = 105
Mean HABAM (sd) 18.06 (6.78), range 0–26 16.83 (6.77), range 0–26
Health and Quality of Life Outcomes 2008, 6:63 />Page 9 of 15
(page number not for citation purposes)
Development sample: flow of participants through the studyFigure 2
Development sample: flow of participants through the study. *3 patients were readmitted during the study period and
were tested twice as 'new admissions.'
Admission to ICU or stroke unit 20
Isolated for infection 5
Planned less than 48 hour admission 16
Severe dysphasia 19
Aggressive 4
Death imminent 1
Other reason for exclusion 5
Total 70
Withdrew before first assessment 6
Withdrew after first assessment 2
Refused first assessment and then
withdrew
1
Refused first assessment and then
discharged from hospital
3
Rest in bed orders after consenting to
study and then discharged from
hospital
1
Discharged prior to first assessment 3
Missed assessment and then
discharged from hospital
3
Transferred to another ward 1
Total 20
109 new hospital admissions
recruited
Eligible but consent not
obtained
59
238 new hospital admission patients screened
89* new hospital admission patients
completed at least one mobility
assessment
Health and Quality of Life Outcomes 2008, 6:63 />Page 10 of 15
(page number not for citation purposes)
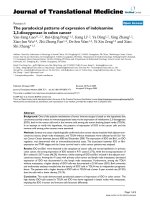
Validation in an independent sample
Figure 3 shows that of 344 new hospital admissions
screened, 216 were eligible, 132 were recruited and 112
performed at least one mobility assessment. Six patients
were readmitted during the study period and were
included twice as new hospital admissions. Another six
patients did not complete a hospital admission assess-
ment. Table 2 shows the admission characteristics for the
106 patients included in this study. A total of 312 mobil-
ity assessments were performed using the 17 mobility
items. Patients in the validation study did not differ from
the instrument development sample on any baseline char-
acteristic.
Prior to conducting Rasch analysis the jog item was
removed. This item required clinical experience of medi-
cal conditions to determine whether testing should pro-
ceed. No participant was able to successfully complete the
standing on one leg with eyes closed item in the validation
study. Rasch analysis was therefore performed for the
remaining 15 items.
In the validation study, the pooled dataset showed misfit
to the Rasch model due to large sample size as there was
no evidence of DIF by time or multidimensionality. Using
the t test procedure [24,33], multidimensionality was not
identified. Four items (reaching for pen, backward walking,
standing on toes and sit to stand no arms) had a positive cor-
relation of 0.3 or greater and three items (walking distance,
roll and lie-sit) had a negative correlation of 0.3 or greater
with the first residual component. The t test procedure
indicated the percentage of individual t tests outside the
acceptable range was 4.88% (95% CI -2.0% to 7.0%). This
provides further evidence of the unidimensionality of the
15 DEMMI items and therefore does not explain the misfit
of the data to the Rasch model. No evidence of local item
Table 3: Clinimetric properties of the DEMMI
Clinimetric property Development study 17 items Validation study 15 items
Reliability, MDC
90
(95%CI)
Inter rater 9.5 (5.0 to 13.3), n = 21 8.90 (6.3 to 12.7), n = 35
MCID (95%CI)
Criterion based method 7.8 (5.3 to 10.2) 9.43 (5.9 to 12.9)
Distribution based method 8.0 10.5
Construct Validity (r, 95%CI)
Convergent
HABAM 0.92 (0.88 to 0.95), p = 0.00 0.91 (0.87 to 0.94), p = 0.00
Barthel Index 0.76 (0.65 to 0.84), p = 0.00 0.68 (0.56 to 0.77), p = 0.00
Discriminant
MMSE 0.36 (0.16 to 0.53), p = 0.00 0.24 (0.05 to 0.41), p = 0.02
APACHE 11 -0.11 (-0.32 to 0.11), p = 0.18 0.07 (-0.12 to 0.26), p = 0.49
Charlson -0.19 (-0.39 to 0.03), p = 0.11 -0.04 (-0.23 to 0.15), p = 0.68
Known Groups (DEMMI, 95%CI)
discharge to rehabilitation 37.54 (33.99 to 45.10), n = 11 50.75 (42.39 to 59.11)n = 8
discharge to home 59.61 (56.32 to 62.90), n = 62
Independent t test: p = 0.00
62.14 (57.80 to 66.49) n = 70
Independent t test: p = 0.03
Responsiveness to change
#
Effect Size Index
#
DEMMI 0.37 (0.28 to 0.46) 0.39 (0.28 to 0.50)*
HABAM 0.31 (0.20 to 0.43) 0.35 (0.23 to 0.47)
Barthel Index 0.30 (0.17 to 0.44) 0.13 (0.01 to 0.25)*
GRI (patient)
#
DEMMI 1.23 (0.90 to 1.56) 0.92 (0.66 to 1.17)*
HABAM 1.00 (0.46 to 1.55) 0.72 (0.49 to 0.94)
Barthel Index 0.48 (0.01 to 0.95) 0.43 (0.21 to 0.65)*
GRI (therapist)
#
DEMMI 2.06 (1.60 to 2.51) 1.73 (1.37 to 2.09)*
HABAM 2.62 (1.70 to 3.54) 1.17 (0.86 to 1.48)
Barthel Index 1.58 (0.56 to 2.60) 0.65 (0.37 to 0.93)*
Floor effect 0% <1%
Ceiling effect <1% 3.8%
Time to administer, mean (sd) 13 mins 42 seconds (4.99 mins) for 42 mobility items 8 mins 47 seconds (3.89 minutes) for 17 mobility
items
GRI = Guyatt's Responsiveness Index,
#
Tryon's inferential confidence intervals
* significant difference: evidenced by non overlapping inferential confidence intervals
Health and Quality of Life Outcomes 2008, 6:63 />Page 11 of 15
(page number not for citation purposes)
Validation sample: flow of participants through the studyFigure 3
Validation sample: flow of participants through the study. * 6 patients were readmitted during the study period and
were tested twice as 'new admissions.' # 106 'new admission' patients (100 patients) completed a hospital admission assess-
ment (6 patients did not perform an admission assessment)
Admission to ICU or stroke unit 32
Isolated for infection 15
Planned less than 48 hour admission 22
Severe dysphasia 39
Aggressive 7
Death imminent 1
Interpreter not available 1
Other 11
Total 128
Withdrew before first assessment 4
Withdrew after first assessment 5
Refused first assessment and then
withdrew
0
Refused first assessment and then
discharged from hospital
3
Discharged prior to first assessment 4
Missed first assessment and then
discharged from hospital
1
First assessment unable to be
conducted and then discharged from
hospital
2
Transferred to another unit 1
Total 20
132 new hospital
admissions recruited
Eligible but consent not
obtained
86
112*
#
new hospital admission patients
completed at least one mobility
assessment
344 new hospital admission patients screened
Health and Quality of Life Outcomes 2008, 6:63 />Page 12 of 15
(page number not for citation purposes)
dependency was identified as there was an absence of cor-
relations in the residuals above a magnitude of 0.3.
Data fitted the model at each assessment time point; base-
line (χ
2
= 24.60, df = 30, p = 0.74), first 48 hour assess-
ment (χ
2
= 36.37, df = 30, p = 0.20) and subsequent 48
hour assessments (χ
2
= 36.26, df = 28, p = 0.14). Given the
similar findings across samples, analysis of hospital
admission data is reported.
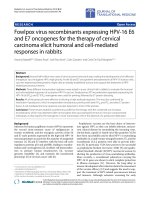
There were 106 hospital admission mobility assessments
performed. The mobility items were well targeted for
older acute medical patients. Figure 4 shows the average
item difficulty and the person ability locations on the logit
scale. There were only a few persons with a lower ability
than the easiest item (to the left of the scale), or with a
higher ability than the hardest item (to the right of the
scale). None of the items showed misfit to the model and
χ
2
and F statistic Bonferroni adjusted probability values
for the 15 items were non significant. Person separation
was 0.88, indicating the test could reliably identify 3.7
strata of ability.
Three items showed significant DIF by age but appear to
be statistical artifacts due to a small number of partici-
pants in one of the three class intervals. Two items (lie to
sit and walking independence) showed mild disordering of
one threshold. However, inspection of item thresholds in
the pooled dataset showed these items to be ordered and
they were not rescored.
Figure 5 shows the item hierarchy for the 15 DEMMI items
was consistent across independent samples. The final
DEMMI is shown in Additional file 1 and its clinimetric
properties reported in Table 3. The measurement proper-
ties of the DEMMI (Rasch, reliability, validity and MCID)
were consistent with estimates obtained from the instru-
ment development sample.
Discussion
The DEMMI provides clinicians and researchers with an
advanced, practical and reliable instrument for measuring
mobility in hospitalised older acute medical patients. The
DEMMI is a unidimensional instrument that measures
mobility across the spectrum from bed bound to inde-
pendent mobility. It is safe, quick and easy to administer,
has minimal equipment requirements, can be adminis-
tered at a patient's bedside and provides interval data.
The DEMMI overcomes ceiling effects identified in the BI
and HABAM and the floor effect identified in the Timed
Up and Go in an older acute medical patient population.
The DEMMI items cover the broad spectrum of mobility
levels that exist for older acute general medical patients as
neither ceiling nor floor effect were identified. Therefore
this instrument has the width required to measure
Person-item threshold graph for admission mobility assessments for the 15 item DEMMI in the validation sampleFigure 4
Person-item threshold graph for admission mobility assessments for the 15 item DEMMI in the validation sample.
Decreasing item difficulty (blue) and
person ability (pink)
Increasing item difficulty (blue) and
person ability (pink)
Health and Quality of Life Outcomes 2008, 6:63 />Page 13 of 15
(page number not for citation purposes)
improvement and deterioration in mobility across the
spectrum of mobility levels that exist in an older acute
medical patient population.
The DEMMI contains items that are considered to be
important hallmarks of independent mobility and have
face validity for measuring the domain of mobility as
defined by the World Health Organisation [14]. Therefore
this new mobility instrument facilitates the comprehen-
sive assessment of mobility for older medical patients and
assessment findings can be used to assist in goal setting for
therapeutic intervention. For example, an older medical
patient who has a logit location of -2.4 (or interval meas-
ure score of 38 at hospital admission) would be expected
to be able to perform bed based mobility tasks, require
minimal assistance or supervision for transfers in and out
of the chair, have adequate balance to sit and stand
unsupported and walk short distances with assistance or
supervision. The mobility hierarchy indicates that for this
patient to progress along the mobility continuum, goals
for therapeutic intervention should include achieving
independence in bed and chair transfers, then increasing
walking distances and improving standing balance. Any
item that the patient cannot do that they would be
expected to be able to complete based on their total score
can also be easily identified using this method (i.e. items
lower in the mobility hierarchy than other items that were
successfully completed).
The DEMMI has minimal equipment requirements and
the scale protocol and scoring system fit onto one page
(back and front). Only a bed or plinth, arm chair (seat
height 45 cm) and pen are required to conduct the test.
These pieces of equipment are usually readily available in
hospital wards or emergency departments. The DEMMI
can be quickly and easily applied in an acute hospital
where the time and space available for testing would be
similar, if not more constrained, than other clinical set-
tings. Since the DEMMI is appropriate and without practi-
cal limitations for the broad spectrum of conditions seen
in older acute medical patients, it is likely to also be safe
for administration in most clinical populations.
Item logit location for baseline data for the scale development and validation studiesFigure 5
Item logit location for baseline data for the scale development and validation studies.
-10
-8
-6
-4
-2
0
2
4
6
8
sit unsupported
Logit location (95%CI)
Development sample
Validation sample
bridg
e
stand unsupported
sit to stand
rol
l
lie to sit
.
distance walked
.
stand feet together
stand and reach
walk backwards
.
sit to stand no arms
walking assistanc
e
stand on toes
jump
.
tandem st eyes cl
Health and Quality of Life Outcomes 2008, 6:63 />Page 14 of 15
(page number not for citation purposes)
The DEMMI item hierarchy was consistent across inde-
pendent samples despite being administered by differing
clinicians and testing a smaller number of items in the val-
idation study. In support of earlier studies [5,34], this pro-
vides strong evidence that for heterogeneous older patient
populations, physical recovery from illness follows a com-
mon path. Since older patients are expected to progress
across the DEMMI mobility continuum in a predictable
manner, the DEMMI hierarchy provides clinicians with a
systematic method for identifying capabilities and limita-
tions. The DEMMI facilitates comprehensive assessment
of mobility and assessment findings can be used to define
specific targets for therapeutic intervention.
Fit of the data to the Rasch model validates the summa-
tion of mobility item scores to produce a total mobility
score and indicates that the DEMMI provides interval level
data. A simple conversion table allows ordinal mobility
scores (out of 19) to be converted to interval mobility
scores (out of 100). For statistical purposes, a group mean
increase of 20 (converted) points, for example, represents
the same amount of improvement in mobility across indi-
viduals regardless of whether the patient is bed bound or
independently mobile at initial assessment. Interval data
allows researchers to interpret parametric statistical tests
of DEMMI data.
In the validation study, two items were tested but
removed from analysis. The jog item was removed to max-
imise the potential for the DEMMI to be used by clinicians
with varying clinical experience and from different health-
care disciplines. Since this item was tested last, patient
performance on this item did not influence performance
on other items. The standing on one leg eyes closed item was
the most difficult item in the instrument development
sample. Since no participants were able to successfully
complete the standing on one leg eyes closed item in the val-
idation study, this extreme item could not be included in
Rasch analysis. However, given that the properties of the
15 DEMMI items were consistent across independent
samples despite the differing number of items tested,
removal of this item (attempted by only 30% of patients)
is unlikely to have influenced the estimated clinimetric
properties of the final instrument.
The consistency of the DEMMI across independent sam-
ples provides confidence in the interpretation and clinical
application of DEMMI scores. The MDC
90
indicates that a
minimum change score of 9 Rasch converted points on
the DEMMI is required for 90% confidence that a true
change in patient mobility has occurred and the MCID
indicates a minimum change of 10 points is required to
represent a clinically important change in patient mobil-
ity. These data were derived from inter-rater error esti-
mates. Since inter-rater reliability estimates are typically
larger than intra-rater, our calculations provide clinicians
with conservative estimates of measurement error.
Although the DEMMI was developed for acutely hospital-
ised older patients, the potential applications of this
instrument are broad. Due to its inclusive scale width, the
DEMMI has the potential to be used in many clinical set-
tings and subsequently enhance the continuity of care of
older adults across providers, clinical settings and in the
community. Further research is underway to validate the
DEMMI across clinical settings and in the community and
to translate the DEMMI into other languages.
It is possible that sampling bias may exist in the data
reported in this research. Firstly, the requirement to
obtain written and informed consent may have resulted in
the inclusion of a healthier and less cognitively impaired
cohort of patients compared to a typical older acute med-
ical population. Secondly, data collection for both the
development and validation studies was conducted at the
same hospital site. However, since Rasch analysis assesses
the consistency of item response patterns relative to the
total score, sampling bias will not have influenced the fit
of the data to the Rasch model in this research.
Conclusion
The DEMMI has been rigorously developed and validated.
More than 500 DEMMI assessments have been conducted
and the Rasch, reliability, validity and MCID properties of
the DEMMI were consistent across independent samples
of older acute medical patients. Maximising the inde-
pendence of older people is fundamental to prolonging
health and quality of life and reducing dependence on
limited healthcare resources.
Competing interests
The authors declare that they have no competing interests.
Authors' contributions
Nd conceived and designed the study, acquired the data,
analysed and interpreted the data, wrote the manuscript
and has given final approval of the version to be pub-
lished. MD contributed to the analysis and interpretation
of the data, has been involved in the drafting of the man-
uscript and given approval for the version to be published.
JK contributed to the conception and design of the study,
the analysis and interpretation of data, drafting of the
manuscript and has given final approval of the version to
be published.
This research was presented by Dr Natalie de Morton at
the World Physical Therapy Congress, Vancouver, Canada,
June 2007, the Australian Physiotherapy Association Confer-
Health and Quality of Life Outcomes 2008, 6:63 />Page 15 of 15
(page number not for citation purposes)
ence, Cairns, Australia, October 2007 and the Australian
Association of Gerontology Conference (NSW region), Woo-
longong, Australia, April 2008.
Additional material
Acknowledgements
The authors would like to acknowledge the support of The Northern Clin-
ical Research Center, Northern Health (in particular, Dr David Berlowitz,
Ms Marnie Graco, Ms Anna Barker, Mr Shane Grant, Ms Victoria Lawlor
and Ms Dorothy Lewis) and the physiotherapy department at The North-
ern Hospital, Northern Health.
Funding sources for this research were the HCF Health and Medical
Research Foundation (external grant) and the National Health and Medical
Research Council of Australia (Dora Lush Postgraduate Scholarship, Grant
no. 280632).
References
1. Mazzeo R, Cavanagh P, Evans W, Fiatarone M, Hagberg J, McAuley E,
Startzell J: ACSM Position Stand: Exercise and Physical Activ-
ity for Older Adults. Medicine & Science in Sports & Exercise 1998,
30:992-1008.
2. Morris ME, Schoo Ae: Optimizing Exercise and Physical Activity in Older
People London, UK: Butterworth Heinemann; 2004.
3. de Morton N, Berlowitz D, Keating J: A systematic review of
mobility instruments and their measurement properties for
older acute medical patients. BMC Health and Quality of Life Out-
comes 2008, 6:44.
4. Smith R: Validation and reliability of the Elderly Mobility
Scale. Physiotherapy 1994, 80:744-747.
5. MacKnight C, Rockwood K: Rasch analysis of the hierarchical
assessment of balance and mobility (HABAM). Journal of Clini-
cal Epidemiology 2000, 53:1242-1247.
6. Winograd CH, Lemsky CM, Nevitt MC, Nordstrom TM, Stewart AL,
Miller CJ, Bloch DA: Development of a physical performance
and mobility examination. Journal of the American Geriatrics Society
1994, 42:743-749.
7. Podsiadlo D, Richardson S: The Timed "Up & Go": a test of basic
functional mobility for the frail elderly persons. Journal of the
American Geriatrics Society 1991, 39:142-148.
8. Mahoney FI, Barthel DW: Functional Evaluation: The Barthel
Index. Maryland State Medical Journal 1965, 14:61-65.
9. de Morton NA, Keating JL, Berlowitz DJ, Jackson B, Lim WK: Addi-
tional exercise does not change hospital or patient outcomes
in older medical patients: a controlled clinical trial. Australian
Journal of Physiotherapy 2007, 53:105-111.
10. de Morton N, Jones C, Keating J, Berlowitz D, MacGregor L, Lim W,
Jackson B, Brand C: The effect of exercise on outcomes for hos-
pitalised older acute medical patients: An individual patient
data meta-analysis. Age Ageing 2007, 36:219-222.
11. de Morton NA, Keating JL, Jeffs K: Exercise for acutely hospital-
ised older medical patients. Cochrane Database Syst Rev 2007,
24(1):CD005955.
12. de Morton NA, Keating JL, Jeffs K: The effect of exercise on out-
comes for older acute medical inpatients compared to con-
trol or alternative treatments: a systematic review of
randomised controlled trials. Clinical Rehabilitation 2007, 21:3-16.
13. de Morton N, Keating J, Davidson M: Rasch analysis of the Barthel
Index in the assessment of hospitalised older patients follow-
ing admission for an acute medical condition. Archives of Phys-
ical Medicine & Rehabilitation 2008, 89:641-647.
14. World Health Organisation: International Classification of Functioning,
Disability and Health Geneva, Switzerland; 2001.
15. Rikli RE, Jones CJ: Assessing Physical Performance in independ-
ent older adults: Issues and guidelines. Journal of Aging and Phys-
ical Activity 1997, 5:244-261.
16. Chodzko-Zajko WJ: Assessing physical performance in older
adult populations. Journal of Aging and Physical Activity 1994,
2:103-104.
17. Guralnik J, Simonsick E, Ferrucci L, Glynn R, Berkman L, Blazer D,
Scherr P, Wallace R: A short physical performance battery
assessing lower extremity function: association with self-
reported disability and prediction of mortality and nursing
home admission. J Gerontol 1994, 49(2):M85-M94.
18. Folstein MF, Folstein SE, McHugh PR: "Mini-Mental State." A
practical method for grading the cognitive state of patients
for the clinician. Journal of Psychiatric Reserve 1975, 12:189-198.
19. Charlson ME, Pompei P, Ales KL, MacKenzie CR: A new method of
classifying prognostic comorbidity in longitudinal studies:
development and validation. Journal of Chronic Disease 1987,
40:373-383.
20. Knaus W, Draper E, Wagner DP, Zimmerman JE: APACHE 11: A
severity of disease classification system. Critical Care Medicine
1985, 13:818-829.
21. Shah S, Vanclay F, Cooper B: Improving the sensitivity of the
Barthel Index for stroke rehabilitation. Journal of Clinical Epide-
miology 1989, 42:703-709.
22. SPSS for Windows [computer program]. Chicago: SPSS Inc;
2003. Rel 12.0.0
23. Andrich D, Sheridan BS, Luo G:
RUMM2020 [computer pro-
gram]. Western Australia: RUMM Laboratory.
24. Smith E: Detecting and evaluating the impact of multidimen-
sionality using item fit statistics and principal components
analysis of residuals. Journal of Applied Measurement 2002,
3:205-231.
25. Smith R: Fit analysis in latent trait measurement models. J
Appl Meas 2000, 1(2):199-218.
26. Linacre JM: Sample size and item calibration stability. Rasch
Measurement Transactions 1994, 7:328.
27. Wright BD: Rack and stack: time 1 vs time 2. Rasch Measurement
Transactions 2003, 17:905-906.
28. Chang W, Chan C: Rasch analysis for outcome measures: some
methodological considerations. Archives of Physical Medicine and
Rehabilitation 1995, 76:934-939.
29. Walter SD, Eliasziw M, Donner A: Sample size and optimal
designs for reliability studies. Statistics in Medicine 1998,
17:101-110.
30. Stratford PW, Binkley JM, Riddle DL: Health status measures:
strategies and analytic methods for assessing change scores.
Physical Therapy 1996, 76:1109-1123.
31. Norman GR, Sloan JA, Wyrwich KW: Interpretation of changes
on health related quality of life. The remarkable universality
of half a standard deviation. Medical Care 2003, 41:582-592.
32. Tryon W: Evaluating statistical difference, equivalence, and
indeterminacy using inferential confidence intervals: an inte-
grated alternative method of conducting null hypothesis sta-
tistical tests. Psychological Methods 2001, 6:371-386.
33. Tennant A, Pallant J: Unidimensionality matters! (A tale of two
Smiths?). Rasch Measurement Transactions 2006, 20:1048-1051.
34. Katz S, Ford A, Moskowitz R, Jackson B, Jaffe M: Studies of illness
in the aged. Journal of the Amercian Medical Association 1963,
185:
94-99.
Additional file 1
The DEMMI.
Click here for file
[ />7525-6-63-S1.pdf]