báo cáo hóa học: " Internal construct validity of the Warwick-Edinburgh Mental Well-being Scale (WEMWBS): a Rasch analysis using data from the Scottish Health Education Population Survey" potx
Bạn đang xem bản rút gọn của tài liệu. Xem và tải ngay bản đầy đủ của tài liệu tại đây (237.24 KB, 8 trang )
BioMed Central
Page 1 of 8
(page number not for citation purposes)
Health and Quality of Life Outcomes
Open Access
Research
Internal construct validity of the Warwick-Edinburgh Mental
Well-being Scale (WEMWBS): a Rasch analysis using data from the
Scottish Health Education Population Survey
Sarah Stewart-Brown*
1
, Alan Tennant
2
, Ruth Tennant
3
, Stephen Platt
4
,
Jane Parkinson
5
and Scott Weich
1
Address:
1
Warwick Medical School, University of Warwick, Coventry, CV4 7AL, UK,
2
Department of Rehabilitation Medicine, Faculty of Medicine
and Health, The University of Leeds, Leeds General Infirmary, St George St, Leeds, LS1 3EX, UK,
3
Coventry Teaching Primary Care Trust,
Christchurch House, Greyfriars Lane, Coventry, CV1 2GQ, UK,
4
Community Health Sciences, School of Clinical Sciences & Community Health,
University of Edinburgh, Teviot Place, Edinburgh, EH8 9AG, UK and
5
NHS Health Scotland, Elphinstone House, 65 West Regent Street, Glasgow,
G2 2AF, UK
Email: Sarah Stewart-Brown* - ; Alan Tennant - ;
Ruth Tennant - ; Stephen Platt - ; Jane Parkinson - ;
Scott Weich -
* Corresponding author
Abstract
Background: The Warwick-Edinburgh Mental Well-Being Scale (WEMWBS) was developed to meet demand for instruments
to measure mental well-being. It comprises 14 positively phrased Likert-style items and fulfils classic criteria for scale
development. We report here the internal construct validity of WEMWBS from the perspective of the Rasch measurement
model.
Methods: The model was applied to data collected from 779 respondents in Wave 12 (Autumn 2006) of the Scottish Health
Education Population Survey. Respondents were aged 16–74 (average 41.9) yrs.
Results: Initial fit to model expectations was poor. The items 'I've been feeling good about myself', 'I've been interested in new
things' and 'I've been feeling cheerful' all showed significant misfit to model expectations, and were deleted. This led to a marginal
improvement in fit to the model. After further analysis, more items were deleted and a strict unidimensional seven item scale
(the Short Warwick Edinburgh Mental Well-Being Scale (SWEMWBS)) was resolved. Many items deleted because of misfit with
model expectations showed considerable bias for gender. Two retained items also demonstrated bias for gender but, at the
scale level, cancelled out. One further retained item 'I've been feeling optimistic about the future' showed bias for age. The
correlation between the 14 item and 7 item versions was 0.954.
Given fit to the Rasch model, and strict unidimensionality, SWEMWBS provides an interval scale estimate of mental well-being.
Conclusion: A short 7 item version of WEMWBS was found to satisfy the strict unidimensionality expectations of the Rasch
model, and be largely free of bias. This scale, SWEMWBS, provides a raw score-interval scale transformation for use in
parametric procedures. In terms of face validity, SWEMWBS presents a more restricted view of mental well-being than the 14
item WEMWBS, with most items representing aspects of psychological and eudemonic well-being, and few covering hedonic
well-being or affect. However, robust measurement properties combined with brevity make SWEMWBS preferable to
WEMWBS at present for monitoring mental well-being in populations. Where face validity is an issue there remain arguments
for continuing to collect data on the full 14 item WEMWBS.
Published: 19 February 2009
Health and Quality of Life Outcomes 2009, 7:15 doi:10.1186/1477-7525-7-15
Received: 8 September 2008
Accepted: 19 February 2009
This article is available from: />© 2009 Stewart-Brown et al; licensee BioMed Central Ltd.
This is an Open Access article distributed under the terms of the Creative Commons Attribution License ( />),
which permits unrestricted use, distribution, and reproduction in any medium, provided the original work is properly cited.
Health and Quality of Life Outcomes 2009, 7:15 />Page 2 of 8
(page number not for citation purposes)
Introduction
There is increasing international interest in the concept of
positive mental health and its contribution to all aspects
of human life [1,2]. The term is often used, in both policy
and academic literature, interchangeably with the term
mental well-being. It is a complex construct, which is gen-
erally accepted as covering both affect and psychological
functioning as well as the overlapping concepts of
hedonic and eudemonic well-being [3]. Positive mental
health is recognised as having major consequences for
health and social outcomes [4,5], and has given rise to
new therapies that explicitly focus on facilitating positive
mental health [6] and to health promotion programmes
which aim to develop mental well-being at community
level. The field of positive mental health is under-
researched partly because of the lack of appropriate meas-
ures [7] and there is demand for instruments suitable for
use with both individuals and populations.
The Warwick-Edinburgh Mental Well-Being Scale
(WEMWBS) was developed to meet this demand [8]. It is
an ordinal scale comprising 14 positively phrased Likert-
style items. Development was undertaken by an expert
panel drawing on the current academic literature, qualita-
tive research with focus groups, and psychometric testing
of an existing scale (the Affectometer 2). The new scale
was validated on student and representative population
samples in the UK using qualitative as well as quantitative
methods and performed well against classic criteria for
scale development [9]. WEMWBS showed good content
validity, moderately high correlations with other mental
health scales and lower correlations with scales measuring
overall health. Its distribution was near normal and did
not show ceiling effects in population samples. It discrim-
inated between population groups in a way that is largely
consistent with the results of other population surveys.
Test-retest reliability at one week was high (0.83). Social
desirability bias was lower than or similar to that of other
comparable scales.
WEMWBS' internal scaling properties were tested using
internal construct validity in the form of confirmatory fac-
tor analysis. Results were consistent with a single underly-
ing construct. Internal consistency reliability was assessed
using Cronbach's Alpha [10], which suggested item
redundancy. In the context of testing scales based on ordi-
nal data, it has been argued that both the latter
approaches are inappropriate, given that factor analysis is
parametric and requires interval scaling, and Cronbach's
Alpha does not address unidimensionality [11-13]
Recently, modern psychometric approaches have been
adopted to provide a more robust interpretation of the
internal construct validity of ordinal scales, the most
widely applied of which is the Rasch Measurement Model
[14]. In this approach, data which include items intended
to be summated into an overall ordinal score for a specific
scale are tested against the expectations of this measure-
ment model. These expectations are a probabilistic form
of Guttman Scaling which operationalises the formal axi-
oms that underpin measurement [15,16]. Other issues
such as category ordering (do the categories of an item
work as expected?) and item bias, or Differential Item
Functioning (DIF) [17] may also be addressed within the
framework of the Rasch model. Finally, when data are
found to fit model expectations a linear transformation of
the raw ordinal score is obtained, opening up valid para-
metric approaches, given appropriate distributions
[18,19].
In this report we assess the internal construct validity of
the 14-item Warwick-Edinburgh Mental Well-being Scale
(WEMWBS) from the perspective of the Rasch Measure-
ment Model using data collected from Wave 12 (Autumn
2006) of the Scottish Health Education Population Survey
(HEPS).
Methods
The Warwick-Edinburgh Mental Well-being Scale
(WEMWBS)
WEMWBS differs from other scales of mental health in
that it covers only positive aspects of mental health and all
14 items are phrased positively (see additional file 1).
Items cover a range of aspects of mental well-being includ-
ing many which will be familiar from other well known
scales (e.g. I've been feeling relaxed, I have been thinking
clearly). Responses in the form of a Likert scale comprise
'None of the time'; 'Rarely'; 'Some of the time'; 'Often' and
'All of the time'. Scores range from 14 to 70, with a higher
score reflecting a higher level of mental well-being.
The Health Education Population Survey (HEPS)
HEPS was a Scottish population survey in which data were
collected on an annual basis in two waves (Spring and
Autumn) from a representative sample of the adult popu-
lation aged 16 to 74. Conducted from 1996 to 2007,
HEPS has subsequently been decommissioned and
replaced by a module in the Scottish Health Survey 2008.
NHS Health Scotland commissioned HEPS and fieldwork
was carried out by BMRB International.
Data for this validation study came from Wave 12
(Autumn 2006) of the survey. Allowing for invalid
addresses, a response rate of 66% was achieved. Interviews
were carried out face to face, in people's homes, using
Computer Assisted Personal Interviewing. In this data set
779 respondents completed all or part of WEMWBS, of
whom 45.8% were male. The average age of respondents
(767 with continuous age information) was 41.9 years
(SD 16.05) and the range 16–74 years. As the Rasch anal-
Health and Quality of Life Outcomes 2009, 7:15 />Page 3 of 8
(page number not for citation purposes)
ysis (see below) bases person estimates upon the informa-
tion that is available, estimates can be given where
missing values are present. However, the precision of the
estimate is reduced to an extent depending on the number
of missing items.
The Rasch model
In satisfying the axioms of conjoint measurement [20],
the Rasch model shows what is expected of responses to
items in a scale if measurement (at the metric level) is to
be achieved. Dichotomous [14] and polytomous versions
of the model are available [21,22]. The model assumes
that the probability of a given respondent affirming an
item is a logistic function of the relative distance between
the item location and the respondent location on a linear
scale. In other words the probability that a person will
affirm an item is a logistic function of the difference
between the person's level of, for example, mental well-
being, and the level of well-being expressed by the item.
The model can be expressed in the form of a logit model:
where ln is the normal log, P is the probability of person
n affirming item i; is the person's level of mental well-
being, and b is the level of mental well-being expressed by
the item.
The process of Rasch analysis is described in detail else-
where [23,24]. Briefly, the analysis is concerned with how
far the observed data match that expected by the model,
using a number of fit statistics. In this paper, three overall
fit statistics are considered. Two are item-person interac-
tion statistics transformed to approximate a z-score, repre-
senting a standardised normal distribution. Therefore if
the items and persons fit the model, a mean of approxi-
mately zero and a standard deviation of 1 would be
expected. A third is an item-trait interaction statistic
reported as a Chi-Square, reflecting the property of invar-
iance across the trait. A significant Chi-Square indicates
that the hierarchical ordering of the items varies across the
trait, so compromising the required property of invari-
ance.
In addition to these overall summary fit statistics, individ-
ual person- and item-fit statistics are presented, both as
residuals (a summation of individual person and item
deviations) and as a Chi Square statistic. In the former
case residuals between ± 2.5 are deemed to indicate ade-
quate fit to the model. To take account of multiple testing
Bonferroni corrections are applied to adjust the Chi-
square p value [25]. The same fit statistics are available to
detect person deviation, as a few respondents significantly
deviating from model expectation may cause significant
misfit at the item level.
The proper ordering of response categories is also evalu-
ated. Failure to follow an expected increase in response
option consistent with an underlying increase in mental
well-being would show disordered thresholds across cate-
gories within an item. The term threshold refers to the
point between two response categories where either
response is equally probable. For a given item the number
of thresholds is always one less than the number of
response options.
Within the framework of Rasch measurement, the scale
should also work in the same way irrespective of which
group (e.g. gender) is being assessed [26]. For example, in
the case of measuring mental well-being, males and
females should have the same probability of affirming an
item (in the dichotomous case), at the same level of mental
well-being. Thus the probability is conditioned on the trait.
If for some reason one gender did not display the same
probability of affirming the item, then this item would be
deemed to display differential item functioning (DIF),
and runs the risk of biasing results. For example, if items
were biased for gender, then gender could not be used as
a predictor variable for mental well-being, as the measure-
ment of mental well-being would be confounded by gen-
der bias. It is important to note that the detection of and,
if necessary, the adjustment for DIF, does not remove the
effect of gender, but rather ensures that there is no gender
bias in the scale so that the effect of gender can be properly
understood. In practice adjustments for such bias can be
made post-hoc in most circumstances, but items display-
ing DIF would be prime candidates for removal in any
scale revision [27]. Sometimes bias may cancel out in the
test, for example, one item may favour males, another
females, and their effects may be nullified [28]. In the cur-
rent analysis, DIF was tested for age, gender, and the pres-
ence or not of a long-standing illness.
Strict tests of unidimensionality are undertaken at every
stage of analysis [29]. A Principal Component Analysis
(PCA) of the residuals is undertaken, the standardised
person-item differences between the observed data and
what is expected by the model for every person's response
to every item. After extracting the 'Rasch factor' there
should be no further pattern in the data. This is formally
tested by allowing the factor loadings on the first residual
component to determine 'subsets' of items and then test-
ing, by an independent t-test to see if the person estimate
(the logit of person 'ability' or, in this case 'mental well-
being') derived from these subsets significantly differ from
each other [29,30]. If more than 5% of independent t-tests
are found to be significant, allowing for a Binomial confi-
ln
P
ni
P
ni
b
ni
1−
⎛
⎝
⎜
⎞
⎠
⎟
=−
q
Health and Quality of Life Outcomes 2009, 7:15 />Page 4 of 8
(page number not for citation purposes)
dence interval for a proportion, this would indicate a
breach of the assumption of unidimensionality.
An estimate of the internal consistency reliability of the
scale is also available, based on the Person Separation
Index (PSI) where the estimates on the logit scale for each
person are used to calculate reliability. This is equivalent
to Cronbach's Alpha [10].
In order to obtain robust estimates of the internal con-
struct validity of the scale, the total data set is randomised
into two further sets of approximately 50% of cases. Final
results concerning the validity of the scale should be
robust over the full data set, and each random sample.
The Rasch analysis was undertaken with the RUMM2020
software package [31].
Results
The 779 cases initially displayed no floor or ceiling effects,
and thus all were entered into the analysis. The log Likeli-
hood test Chi Square was 143.75 (df 38) with a probabil-
ity < 0.0001, indicating that the partial credit version of
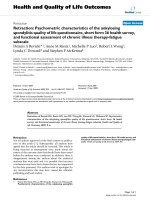
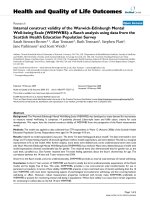
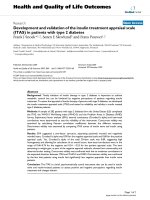
the Rasch model was appropriate. All thresholds were
found to be ordered (Figure 1). That is, within each item,
the transition from one category to the next represents an
increase in the underlying trait of mental well-being.
Initial fit to model expectations was poor (Table 1 – Anal-
ysis 1). The items 'I've been feeling good about myself',
'I've been interested in new things' and 'I've been feeling
cheerful' all showed significant misfit to model expecta-
tions, and were deleted. This led to a marginal improve-
ment in fit (Analysis 2). A further two items 'I've been
feeling interested in other people' and 'I've had energy to
spare' were deleted, resulting in further improvement
(Analysis 3).
Local dependency was then observed for two more items
and, after further analysis, a strict unidimensional seven
item scale was resolved (Analysis 4), comprising:
Item 1 – I've been feeling optimistic about the future
Item 2 – I've been feeling useful
Item 3 – I've been feeling relaxed
Item 6 – I've been dealing with problems well
Item 7 – I've been thinking clearly
Item 9 – I've been feeling close to other people
Item 11 – I've been able to make up my own mind about
things
We have named this shortened scale SWEMWBS (Short
Warwick-Edinburgh Mental Well-being Scale) (see addi-
tional file 2).
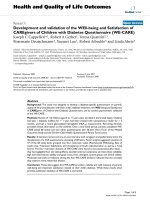
Five out of the seven items discarded showed significant
DIF for gender (Table 2). For example, the item 'I've been
feeling confident' (item 10) showed that, at any level of
mental well-being, males were more likely to report a
higher score than females (Figure 2).
In the final seven item scale two items also showed DIF for
gender, but these were found to cancel out at the test level,
and fit improved further (Analysis 5). One further item
(item 1) 'I've been feeling optimistic about the future' still
displayed marginal DIF for age. None of the items in the
14 item WEMWBS showed DIF by the presence or absence
of a long-standing condition. As might be expected with a
shorter scale, the level of reliability had fallen from 0.906
(Analysis 1) to 0.845 (Analysis 5), although the original
14 item version is compromised by multidimensionality
caused by gender bias.
Given satisfactory fit to the Rasch model for the seven
item scale, and confirmation of strict unidimensionality,
the robustness of the solution (analysis 5) was tested on
the two random samples embedded within the data
(Analyses 6 & 7). Both subsets of data showed good fit to
model expectations. A linear transformation of the raw
score, based upon the seven valid items, was then made.
The raw score-logit transformation is given in Table 3. The
Spearman's correlation between the raw scores of
WEMWBS and SWEMWBS was 0.954.
Finally, given the disturbance in model fit brought about
by bias associated with gender, the data from the full 14
item scale was fitted to the Rasch model independently for
Threshold map for the 14 item scaleFigure 1
Threshold map for the 14 item scale. (See additional file
1 for full text of items).
Where 0= None of the time; 1= Rarely; 2= Some of the time; 3=Often and 4=
All of the time.
Health and Quality of Life Outcomes 2009, 7:15 />Page 5 of 8
(page number not for citation purposes)
each gender. Neither the males (Analysis 8) nor the
females (Analysis 9) demonstrated fit to model expecta-
tions, suggesting that the disturbance to the scale was
more than just gender DIF.
Discussion
Increasingly, scales used for measuring health and medi-
cal outcomes are being developed to meet the strict crite-
ria associated with additive conjoint measurement as
operationalised through the Rasch measurement model
[14,20]. Providing a scientific basis for the construction of
linear measurement this approach is now widely used in
the health and social sciences [32,33]. It remains true,
however, that the majority of scales commonly used to
measure mental health in trials and population surveys
have not been shown to meet these strict criteria.
Our analysis has shown that seven of the original 14 items
of WEMWBS, which we have called SWEMWBS (Short
Warwick-Edinburgh Mental Well-being Scale), conform
to Rasch model expectations and provide a valid raw score
– interval level transformation with a correlation of 0.954
to the full scale. Furthermore, SWEMWBS has been shown
to be largely free of item bias, and that its polytomous
response structure works as intended, with higher scores
within an item reflecting greater overall mental well-
being.
Table 1: Fit of data to the Rasch model.
Item Person Chi Square Interaction PSI Unidimensional
t-tests (Confidence intervals)
Analysis
μ
Mean SD Mean SD Value
(df)
p
1 0.102 3.111 -0.533 1.730 312.1
(126)
0.000 0.906 11.68%
(10–13%)
2 0.102 2.084 -0.504 1.555 178.9
(99)
0.000 0.879 9.15%
(8–11%)
3 0.143 1.580 -0.491 1.448 114.2
(85)
0.009 0.872 7.03%
(6–9%)
4 0.080 1.794 -0.472 1.295 87.19
(63)
0.023 0.840 4.17%*
5 0.065 1.341 -0.475 1.222 64.70
(54)
0.151 0.845 4.18%*
6 0.126 0.681 -0.472 1.223 41.1
(54)
0.901 0.837 4.77%*
7 0.113 1.436 -0.437 1.194 56.5
(54)
0.382 0.854 5.15%
(3–7%)
8 0.078 2.036 -0.540 1.743 208.7
(126)
0.000 0.903 11.77%
(10–13%)
9 0.262 2.372 -0.472 1.656 233.3
(126)
0.000 0.910 10.67%
(9–12%)
* Confidence intervals not relevant where values are <5%
μ
Key to analysis
1 14 items
2 11 items
3 9 items
4 7 items
5 7 items DIF cancelled
6 Analysis 5 tested on sample 1
7 Analysis 5 tested on sample 2
8 14 items males
9 14 items females
Health and Quality of Life Outcomes 2009, 7:15 />Page 6 of 8
(page number not for citation purposes)
Although confirmatory factor analysis (not shown) had
indicated that WEMWBS was consistent with a single
underlying factor [8] the scale did not meet the criteria
required of the Rasch model. Most of the seven items
excluded showed bias for gender. Perhaps because of this
DIF (which can be a cause of multidimensionality), it was
not possible to construct a second meaningful scale from
the seven deleted items. Separate analyses of the 14 item
set by gender showed lack of fit to model expectations on
both occasions, suggesting an underlying problem over
and above the disturbance caused by gender DIF. In order
to satisfy the rules for constructing interval scaling, the
Rasch model imposes the strictest measurement criteria
and. WEMWBS lack of fit to model expectations may have
arisen either because of dimensionality issues, or because
of the additional requirements for interval scale measure-
ment over and above that required for ordinal scales.
WEMWBS was developed, in part, to support the evalua-
tion of mental well-being programmes. The latter involve
a component of education about the nature of mental
well-being, which for many members of the public is a
new concept. For this reason it was considered important
that WEMWBS presented a full picture of mental well-
being including items relating to the majority of aspects
proposed in the academic literature. Face validity studies
with the general public and its popularity with those prac-
ticing mental health promotion and public mental health
in the UK suggest that WEMWBS met this goal.
In terms of face validity, the 7 item scale (SWEMWBS)
presents a more restricted view of mental well-being than
the 14 item scale (WEMWBS), with most items represent-
ing aspects of psychological and eudemonic well-being,
and few covering hedonic well-being or affect. In terms of
measurement properties, however, the 7 item scale
(SWEMWBS) was robust to Rasch model expectations,
whereas the original 14 item scale (WEMWBS) was not.
The lack of measurement validity shown by half the items
in the original 14 item scale may be attributable to current
levels of knowledge and self-awareness relating to mental
well-being among the general public resulting in
responses which are not robust. As knowledge and self
awareness increase this situation may change.
Given that SWEMWBS is embedded within the larger
WEMWBS, it may be appropriate to continue to collect
data on the full 14 items to further investigate dimension-
ality and gender bias in different samples. It would also
allow for comparison, at the ordinal level, with earlier
studies. However, our results clearly indicate that the 7
item scale is preferable to the 14 item scale where robust
interval scale measurement is important, and respondent
burden is an issue. To facilitate this, we have been able to
provide a raw-score to interval scale transformation of the
Table 2: Differential Item functioning for gender
Item Main Effect for Gender Gender-Trait Interaction
Males Females DF Prob Males Females DF Prob
1 0.04015 0.04142 1 0.838742 1.09147 1.12607 9 0.341345
2 1.97595 2.14194 1 0.143738 1.00945 1.09425 9 0.364425
3 8.80378 9.87322 1 0.001733 0.30942 0.34701 9 0.958872
4 33.40524 30.25532 1 0.000016 0.91752 0.831 9 0.587624
5 13.15898 12.5703 1 0.000431 1.95187 1.86455 9 0.054061
6 1.64136 1.94816 1 0.163188 0.74287 0.88173 9 0.541148
7 3.22218 3.97158 1 0.046619 1.51676 1.86952 9 0.053306
8 8.52653 12.92955 1 0.000355 0.47544 0.72096 9 0.689971
9 20.25451 21.9388 1 0.000019 0.1508 0.16334 9 0.997325
10 20.48471 26.80281 1 0.000000 0.03225 0.0422 9 0.999991
11 0.3434 0.3741 1 0.540959 0.93481 1.01839 9 0.423315
12 16.02162 14.70792 1 0.000147 0.41747 0.38324 9 0.943387
13 1.4163 1.16839 1 0.280081 1.29212 1.06595 9 0.385782
14 0.39479 0.59179 1 0.441960 0.79332 1.18918 9 0.298521
Emboldened probabilities show significant DIF. Shaded items are those that were deleted.
Item numbers correspond to the order of items in WEMWBS (additional file 1)
Differential Item Functioning by Gender for the item 'I've been feeling confident'Figure 2
Differential Item Functioning by Gender for the item
'I've been feeling confident'.
Health and Quality of Life Outcomes 2009, 7:15 />Page 7 of 8
(page number not for citation purposes)
7 item scale for use when change scores and other para-
metric procedures are required.
Conclusion
Although providing a broader view of mental well-being
than the shortened version (SWEMWBS), WEMWBS does
not meet the strict criteria for measurement demanded by
the RASCH model, demonstrating DIF and multidimen-
sionality. The shortened scale, comprised of 7 items
(SWEMWBS), satisfied all criteria, including strict unidi-
mensionality. A linear transformation of the raw score
from SWEMWBS (Table 3) can be used with confidence in
parametric analyses, given appropriate distribution.
Responses to mental well-being scales may change as
knowledge and self-awareness increase at population
level. There are, therefore, arguments for continuing to
gather data on the 14 item scale (given the seven item
scale is embedded) to examine measurement of mental
well-being at the ordinal level, to explore item bias in dif-
ferent samples, and to further analyse potential dimen-
sionality.
Competing interests
This research was commissioned by NHS Health Scotland.
Authors' contributions
SSB conceived of the study, supported the study design,
coordinated the development of the instrument and
drafted the manuscript. AT carried out all the statistical
analyses and produced the first draft of the manuscript. RT
designed and coordinated the study. SP participated in the
design and coordination of the study, and helped to draft
the manuscript. JP commissioned the study, participated
in its coordination and helped to draft the manuscript.
SW participated in the coordination of the study and
helped to draft the manuscript.
Additional material
Acknowledgements
NHS Health Scotland commissioned the HEPS which was carried out by
BMRB International. Ruth Fishwick played an important role in the devel-
opment and validation of the WEMWBS, a project which was supported by
Additional file 1
WEMWBS. Warwick-Edinburgh Mental Well-being Scale.
Click here for file
[ />7525-7-15-S1.doc]
Additional file 2
SEMWBS. The Short Warwick-Edinburgh Mental Well-being Scale.
Click here for file
[ />7525-7-15-S2.doc]
Table 3: Raw score to metric score conversion table for
SWEMWBS.
Raw Score Metric Score
77.00
89.51
911.25
10 12.40
11 13.33
12 14.08
13 14.75
14 15.32
15 15.84
16 16.36
17 16.88
18 17.43
19 17.98
20 18.59
21 19.25
22 19.98
23 20.73
24 21.54
25 22.35
26 23.21
27 24.11
28 25.03
29 26.02
30 27.03
31 28.13
32 29.31
33 30.70
34 32.55
35 35.00
Publish with BioMed Central and every
scientist can read your work free of charge
"BioMed Central will be the most significant development for
disseminating the results of biomedical research in our lifetime."
Sir Paul Nurse, Cancer Research UK
Your research papers will be:
available free of charge to the entire biomedical community
peer reviewed and published immediately upon acceptance
cited in PubMed and archived on PubMed Central
yours — you keep the copyright
Submit your manuscript here:
/>BioMedcentral
Health and Quality of Life Outcomes 2009, 7:15 />Page 8 of 8
(page number not for citation purposes)
Stephen Joseph and guided by an Expert Panel comprised of Jenny Secker,
Glyn Lewis, Stephen Stansfeld, in addition to SS-B, RT, SP, JP and SW. We
are very grateful to all those who have contributed in this way.
References
1. World Health Organisation: Promoting Mental Health; Con-
cepts emerging evidence and practice. In Summary report
Geneva; World Health Organisation; 2004.
2. World Health Organisation: Strengthening mental health pro-
motion. Geneva; World Health Organisation; 2001.
3. Ryan RM, Deci EL: On happiness and human potential: a review
of research on hedonic and eudaimonic well-being. Annual
Review Psychology 2001, 52:141-166.
4. Huppert FA, Wittington JE: Positive mental health in individuals
and populations. In The Science of Well-being Edited by: Huppert FA,
Baylis N. Keverne Oxford: Oxford University Press; 2004:307-340.
5. Linley PA, Joseph S, Eds: Positive psychology in practice. Hobo-
ken, NJ: Wiley; 2004.
6. Joseph S, Linley PA: Positive therapy: a meta-theory for posi-
tive psychological practice. Routledge 2006.
7. Hu Y, Stewart-Brown S, Twigg L, Weich S: Can the 12 item Gen-
eral Health Questionnaire be used to measure positive men-
tal health? Psychological Medicine 2007, 37(7):1005-13.
8. Tennant Ruth, Hiller Louise, Fishwick Ruth, Platt Stephen, Joseph
Stephen, Weich Scott, Parkinson Jane, Secker Jenny, Sarah Stewart-
Brown: The Warwick-Edinburgh Mental Well-being Scale
(WEMWBS): development and UK validation. Health and
Quality of Life Outcomes 2007, 5:63.
9. Nunally JC: Psychometric theory. New York: McGraw-Hill; 1978.
10. Cronbach LJ: Coefficient alpha and the internal structure of
tests. Psychometrika 1951, 16:297-334.
11. Green SB, Lissitz RW, Mulaik SA: Limitations of coefficient alpha
as an index of test unidimensionality. Educational and Psycholog-
ical Measurements 1977, 37:827-838.
12. McDonald RP, Ahlawat KS: Difficulty factors in binary data. Brit-
ish Journal of Mathematical and Statistical Psychology 1974, 27:82-99.
13. Pallant JF: SPSS Survival Manual. Second edition. Maidenhead:
Open University Press; 2005.
14. Rasch G: Probabilistic models for some intelligence and
attainment tests. Chicago: University of Chicago Press; 1960.
15. Guttman LA: The basis for Scalogram analysis. In
Studies in social
psychology in World War II: Measurement and Prediction Volume 4. Edited
by: Stouffer SA, Guttman LA, Suchman FA, Lazarsfeld PF, Star SA,
Clausen JA. Princeton: Princeton University Press; 1950:60-90.
16. Karabatos G: The Rasch model, additive conjoint measure-
ment, and new models of probabilistic measurement theory.
Journal of Applied Measurement 2001, 2:389-423.
17. Teresi JA, Kleinman M, Ocepek-Welikson K: Modern psychomet-
ric methods for detection of differential item functioning:
application to cognitive assessment measures. Statistical Med-
icine 2000, 19:1651-83.
18. Wright BD, Stone G: Best test design. Chicago: MESA Press; 1979.
19. Svensson E: Guidelines to statistical evaluation of data from
rating scales and questionnaires. Journal of Rehabilitation Medicine
2001, 33:47-48.
20. Luce RD, Tukey JW: Simultaneous conjoint measurement: A
new type of fundamental measurement. Journal of Mathematical
Psychology 1964, 1:1-27.
21. Andrich D: Rating formulation for ordered response catego-
ries. Psychometrika 1978, 43:561-573.
22. Masters G: Rasch model for partial credit scoring. Psychometrika
1982, 47:149-174.
23. Pallant JF, Tennant A: An introduction to the Rasch measure-
ment model: An example using the Hospital Anxiety and
Depression Scale (HADS). British Journal of Clinical Psychology
2007, 46:1-18.
24. Tennant A, Conaghan PG: The Rasch Measurement Model in
Rheumatology: What is it and why use it? When should it be
applied, and what should one look for in a Rasch paper? Arthri-
tis Rheumatism 2007, 57:1358-1362.
25. Bland JM, Altman DG: Multiple significance tests: the Bonfer-
roni method. British Medical Journal 1995, 310:170.
26. Holland PW, Wainer H: Differential Item Functioning. In Hills-
dale New Jersey: Lawrence Erlbaum; 1993.
27. Tennant A, Penta M, Tesio L, Grimby G, Thonnard J-L, Slade A, Law-
ton G, Simone A, Carter J, Lundgren-Nilsson A, Tripolski M, Ring H,
Biering-Sørensen F, Marincek C, Burger H, Phillips S: Assessing and
adjusting for cross cultural validity of impairment and activ-
ity limitation scales through Differential Item Functioning
within the framework of the Rasch model: the Pro-ESOR
project. Medical Care 2004, 42:37-48.
28. Tennant A, Pallant JF: DIF matters: A practical approach to test
if Differential Item Functioning (DIF) makes a difference.
Rasch Measurement Transactions 2007, 20:1082-1084.
29. Smith EV: Detecting and evaluation the impact of multidimen-
sionality using tem fit statistics and principal component
analysis of residuals. Journal of Applied Measurement 2002,
3:205-231.
30. Tennant A, Pallant JF: Multidimensionality matters. Rasch Meas-
urement Transactions 2006, 20:1048-1051.
31. Andrich D, Lyne A, Sheridon B, Luo G: RUMM 2020. Perth: RUMM
Laboratory; 2003.
32. Keenan A-M, Redmond A, Horton M, Conaghan P, Tennant A: The
Foot Posture Index: Rasch analysis of a novel, foot specific
outcome measure. Archives Physical Medicine and Rehabilitation
2007, 88:88-93.
33. Kyriakides L, Kaloyirou C, Lindsay G: An analysis of the Revised
Olweus Bully/Victim Questionnaire using the Rasch meas-
urement model. British Journal of Educational Psychology 2006,
76(4):781-801.