Chapter 3: Financial Audit DEPARTMENT OF HEALTH STATE OF HAWAII Reconciliation of the Governmental potx
Bạn đang xem bản rút gọn của tài liệu. Xem và tải ngay bản đầy đủ của tài liệu tại đây (164.19 KB, 10 trang )
43
Chapter 3: Financial Audit
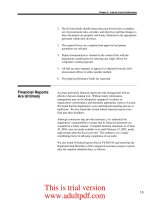
Exhibit 3.4
Total fund balances – governmental funds $ 104,327,582
Amounts reported for governmental activities in the statement of net assets are
diff
erent
b
ecause:
Capital assets used in governmental activities are not financial resources and
therefore not reported in the governmental funds. 72,889,696
Accrued vacation reported in the statement of net assets do not require
the use of current financial resources and therefore are not reported
as
li
a
bili
t
i
es
i
n t
h
e governmenta
l
f
un
d
s.
(
18,503,619
)
Workers’ compensation liability reported in the statement of net assets does not
requ
i
re t
h
e use o
f
current
fi
nanc
i
a
l
resources an
d
t
h
ere
f
ore
i
s not reporte
d
as a
li
a
bili
t
i
es
i
n t
h
e governmenta
l
f
un
d
s
(
634,373
)
Net assets of governmental activities $ 158,079,286
See accompanying notes to basic financial statements.
June 30, 2003
DEPARTMENT OF HEALTH
STATE OF HAWAII
Reconciliation of the Governmental Fund Balances to the
Statement of Net Assets
This is trial version
www.adultpdf.com
44
Chapter 3: Financial Audit
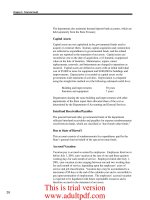
Exhibit 3.5
Other Total
Tobacco Governmental Governmental
General Settlement Funds Funds
Revenues:
S
tate genera
l
f
un
d
a
ll
otments, net
$
311
,7
43
,5
98
$
—
$
5,7
41
,7
3
7
$
31
7,
48
5,
33
5
Intergovernmenta
l
— — 84,623,804 84,623,804
To
b
acco sett
l
ement — 43,523,519 — 43,523,519
Non
i
mpose
d
emp
l
oyee
f
r
i
nge
b
ene
fi
ts
(
Note 1
)
30,535,685 — — 30,535,685
Taxes,
f
ees,
fi
nes, an
d
ot
h
er — — 16,886,968 16,886,968
Interest
i
ncome — 869,904 949,333 1,819,237
Total revenues 342,279,283 44,393,423 108,201,842 494,874,548
Expenditures:
Genera
l
a
d
m
i
n
i
strat
i
on 17,649,885 — 6,971,885 24,621,770
Env
i
ronmenta
l
h
ea
l
t
h
20,035,354 — 14,398,930 34,434,284
Be
h
av
i
ora
l
h
ea
l
t
h
serv
i
ces 172,815,777 — 17,792,185 190,607,962
Hea
l
t
h
resources 154,713,111 32,207,043 62,323,666 249,243,820
Total expenditures 365,214,127 32,207,043 101,486,666 498,907,836
Excess (deficiency) of revenues
over expen
di
tures
(
22,934,844
)
12,186,380 6,715,176
(
4,033,288
)
Other financing sources (uses):
Trans
f
ers
i
n
(
Note 8
)
— — 6,682,711 6,682,711
Trans
f
ers out
(
Note 8
)
—
(
18,722,949
)
(
9,799,541
)
(
28,522,490
)
Total other financing uses — (18,722,949) (3,116,830) (21,839,779)
Net change in fund balances (22,934,844) (6,536,569) 3,598,346 (25,873,067)
Fund balances at July 1, 2002 58,352,503 33,813,621 38,034,525 130,200,649
Fund balances at June 30, 2003 $ 35,417,659 $ 27,277,052 $ 41,632,871 $ 104,327,582
See accompanying notes to basic financial statements.
DEPARTMENT OF HEALTH
STATE OF HAWAII
Statement of Revenues, Expenditures, and Changes in Fund Balances - Governmental Funds
Year Ended June 30, 2003
This is trial version
www.adultpdf.com
45
Chapter 3: Financial Audit
Exhibit 3.6
Net change in fund balances – total governmental funds $ (25,873,067)
Amounts reported for governmental activities in the statement of activities
are different because:
Governmental funds report capital outlays as expenditures. However, in the
statement of activities the cost of those assets is allocated over their
estimated useful lives and reported as depreciation expense. This is the amount
b
y which depreciation exceeded capital outlays for the year. (3,693,038)
Accrued vacation reported in the statement of activities do not require the use
of current financial resources and therefore are not reported as expenditures
i
n t
h
e governmenta
l
f
un
d
s unt
il
d
ue an
d
paya
bl
e.
(
651,566
)
Workers’ compensation liability reported in the statement of activities do not
require the use of current financial resources and therefore are not reported
as expenditures in the governmental funds until due and payable. (634,373)
Change in net assets of governmental activities $ (30,852,044)
See accompanying notes to basic financial statements.
to the Statement of Activities
Year Ended June 30, 2003
DEPARTMENT OF HEALTH
STATE OF HAWAII
Reconciliation of the Statement of Revenues, Expenditures,
and Changes in Fund Balances of Governmental Funds
This is trial version
www.adultpdf.com
46
Chapter 3: Financial Audit
Exh
i
b
i
t
3
.7
Water Pollution Drinking Water
C
ontrol Treatment
Revolvin
g
Revolvin
g
Fund Loan Fund Total
Current assets:
Cas
h
an
d
cas
h
equ
i
va
l
ents
i
n state treasury
$
89,528,990
$
10,673,735
$
100,202,725
Loan fees receivable 566,544 74,030 640,574
Accrued interest receivable (Note 3) 1,588,748 32,365 1,621,113
Due
f
rom ot
h
er
f
un
d
s — 395,000 395,000
Due
f
rom
f
e
d
era
l
government 400,076 451,441 851,517
Current portion of loans receivable (Note 3) 10,659,371 573,652 11,233,023
Total current assets 102,743,729 12,200,223 114,943,952
Loans receivable, net of current portion (Note 3) 151,795,915 10,650,538 162,446,453
Cap
i
ta
l
assets, net
(
Note 4
)
19,961 331,588 351,549
Total assets 254,559,605 23,182,349 277,741,954
Liabilities:
Current
li
a
bili
t
i
es:
Accrued payroll and other 41,343 7,739 49,082
Total liabilities 41,343 7,739 49,082
Net assets:
Investe
d
i
n cap
i
ta
l
assets 19,961 331,588 351,549
Restricted for loans 254,498,301 22,843,022 277,341,323
Total net assets $ 254,518,262 $ 23,174,610 $ 277,692,872
See accompanying notes to basic financial statements.
Assets (Restricted)
Liabilities and Net Assets
DEPARTMENT OF HEALTH
STATE OF HAWAII
Statement of Net Assets – Proprietary Funds
June 30, 2003
This is trial version
www.adultpdf.com
47
Chapter 3: Financial Audit
Exhibit 3.8
Water Pollution Drinking Water
Control Treatment
Revolv
i
n
g
Revolv
i
n
g
Fund Loan Fund Total
Operating revenues:
Interest income from loans
$
3,956,751
$
158,727
$
4,115,478
Administration loan fees 1,451,773 371,478 1,823,251
Total operating revenues 5,408,524 530,205 5,938,729
Operating expenses:
Administrative 1,202,434 272,850 1,475,284
State program management — 208,956 208,956
Small systems — 1,858 1,858
Water protect
i
on — 342,577 342,577
Total operating expenses 1,202,434 826,241 2,028,675
Operating income (loss) 4,206,090 (296,036) 3,910,054
Nonoperating revenues:
Interest income from investments 2,535,929 239,321 2,775,250
Fe
d
era
l
contr
ib
ut
i
on 4,428,893 3,105,208 7,534,101
Othe
r
685 320 1,005
Total nonoperating revenues 6,965,507 3,344,849 10,310,356
Income before transfers in 11,171,597 3,048,813 14,220,410
Transfers in (Note 8) 2,094,000 1,551,000 3,645,000
Change in fund net assets 13,265,597 4,599,813 17,865,410
Net assets at July 1, 2002 241,252,665 18,574,797 259,827,462
Net assets at June 30, 2003 $ 254,518,262 $ 23,174,610 $ 277,692,872
See accompanying notes to basic financial statements.
DEPARTMENT OF HEALTH
STATE OF HAWAII
Statement of Revenues, Expenses, and Changes in Fund Net Assets –
Year Ended June 30, 2003
Proprietary Funds
This is trial version
www.adultpdf.com
48
Chapter 3: Financial Audit
Exhibit 3.9
Water Pollution Drinking Water
Control Treatment
Revolving Revolving
Fund Loan Fund Total
Cash flows from operating activities:
Interest income from loans $ 3,865,871 $ 143,010 $ 4,008,881
Administrative loan fees 1,387,937 309,791 1,697,728
Principal repayments on loans 9,687,830 473,601 10,161,431
Disbursement of loan proceeds (11,279,754) (2,202,868) (13,482,622)
Payments to employees (837,081) (228,813) (1,065,894)
Payments to vendors (345,779) (535,179) (880,958)
Net cash flows provided by (used in)
operating activities 2,479,024 (2,040,458) 438,566
Cash flows from noncapital financing activities:
Federal contributions 4,028,817 3,182,157 7,210,974
State contributions 2,094,000 1,551,000 3,645,000
Payments to others — (255,013) (255,013)
Net cash flows provided by noncapital
financing activities 6,122,817 4,478,144 10,600,961
Cash flows used in capital and related financing activities:
Purchase of equipment (26,002) (153,741) (179,743)
Cash flows provided by investing activities:
Interest from investments 3,016,363 285,281 3,301,644
Net increase in cash and cash equivalents 11,592,202 2,569,226 14,161,428
Cash and cash equivalents at July 1, 2002 77,936,788 8,104,509 86,041,297
Cash and cash equivalents at June 30, 2003 $ 89,528,990 $ 10,673,735 $ 100,202,725
Reconciliation of operating income (loss) to net cash
p
rovided by (used in) operating activities:
Operating income (loss) $ 4,206,090 $ (296,036) $ 3,910,054
Adjustments to reconcile operating income (loss)
to net cash provided by (used in) operating activities:
Depreciation expense 11,294 62,140 73,434
Change in assets and liabilities:
Loans receivable (1,591,924) (1,729,267) (3,321,191)
Accrued interest on loans receivable (90,880) (15,716) (106,596)
Loan fees receivable (63,836) (61,688) (125,524)
Accrued wages and other 8,280 109 8,389
Net cash provided by (used in)
operating activities $ 2,479,024
$
(2,040,458)
$
438,566
See accompanying notes to basic financial statements.
DEPARTMENT OF HEALTH
STATE OF HAWAII
Statement of Cash Flows – Proprietary Funds
Year Ended June 30, 2003
This is trial version
www.adultpdf.com
49
Chapter 3: Financial Audit
Exhibit 3.10
Agency Fund
Cash and cash equivalents – on deposit with banks and on hand (Note 1) $ 311,900
Total assets $ 311,900
Due to others $ 311,900
Total liabilities $ 311,900
See accompanying notes to basic financial statements.
Liabilities
June 30, 2003
DEPARTMENT OF HEALTH
STATE OF HAWAII
Statement of Fiduciary Net Assets – Fiduciary Funds
Assets
This is trial version
www.adultpdf.com
50
Chapter 3: Financial Audit
Exhibit 3.11
Actual
Amounts
(Budgetary
Basis)
Original Final (See Note 1)
Revenues:
Current year appropr
i
at
i
ons
$
359,446,015
$
333,635,487
$
318,588,629
Expenditures:
Genera
l
a
d
m
i
n
i
strat
i
on 14,703,672 10,165,058 15,326,591
Env
i
ronmenta
l
h
ea
l
t
h
a
d
m
i
n
i
strat
i
on 14,732,549 16,678,377 15,956,453
Be
h
av
i
ora
l
h
ea
l
t
h
serv
i
ces a
d
m
i
n
i
strat
i
on 185,308,130 157,162,375 146,092,801
Hea
l
t
h
resources a
d
m
i
n
i
strat
i
on 144,701,664 149,629,677 141,212,784
Total expenditures 359,446,015 333,635,487 318,588,629
Excess of revenues over
expen
di
tures
$
—
$
—
$
—
See accompanying independent auditors’ report and note to the budgetary comparison schedules.
Year Ended June 30, 2003
Budgeted Amounts
DEPARTMENT OF HEALTH
STATE OF HAWAII
Budgetary Comparison Schedule – General Fund
Required Supplementary Information (Unaudited)
This is trial version
www.adultpdf.com
51
Chapter 3: Financial Audit
Exhibit 3.12
Actual
Amounts
(Bud
g
etar
y
Basis)
Ori
g
inal Final (See Note 1)
Revenues:
Tobacco settlement funds received
$
50,342,603
$
50,342,603
$
44,568,461
Expenditures:
Hea
l
t
h
resources a
d
m
i
n
i
strat
i
on 50,342,603 50,342,603 43,725,075
Excess of revenues over
expenditures
$
—
$
—
$
843,386
See accompanying independent auditors’ report and note to the budgetary comparison schedules.
Year Ended June 30, 2003
Bud
g
eted Amounts
DEPARTMENT OF HEALTH
STATE OF HAWAII
Budgetary Comparison Schedule – Tobacco Settlement Fund
Required Supplementary Information (Unaudited)
This is trial version
www.adultpdf.com
52
Chapter 3: Financial Audit
Exhibit 3.13
(1) Budget to GAAP Reconciliation
Tobacco
General Settlement
Fund Fund
Excess of revenues over expenditures – actual
on a
b
u
d
getary
b
as
i
s
$
—
$
843,386
Reserve for encumbrances at year-end 39,492,554 10,455,938
Expenditures for liquidation of prior year’s encumbrances (64,765,923) (11,768,087)
Accrual and other adjustments 2,338,525 12,655,143
Excess (deficiency) of revenues over
expenditures – GAAP basis $ (22,934,844) $ 12,186,380
The following reconciles the excess of revenues over expenditures presented on a budgetary basis to the
excess (deficiency) of revenues over expenditures presented in conformity with GAAP for the general
and tobacco settlement funds.
Year Ended June 30, 2003
DEPARTMENT OF HEALTH
STATE OF HAWAII
Note to the Budgetary Comparison Schedules
This is trial version
www.adultpdf.com