Legislative Audit Division State of Montana Report to the Legislature December 2004 Financial_part2 pot
Bạn đang xem bản rút gọn của tài liệu. Xem và tải ngay bản đầy đủ của tài liệu tại đây (79.11 KB, 10 trang )
Montana State University
(a component unit of the State of Montana)
Management’s Discussion and Analysis
As of and For Each of the Two Years Ended June 30, 2004 (continued)
A - 4
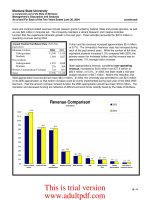
Grant and contract-related revenues include research grants funded by Federal, State and private sponsors, as well
as over $22 million in financial aid. The University maintains a vibrant Research and Creative Activities
function that has experienced dramatic growth in the past year. These activities accounted for $97.5 million in
operating revenues during 2004.
Tuition and fee revenues increased approximately $5.4 million,
or 6.7%. The University’s freshman class has increased during
each of the past several years. While the number of full-time
equivalent students increased 1.3% compared with 2003, the
primary reason for increased tuition and fee revenue was an
approximate 11% average tuition increase.
State appropriations revenue, considered non-operating
revenue, increased by $4.8 million from $77.6 million to
$82.4 million, or 6.2%. In 2003, the State made a mid-year
budget reduction of $6.7 million. Absent this reduction, the
2003 appropriation level would have been $84.3 million. In 2004, the University was permitted to use $2.5 million
of its 2005 appropriation so that tuition increases could be evenly implemented during each year of the 2004-2005
biennium. Had this amount not been forward-funded, the 2004 appropriation would have been $79.9 million. The
rescission and decreased funding are reflective of difficult economic times recently faced by the State of Montana.
Revenue Comparison
(in millions)
111.0
79.5
77.6
28.1
18.2
12.9
9.6
5.6
2.7
119.8
84.9
82.4
29.4
18.9
7.9
10.0
4.6
3.3
$0
$10
$20
$30
$40
$50
$60
$70
$80
$90
$100
$110
$120
Grant & Contract
Activity
Tuition and Fees State
Appropriations
Auxiliary Services Other Revenues Gifts Capital Grants &
Gifts
Federal
Appropriations
Land Grant &
Investment Income
2003
2004
Annual Student Enrollment Data (Full Time
Equivalent)
Montana residents
2004
2003
Undergraduate 13,380 13,130
Graduate
1,044 1,027
Non-residents
Undergraduate 1,932 2,048
Graduate
276 269
Western Undergraduate Exchange 724 661
Total 17,356 17,135
This is trial version
www.adultpdf.com
Montana State University
(a component unit of the State of Montana)
Management’s Discussion and Analysis
As of and For Each of the Two Years Ended June 30, 2004 (continued)
A - 5
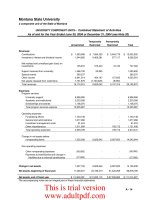
During 2004, revenues were derived as follows:
Revenues by Source
Tuition and Fees
24%
Grant & Contract
Activity
33%
State Appropriations
23%
Gifts
2%
Federal
Appropriations
1%
Land Grant &
Investment Income
1%
Capital Grants & Gifts
3%
Other Revenues
5%
Auxiliary Services
8%
Expenses were incurred as follows:
Expenses by Category
Compens ation
46%
Benefits
12%
Contracted Services
9%
Other Expenses
13%
Supplies
7%
Depreciation
6%
Financial Aid
4%
Maintenance
3%
(in millions)
Source Amount
Grant & Contract Activity $ 119.8
Tuition and Fees 84.9
State Appropriations 82.4
Auxiliary Services 29.4
Other Revenues 18.9
Gifts 7.9
Capital Grants & Gifts 10.0
Federal Appropriations 4.6
Land Grant & Investment Income 3.3
Total revenues $ 361.2
Sources of recurring revenues are
expected to remain strong, with a trend
toward higher levels of University-
generated revenues such as grant and
contract activity, and other
entrepreneurial activities.
(in millions)
Category Amount
Compensation $ 160.3
Benefits 43.0
Contracted Services 32.3
Supplies 22.7
Depreciation 20.8
Financial Aid 15.3
Maintenance 10.0
Other Expenses
Travel 9.3
Utilities 7.9
Cost of Sales 5.6
Communication 4.8
Interest Expense 4.4
Rent 2.8
Other 9.2
Total expenses $ 348.4
Proportions of revenues and expenses have generally remained constant as compared with prior years. Revenues
are derived primarily from student charges, state appropriations and grant and contract activity, while expenses are
primarily employee- related. These relationships are expected to continue.
This is trial version
www.adultpdf.com
Montana State University
(a component unit of the State of Montana)
Management’s Discussion and Analysis
As of and For Each of the Two Years Ended June 30, 2004 (continued)
A - 6
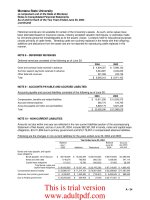
Operating expenses increased $18.7 million, and in each of the past two years represented 133% of operating
revenues. Instruction and research activities together constitute approximately half of the University’s expenses,
and were two of the primary programs showing a marked increase, consistent with higher enrollment and a
growing research program.
Plant and facilities expenses, the fourth-largest program, increased $6.1 million, due to several factors. The cost of
utilities used in the operation of classroom and administration facilities increased approximately $1.0 million, and
the write-off of development and design costs related to a canceled capital project contributed approximately
$800,000 in expense. Also during 2004, facilities staff performed more work on projects which were of a
maintenance nature than in the prior year, in which significant staff time was spent on projects whose costs were
capitalized and thus were not reflected in 2003 expenses.
The cost of providing auxiliary services, which consists primarily of dining and residence hall operations, constitutes
the third largest cost category, and increased $2.9 million due to the completion of certain deferred maintenance
projects. Public service, which includes the activities of extension services throughout Montana as well as public
television and radio stations and a regional museum, is the fifth largest program.
Expense Comparison
15 . 3
17 . 3
19 .2
20.8
26.8
22.8
25.8
32.9
80.2
82.8
4.9
15 . 5
17 . 0
18 . 3
19 . 6
20.7
20.8
27.4
30.0
75.1
79.8
4.4
0 102030405060708090
Interes t
Financial Aid
Institutional Support
Academic Support
Depreciation
Plant & Facilities
Student Services
Public Service
Auxiliary
Research
Ins truc tion
Shown In $ Millions
2003
2004
In the future, expenditures are expected to rise consistent with increases in research activity and increasing
compensation costs. Financial aid expense is expected to increase commensurate with increases in the tuition
rates, as the University strives to ensure continued access to all qualified students. Interest expense, considered a
non-operating expense, is expected to increase as the University issues new debt to construct and renovate
facilities.
This is trial version
www.adultpdf.com
Montana State University
(a component unit of the State of Montana)
Management’s Discussion and Analysis
As of and For Each of the Two Years Ended June 30, 2004 (continued)
A - 7
ASSETS, LIABILITIES AND NET ASSETS
The
Statement of Net Assets
is presented in a classified format, which differentiates between current and non-
current assets and liabilities, and also categorizes Net Assets (formerly called “Fund Balance”) into four categories.
Condensed Statements of Net Assets
(in millions)
Current assets
include the University’s cash;
accounts, grants and loans receivable; inventories; and
other assets expected to benefit the University within
one year. Accounts and grants receivable result
primarily from sponsored projects that are payable on a
cost-reimbursement basis, and also from student
accounts. The increase of $5.3 million in current assets
resulted primarily from an increase of $4.0 million in
cash, which is discussed in detail in conjunction with
the Statement of Cash Flows.
Capital assets, net
increased $2.5 million, resulting
from asset additions of $24.1 million, offset by
depreciation expense of $19.4 million and asset
retirements of $2.2 million. Increases included $4.9
million in construction project additions, $1.1 million of
which was expended to replace the roof on MSU-
Bozeman’s fieldhouse and $1.4 million expended for
MSU- Northern’s Heating, Ventilation and Air-Conditioning system. Approximately $3.5 million in library materials
were added, $2.3 million in buildings and improvements were recorded, and $13.6 million in furniture and
equipment were acquired. Furniture and equipment acquisitions included a $2.1 million weightless space chamber
and a digital satellite system for public television valued at nearly $2 million. Other acquisitions related largely to
the University’s research and instruction programs, and included several donated and grant-funded items.
Other noncurrent assets
include endowment fund assets, student loans receivable, investments expected to
mature over a period longer than one year, and a donation receivable from the MSU Foundation which is restricted
to the construction of a facility. The balance increased $3.7 million, which included an increase of $2.8 million in
donations receivable and an increase of $810,000 in noncurrent student loans receivable.
Current liabilities
include payroll and related liabilities, amounts payable to suppliers for goods and services
received, cash received for which the University has not yet earned the related revenue, and debt principal
payments due within one year. The balance increased $1.0 million, resulting primarily from the timing of expense
payments near year-end in 2004 as compared with 2003, and the overall increase in expenditure levels.
Noncurrent liabilities
include debt and advance liabilities, the amount of compensated absence liability
estimated to be payable after a one-year period, and amounts which would be payable to the Federal government
should the University choose to cease participation in the Federal Perkins Loan or Nursing Loan programs. These
balances decreased $2.1 million, due primarily to scheduled repayments of bond principal, offset by increased
advances from the State under the Intercap lending program (see note 11).
Amounts
invested in capital assets, net of related debt
, consist of the historical acquisition value of capital
assets, reduced by both accumulated depreciation expense charged against assets and debt balances related to
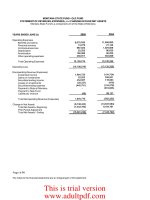
ASSETS 2004
2003
Current assets $ 118.7 $ 113.4
Capital assets, net 239.3 236.8
Other noncurrent assets 28.1 24.4
Total assets $ 386.1 $ 374.6
LIABILITIES
Current liabilities $ 49.9 $ 48.9
Noncurrent liabilities 124.1 126.2
Total liabilities $ 174.0 $ 175.1
NET ASSETS
Invested in capital assets, net $ 147.7 $ 143.3
Restricted, expendable 9.2 5.3
Restricted, non-expendable 9.8 9.3
Unrestricted 45.4 41.6
Total net assets $ 212.1 $ 199.5
This is trial version
www.adultpdf.com
Montana State University
(a component unit of the State of Montana)
Management’s Discussion and Analysis
As of and For Each of the Two Years Ended June 30, 2004 (continued)
A - 8
capital assets. This balance increases as assets are acquired and debt is repaid, and decreases as assets are
depreciated and debt is incurred.
Restricted, expendable net assets
represent balances that may be expended by the University, but only in
accordance with restrictions imposed upon the University by an external party, such as a donor or through a
legislative mandate. The University’s most significant restricted, expendable balances relate to funds restricted to
use for the construction, renewal or replacement of facilities. Approximately $3.0 million is held by trustees in
accordance with bond covenants, and may only be expended for the renewal and replacement of assets whose
revenues are pledged as security for the repayment of debt. The remaining $2.8 million relates to an amount
receivable from the MSU Foundation, which is to be expended for the construction of a research facility.
Restricted, non-expendable
balances must be held in perpetuity, and include endowment principal as well as
the University portion of student loans receivable under the Federal Perkins and Nursing Loan programs.
Unrestricted net assets
may be designated for specific purposes by action of management or the Board of
Regents, or may otherwise be limited by contractual agreements with outside parties. Substantially all unrestricted
net assets are designated for specific purposes as described in the notes to the financial statements, and include
funds accumulated for employee termination payouts, funds earmarked for facility renewal and replacement, and
student organization funds.
CASH FLOWS
Condensed Statements of Cash Flows
(in millions)
The
Statement of Cash Flows
presents
information related to cash inflows and outflows,
categorized by operating, noncapital financing,
capital financing, and investing activities. The
reconciliation of operating loss to cash used in
operations explains the relationship between the
Statement of Net Assets and the Statement of
Revenues, Expenses and Changes in Net Assets,
showing that increases and decreases in operating
assets often require the use or receipt of cash, but
do not result in recognition of a revenue or an
expense.
A $4.0 million increase in cash and equivalents was generated on $4.0 million of “Income before other revenues,
expenses, gains and losses” as reported in the accompanying Statement of Revenues, Expenses and Changes in
Net Assets. During the prior year, a $7.9 million increase in cash and equivalents was generated on $2.3 million of
“Income before other revenues, expenses, gains and losses.” A year-to-year comparison of each type of cash flow
follows.
Operating activities used $65.8 million in cash, resulting primarily from an operating loss of $84.9 million. The
operating loss was offset by non-cash expenses of $21.5 million, (primarily depreciation and amortization).
Issuance of student loans outpaced the collection of loan repayments by $1.5 million, resulting in a decreased cash
balance. Other, less significant, increases and decreases also contributed to the change in operating cash.
2004
2003
Cash provided/(used) by:
Operating activities, net
$ (65.8) $ (56.2)
Noncapital financing activities, net 92.6 92.1
Capital and related financing activities,
net
(24.3)
(24.6)
Investing activities, net 1.5 (3.4)
Net increase in cash 4.0 7.9
Cash, beginning of year 82.8 74.9
Cash, end of year $ 86.8 $ 82.8
This is trial version
www.adultpdf.com
Montana State University
(a component unit of the State of Montana)
Management’s Discussion and Analysis
As of and For Each of the Two Years Ended June 30, 2004 (continued)
A - 9
In the prior year, operating activities used $56.2 million in cash, resulting primarily from an operating loss of $81.4
million. The operating loss was offset by non-cash expenses of $20.5 million, (primarily depreciation and
amortization) as well increased funds of $4.7 million resulting from changes in operating assets and liabilities.
Noncapital financing activities
provided $92.6 million in cash, resulting from $82.4 million in state
appropriations, $1.7 million of land grant income, and $7.7 million of gift income. In the prior year, noncapital
financing activities provided $92.1 million in cash, resulting from $77.6 million in state appropriations, $1.6 million
of land grant income, and $8.3 million of gift income, as well as other, less significant sources and uses of cash.
Capital and related financing activities
used $24.2 million in cash, resulting primarily from $18.0 million
expended to acquire capital assets, $19.6 million in bond issuance proceeds, $22.5 million in debt principal
payments (including refunded debt of $18.1 million), and $4.0 million in cash paid for interest, primarily related to
bond indebtedness. In the prior year, these activities used $24.6 million in cash, resulting from $16.5 million
expended to acquire capital assets, $4.6 million in debt principal payments, and $5.4 million in cash paid for
interest.
Investing activities
provided $1.5 million, resulting from earnings on invested cash. In the prior year, investing
activities used $3.4 million. During 2003, cash of $4.8 million, most of which had been received in the form of an
estate gift, and was shown as a cash inflow in “Noncapital financing activities,” was used to purchase long-term
investments, and as such was considered a use of cash for investing purposes. This use of cash was offset by
investment earnings of $1.2 million.
BONDS, NOTES, AND CAPITAL LEASES
As of June 30, 2004, the University had approximately $87.3 million in outstanding bonds, notes, and capital lease
principal, a decrease of $3.1 million compared with June 30, 2003. The change resulted from new borrowings of
$19.6 million, amortization of $590,000 in discount and issue costs, offset by payment of $817,000 in bond issue
costs, and repayments of $22.5 million.
New borrowings included the October 2003 issuance of $18.8 million in Municipal Auction Rate Securities as Series
2003 G Revenue Bonds. Of this total, $16,745,000 was used for a current refunding of the Series 1993-A bonds
and $2,015,000 was used for an advance refunding of the Series 1994 C bonds. The new bonds are ten year
variable rate bonds, priced on a 35-day rate period. They are unconditionally and irrevocably guaranteed by XL
Capital Assurance. The bonds were issued in denominations of $25,000, with principal repayments scheduled each
May 15 and November 15 through November, 2016. The effective interest rate on these variable rate bonds has
ranged from 0.8% to 1.65% since the date of issuance. Interest is paid monthly based on the Auction Rate. The
University has set aside an amount equal to a 3.25% effective rate each month, and will use any reserves
generated in times of low rates to supplement payments in times of rising rates.
Subsequent to June 30, 2004, the University entered into or plans to execute certain debt transactions as follows.
In November 2004, the University issued $23.7 million as Series H revenue bonds, the proceeds of which will be
used to construct a Chemistry/Biochemistry Research Laboratory Facility on the campus of Montana State
University-Bozeman. The traditional fixed rate issue carries an effective interest rate of 4.61% and a 30-year
repayment term. Indirect cost recoveries derived from the University’s Research and Creative Activities will be
added to the existing pledged revenues of the University’s bonded indebtedness and will be used to fund debt
service requirements.
Also in November, the Board of Regents authorized the issuance of Series I 2004 Facilities Revenue Refunding
Bonds to refund a significant portion of the Series D 1996 bonds currently outstanding. The bonds, maturing in
This is trial version
www.adultpdf.com
Montana State University
(a component unit of the State of Montana)
Management’s Discussion and Analysis
As of and For Each of the Two Years Ended June 30, 2004 (continued)
A - 10
November 2025, are expected to be issued at a face value of $31.48 million and result in a calculated savings of
approximately $1.8 million over the repayment period
Enhancement of student facilities at the Bozeman campus has been approved by the Board of Regents in the
amount of $28.0 million. Enhancements include renovation of the student union building, construction of a
theater, and renovation of the health and P.E. complex. The University plans to issue bonds to fund approximately
$25.0 million of the project, with the use of existing resources funding the remainder. Increased student fees will
be implemented beginning in the Fall of 2005, and will be pledged for the repayment of these bonds, which are
expected to be issued early in 2005.
ECONOMIC OUTLOOK
The State of Montana has experienced economic uncertainty, which affects the University’s level of available State
funding. The State of Montana Legislative Fiscal Division has prepared a
General Fund Preliminary Budget Outlook
‘Big Picture Report’ 2007 Biennium
. The report discusses “structural balance” as the matching of
ongoing
revenues
with
ongoing
expenditures. In the recent past, the University has strived to achieve structural balance by
combining controlled spending with increased revenues, to maintain quality programs in light of flat or decreased
available State funding.
Recent revenue increases have been achieved through several means: the growth of grant and contract activity;
increases in tuition rates charged to students, which will likely continue at a steady, predictable level; careful
monitoring and management of the mix of in-state and out-of-state students, whose tuition rates differ; and
continued encouragement of the entrepreneurial spirit maintained by many University faculty and staff.
The “Big Picture Report” discusses the comparatively brighter budget projections for the upcoming biennium than
has been faced by the State in the recent past, citing strong growth in individual income tax and oil and gas tax
revenues as primary factors. A strong ending fund balance and the ability to fund several one-time projects are
expected. As always, there are a number of issues, including ballot initiatives, litigation issues, and other items,
with uncertain or unknown impact that are not included in current budget projections.
The U.S. Census Bureau projects that, over the next twenty years, the population of Montanans ages 18 – 24 will
decrease steadily, showing an approximate 10% overall decrease. In light of this trend, continued monitoring and
management of the University’s out-of-state student population and tuition rates is crucial.
To assist in the allocation of its resources, management evaluates University programs regularly, and maintains a
budgeting process that is open to the public. Accountability and stewardship of the University’s assets are stressed
by top management, as is excellence in the programs offered. University management will continue to determine
the proper balance between spending cuts and revenue increases, to ensure that quality programs remain while
access to the University is not unduly limited by the cost of attendance.
This is trial version
www.adultpdf.com
A - 11
Montana State University
a component unit of the State of Montana
Consolidated Statements of Net Assets
As of June 30
ASSETS 2004 2003
Current assets:
Cash and cash equivalents $ 85,897,298 $ 81,895,206
Accounts and grants receivable, net 5,935,449 7,203,919
Amounts receivable from Federal government 15,350,504 13,303,535
Amounts receivable from primary government 1,190,805 1,159,718
Amounts receivable from other State of Montana Component Units 146,710 22,326
Loans receivable, net 4,232,045 4,228,273
Inventories 2,832,718 3,009,439
Prepaid expenses and other current assets 3,179,666 2,597,090
Total current assets
118,765,195 113,419,506
Noncurrent assets:
Restricted cash and cash equivalents 941,704 940,586
Restricted investments 5,396,299 5,133,614
Loans receivable, net 17,033,357 16,223,813
Investments 1,933,431 2,141,975
Other assets 2,775,858 -
Capital assets, net (see note 7) 239,316,813 236,768,452
Total noncurrent assets
267,397,462 261,208,440
Total assets
$ 386,162,657 $ 374,627,946
LIABILITIES
Current liabilities:
Accounts payable and accrued liabilities $ 23,026,240 $ 21,906,619
Amounts payable to primary government 1,247,450 1,648,671
Amounts payable to other State of Montana component units 20,934 338,381
Property held in trust for others 1,237,654 876,175
Deferred revenues 8,360,313 8,971,103
Compensated absences 11,081,843 10,642,125
Current portion debt and capital lease obligations (note 10) 4,965,455 4,552,141
Total current liabilities
49,939,889 48,935,215
Noncurrent liabilities:
Advances from primary government 8,785,996 7,769,759
Debt and capital lease obligations (note 10) 82,351,350 85,903,743
Compensated absences 12,176,957 12,254,032
Due to Federal government 20,771,691 20,254,326
Total noncurrent liabilities
124,085,994 126,181,860
Total liabilities
174,025,883 175,117,075
NET ASSETS
Invested in capital assets, net of related debt 147,763,170 143,300,755
Restricted - nonexpendable:
Endowments 6,338,003 6,074,199
Loans 3,425,954 3,267,052
Restricted - expendable:
Scholarships 824,666 297,961
Research and other 2,445,913 1,430,603
Loans 167,636 189,365
Renewal and replacement of plant facilities 5,771,107 3,045,471
Debt retirement 23,952 321,754
Unrestricted (note 13) 45,376,373 41,583,711
Total net assets
212,136,774 199,510,871
Total liabilities and net assets
$ 386,162,657 $ 374,627,946
The accompanying notes are an integral part of these financial statements.
This is trial version
www.adultpdf.com
A - 12
Montana State University
a component unit of the State of Montana
UNIVERSITY COMPONENT UNITS
Combined Statement of Financial Position
As of June 30, 2004 or December 31, 2003 (see Note 20)
Assets:
Cash and cash equivalents $ 6,443,381
Accrued dividends and interest 53,869
Investments 107,901,455
Amounts due from the institution or other component units 817,648
Contributions receivable, net of allowance 5,895,303
Contracts, notes and other receivables 113,646
Student loans and other receivables 872,014
Non-depreciable capital assets 783,109
Depreciable capital assets, net 6,033,789
Other assets 2,299,030
Total assets
$ 131,213,244
Liabilities and net assets:
Liabilities
Accounts payable $ 571,109
Accrued expenses and other liabilities 1,367,399
Compensated absences 95,535
Notes and bonds payable 2,734,731
Amounts due to the institution or other component units 3,504,384
Liabilities to external beneficiaries 3,147,064
Custodial funds 8,778,795
Total liabilities 20,199,017
Unrestricted net assets 12,484,250
Temporarily restricted net assets 31,020,115
Permanently restricted net assets 67,509,862
Total net assets 111,014,227
Total liabilities and net assets
$ 131,213,244
The accompanying notes are an integral part of these financial statements.
This is trial version
www.adultpdf.com
A - 13
Montana State University
a component unit of the State of Montana
Consolidated Statements of Revenues, Expenses and Changes in Net Assets
As of and for Each of the Two Years Ended June 30
OPERATING REVENUES 2004 2003
Tuition and fees (net of $17,326,412 and $17,223,007 scholarship discount);
($5,426,006 and $5,232,010 are pledged for repayment of bonds)
$ 84,852,818 $ 79,491,455
Federal appropriations 4,562,318 5,621,121
Federal grants and contracts 89,330,062 81,012,750
State grants and contracts 7,508,336 6,396,530
Non-governmental grants and contracts 8,828,330 9,999,146
Grant and contract facilities and administrative cost allowances 14,110,253 13,568,037
Educational, public service and outreach revenues ($2,959,480 and $2,673,980 are
pledged for repayment of bonds)
18,302,474 17,005,161
Auxiliary revenues:
Housing (net of $1,314,925 and $1,223,419 scholarship discount),( $ 2,119,122
and $1,988,360 net revenues are pledged for repayment of bonds)
11,135,119 11,116,267
Food services (net of $1,532,249 and $1,320,205 scholarship discount),
($1,388,797 and $2,241,740 net revenues are pledged for repayment of bonds)
10,856,444 10,340,616
Other auxiliary sales and services (net of $572,653 and $1,271,273 scholarship
discount), ($380,081 and $70,026 net losses are pledged for repayment of
bonds)
7,430,793 6,630,123
Interest earned on loans 54,301 85,542
Other operating revenues 496,216 1,080,765
Total operating revenues
257,467,464 242,347,513
OPERATING EXPENSES
Compensation and benefits 203,327,304 194,696,126
Operating expenses (Note 14) 102,936,542 93,906,338
Scholarships and fellowships (net of $20,746,239 and $21,037,904 scholarship
discount) 15,312,605 15,501,298
Depreciation and amortization 20,803,902 19,627,347
Total operating expenses
342,380,353 323,731,109
Operating loss
(84,912,889) (81,383,596)
NONOPERATING REVENUES (EXPENSES)
State appropriations 82,435,945 77,594,407
Land grant income (pledged as security for repayment of bonds) 1,706,447 1,551,616
Gifts
(
expendable) 7,696,004 8,255,689
Investment income ($184,216 and $276,074 are pledged as repayment of bonds) 1,544,840 1,132,768
Interest expense (4,460,697) (4,897,408)
Net nonoperating revenues (expenses)
88,922,539 83,637,072
Income before other revenues, expenses, gains and losses
4,009,650 2,253,476
Gain (loss) on disposals of capital assets (1,585,269) (457,354)
Additions to permanent endowment 229,730 4,667,033
Capital gifts, grants and contributions 9,971,792 9,595,433
Change in net assets
12,625,903 16,058,588
Net assets, beginning of year, as previously stated 199,510,871 188,871,091
Adjustment to advance from primary government - (5,418,808)
Net assets, beginning of year, as restated 199,510,871 183,452,283
Net assets, end of year
$ 212,136,774 $ 199,510,871
The accompanying notes are an integral part of these financial statements.
This is trial version
www.adultpdf.com