STATE OF MONTANA BOARD OF INVESTMENTS CONSOLIDATED UNIFIED INVESTMENT PROGRAM FINANICAL STATEMENT_part1 ppt
Bạn đang xem bản rút gọn của tài liệu. Xem và tải ngay bản đầy đủ của tài liệu tại đây (241.43 KB, 10 trang )
STATE OF MONTANA BOARD OF INVESTMENTS
CONSOLIDATED UNIFIED INVESTMENT PROGRAM FINANICAL STATEMENT
ALL OTHER FUNDS
Security Name Coupon Maturity Par Amortized Cost Fair Value %
NATIONWIDE FINANCIAL SER 6.250 11/15/11 5,000,000 5,097,510 4,700,000 0.33%
NORFOLK SOUTHN CORP 5.750 01/15/16 2,000,000 1,991,719 2,046,481 0.14%
NORTHWESTERN CORP 6.340 04/01/19 5,000,000 4,996,739 5,114,594 0.36%
NOVARTIS SECS INVT LTD 5.125 02/10/19 5,000,000 4,991,444 5,075,949 0.35%
OCCIDENTAL PETE CORP 7.000 11/01/13 5,000,000 4,983,496 5,684,998 0.40%
PPL MONT LLC 8.903 07/02/20 3,252,737 3,252,737 3,572,717 0.25%
PPL ENERGY SUPPLY LLC 6.500 05/01/18 3,000,000 2,991,133 3,014,852 0.21%
PACCAR FINL CORP MTN BK ENT 4.639 01/12/11 5,000,000 5,000,000 4,989,620 0.35%
PACCAR INC 6.375 02/15/12 1,000,000 999,056 1,063,203 0.07%
PANAMERICAN BEVERAGES INC 7.250 07/01/09 3,000,000 3,000,000 3,000,000 0.21%
PRINCIPAL LIFE GLOBAL FDG MTN 5.125 10/15/13 5,000,000 4,996,847 4,749,558 0.33%
PROTECTIVE LIFE SECD TRS SECD 5.450 09/28/12 7,000,000 6,989,586 6,965,162 0.49%
PRUDENTIAL FINL INC 5.500 03/15/16 5,000,000 4,931,244 4,535,230 0.32%
REGIONS BANK FDIC GTD TLGP 2.750 12/10/10 750,000 762,023 769,626 0.05%
ROCHE HLDGS INC 4.500 03/01/12 1,000,000 995,307 1,041,591 0.07%
SBC COMMUNICATIONS INC 5.300 11/15/10 5,000,000 4,997,017 5,179,369 0.36%
SLM CORP 4.500 07/26/10 5,000,000 4,997,011 4,775,000 0.33%
ST PAUL TRAVELERS COS INC 6.250 06/20/16 5,000,000 4,987,733 5,281,439 0.37%
SCHERING PLOUGH CORP 6.000 09/15/17 5,000,000 4,979,923 5,324,431 0.37%
SEARIVER MARITIME FINL HLDGS 0.000 09/01/12 1,450,000 1,327,993 1,312,673 0.09%
SOUTHWEST GAS CORP 8.375 02/15/11 4,000,000 3,999,007 4,242,116 0.30%
TRANSCANADA PIPELINES LTD 7.125 01/15/19 5,000,000 5,054,244 5,626,731 0.39%
UNION BK CALIF 5.950 05/11/16 5,000,000 5,002,932 4,842,802 0.34%
UNION PAC CORP 4.875 01/15/15 7,000,000 6,794,018 6,850,780 0.48%
UNITED PARCEL SVC INC 5.500 01/15/18 5,000,000 4,991,544 5,287,947 0.37%
VERIZON COMMUNICATIONS INC 5.550 02/15/16 5,000,000 4,973,461 5,160,503 0.36%
VERIZON NEW JERSEY INC 5.875 01/17/12 5,000,000 5,104,462 5,309,547 0.37%
WACHOVIA CORP NEW 5.625 10/15/16 5,000,000 4,986,005 4,632,532 0.32%
WAL MART STORES INC 4.250 04/15/13 1,000,000 1,049,136 1,033,219 0.07%
WELLPOINT INC 5.875 06/15/17 5,000,000 4,938,001 4,846,001 0.34%
WELLS FARGO + CO NEW 4.625 04/15/14 5,000,000 4,896,910 5,035,186 0.35%
WELLS FARGO CO NEW 5.300 08/26/11 10,000,000 9,994,327 10,450,294 0.73%
WILMINGTON TR CORP 8.500 04/02/18 2,000,000 2,000,000 2,103,658 0.15%
WYETH 5.500 02/01/14 5,000,000 4,995,560 5,374,157 0.38%
ZIONS BANCORPORATION 5.650 05/15/14 3,000,000 2,998,103 2,174,831 0.15%
Corporate Bonds Rated 563,711,793 551,104,065 537,914,438 37.56%
BGI EQUITY INDEX FUND B NA NA 606,661 84,406,677 81,742,906 5.71%
Equity Index Fund 606,661 84,406,677 81,742,906 5.71%
MONTANA RESIDIENTIAL MORTGAGES NA NA 45,270,143 45,270,143 44,547,218 3.11%
MONTANA COAL TAX TRUST LOANS NA NA 212,023,678 212,023,678 212,023,678 14.81%
Loans/Mortgages 257,293,821 257,293,821 256,570,896 17.92%
2273 BOOT HILL COURT, BOZEMAN MT NA NA 2,073,887 2,073,887 2,123,654 0.15%
CALIFORNIA STREET, HELENA MT NA NA 205,591 205,591 221,390 0.02%
2401 COLONIAL DRIVE, HELENA MT NA NA 7,250,580 7,250,580 7,785,377 0.54%
1712 NINTH AVENENUE, HELENA MT NA NA 514,749 514,749 579,626 0.04%
100 NORTH PARK AVENUE, HELENA MT NA NA 6,935,776 6,935,776 6,584,252 0.46%
Real Estate 16,980,583 16,980,583 17,294,299 1.21%
A-55
This is trial version
www.adultpdf.com
STATE OF MONTANA BOARD OF INVESTMENTS
CONSOLIDATED UNIFIED INVESTMENT PROGRAM FINANICAL STATEMENT
ALL OTHER FUNDS
Security Name Coupon Maturity Par Amortized Cost Fair Value %
FED HM LN PC POOL G10814 5.500 05/01/13 666,288 666,095 700,786 0.05%
FED HM LN PC POOL G12310 5.500 08/01/21 5,251,330 5,255,923 5,487,650 0.38%
FED HM LN PC POOL G13081 5.000 04/01/23 7,620,895 7,620,895 7,886,662 0.55%
FED HM LN PC POOL G18244 4.500 02/01/23 7,503,598 7,369,194 7,671,184 0.54%
FED HM LN PC POOL J08160 5.000 12/01/22 7,950,076 7,940,628 8,232,552 0.57%
FEDERAL HOME LN MTG CORP 5.050 01/26/15 10,000,000 9,982,275 10,751,311 0.75%
FREDDIE MAC 2.500 04/08/13 5,000,000 5,000,000 4,960,619 0.35%
FED HM LN PC POOL E00540 6.000 03/01/13 407,706 407,223 432,340 0.03%
FED HM LN PC POOL E00659 6.000 04/01/14 511,429 511,255 542,898 0.04%
FEDERAL FARM CR BKS 2.125 06/18/12 2,000,000 2,000,178 2,011,283 0.14%
FEDERAL FARM CR BKS 4.450 09/23/13 7,000,000 6,858,802 7,484,935 0.52%
FEDERAL FARM CR BKS CONS SYSTE 4.000 09/24/10 2,000,000 2,004,727 2,082,111 0.15%
EDERAL FARM CR BKS 5.100 04/12/17 20,000,000 19,780,738 21,774,586 1.52%
FEDERAL FARM CREDIT BANK 3.400 02/07/13 19,000,000 19,000,000 19,524,978 1.36%
FEDERAL FARM CREDIT BANK 4.950 03/12/18 5,000,000 4,995,651 5,015,322 0.35%
FEDERAL HOME LN BKS 4.125 08/13/10 10,000,000 9,997,990 10,377,494 0.72%
FEDERAL HOME LN BKS 4.750 09/11/15 10,000,000 9,808,804 10,450,588 0.73%
FEDERAL HOME LOAN BANK 4.875 11/18/11 1,900,000 1,898,114 2,047,779 0.14%
FEDERAL HOME LN BANKS 4.750 12/16/16 15,000,000 14,888,608 16,055,595 1.12%
FEDERAL HOME LN BKS 5.125 03/10/17 10,000,000 10,074,026 10,611,026 0.74%
FEDERAL HOME LOAN BKS 4.875 06/08/12 4,900,000 4,873,383 5,226,095 0.36%
FEDERAL HOME LN BK 4.500 10/09/09 1,500,000 1,502,987 1,517,355 0.11%
FEDERAL HOME LOAN BANK 4.875 10/30/17 4,000,000 4,243,782 4,177,669 0.29%
FEDERAL HOME LOAN BANK 3.000 12/10/10 7,000,000 6,981,575 7,195,113 0.50%
FEDERAL HOME LN BKS 3.125 06/10/11 5,000,000 4,913,842 5,169,626 0.36%
FEDERAL HOME LN BKS 3.500 07/16/10 5,000,000 5,030,102 5,146,255 0.36%
FEDERAL HOME LN BKS 3.625 09/16/11 10,000,000 9,987,841 10,474,477 0.73%
FEDERAL HOME LN BKS 3.000 12/30/13 10,000,000 10,000,000 9,809,752 0.68%
FEDERAL HOME LN BKS 2.500 02/19/13 5,000,000 5,000,000 5,024,840 0.35%
FEDERAL HOME LN BKS 3.000 03/04/13 2,935,000 2,935,000 2,943,716 0.21%
FEDERAL HOME LN MTG CORP 5.625 03/15/11 10,000,000 10,015,851 10,748,772 0.75%
FEDERAL HOME LN MTG CORP 6.000 06/15/11 15,000,000 14,997,401 16,359,894 1.14%
FEDERAL NATL MTG ASSN DEB STRP 0.000 11/15/11 1,000,000 950,760 953,015 0.07%
FEDERAL NATL MTG ASSN DEB STRP 0.000 11/15/12 271,000 247,398 243,204 0.02%
FEDERAL NATL MTG ASSN DEB STRP 0.000 11/15/13 1,000,000 892,694 866,824 0.06%
FEDERAL NATL MTG ASSN 5.550 02/16/17 20,000,000 20,032,899 20,461,130 1.43%
FEDERAL NATL MTG ASSN 5.000 04/26/17 5,000,000 4,882,709 5,075,202 0.35%
FEDERAL NATL MTG ASSN 0.000 06/01/17 14,600,000 8,901,856 10,386,631 0.73%
FEDERAL NATL MTG ASSN 6.625 11/15/10 10,000,000 10,059,752 10,795,011 0.75%
FEDERAL NATL MTG ASSN 4.375 07/17/13 20,000,000 19,682,400 21,207,502 1.48%
FEDERAL NATL MTG ASSN 4.125 04/15/14 10,000,000 9,690,357 10,586,065 0.74%
FEDERAL NATL MTG ASSN 4.625 10/15/14 10,000,000 10,079,835 10,800,063 0.75%
FEDERAL NATL MTG ASSN 4.250 08/15/10 5,000,000 5,074,276 5,196,483 0.36%
FEDERAL HOME LN MTG CORP 0.000 01/15/13 1,000,000 927,454 889,688 0.06%
FEDERAL NATL MTG ASSN DEB 0.000 07/15/14 1,000,000 873,100 835,249 0.06%
FNMA POOL 190985 7.500 08/01/09 4,895 4,895 4,963 0.00%
FNMA POOL 254140 5.500 01/01/17 3,486,707 3,478,541 3,671,670 0.26%
FNMA POOL 254233 5.000 03/01/17 2,905,536 2,851,078 3,030,808 0.21%
A-56
This is trial version
www.adultpdf.com
STATE OF MONTANA BOARD OF INVESTMENTS
CONSOLIDATED UNIFIED INVESTMENT PROGRAM FINANICAL STATEMENT
ALL OTHER FUNDS
Security Name Coupon Maturity Par Amortized Cost Fair Value %
FNMA POOL 254631 5.000 02/01/18 2,476,578 2,461,695 2,593,657 0.18%
FNMA POOL 303590 7.000 11/01/10 71,864 71,864 73,776 0.01%
FNMA POOL 313999 6.000 02/01/13 218,975 218,581 232,327 0.02%
FEDERAL HOME LN MTG CORP 5.000 02/16/17 10,000,000 9,910,379 10,902,970 0.76%
FEDERAL HOME LN MTG CORP 1.500 01/07/11 10,000,000 10,000,000 10,072,575 0.70%
FNMA POOL 572220 6.000 03/01/16 151,248 151,026 161,217 0.01%
FNMA POOL 592327 5.500 06/01/16 284,924 281,461 300,038 0.02%
FEDERAL NATL MTG ASSN 3.875 07/12/13 10,000,000 9,874,428 10,546,868 0.74%
FEDERAL NATL MTG ASSN 2.000 03/02/11 3,000,000 3,000,000 3,018,665 0.21%
FNMA POOL 844915 4.500 11/01/20 5,484,417 5,454,981 5,652,579 0.39%
FNMA POOL 888932 4.500 11/01/22 3,756,671 3,756,671 3,871,858 0.27%
FNMA POOL 962078 4.500 03/01/23 8,264,729 8,219,971 8,449,940 0.59%
U.S. Government Agency 386,123,865 378,573,953 398,775,241 27.85%
ENSCO OFFSHORE CO 6.360 12/01/15 6,500,448 6,500,448 7,122,346 0.50%
GLOBAL INDS LTD 7.710 02/15/25 3,200,000 3,200,000 3,226,624 0.23%
ROWAN COS INC 5.880 03/15/12 6,815,000 6,815,000 7,104,024 0.50%
UNITED STATES TREAS NTS 4.000 02/15/15 20,000,000 19,192,938 21,256,599 1.48%
UNITED STATES TREAS NTS 4.250 11/15/17 15,000,000 15,152,931 15,913,950 1.11%
UNITED STATES TREAS NTS 3.875 05/15/18 15,000,000 15,040,746 15,456,900 1.08%
UNITED STATES TREAS NTS 4.000 08/15/18 10,000,000 10,069,431 10,373,200 0.72%
UNITED STATES TREAS NTS 2.750 02/15/19 10,000,000 9,896,713 9,365,400 0.65%
US TREASURY T/B 1.375 05/15/12 3,000,000 2,969,726 2,983,590 0.21%
WI TREASURY SEC 2.625 04/30/16 10,000,000 9,824,458 9,670,300 0.68%
UNITED STATE TREAS NTS 2.625 02/29/16 5,000,000 5,009,362 4,854,600 0.34%
WI TREASURY SEC 3.250 05/31/16 5,000,000 4,887,609 5,021,000 0.35%
UNITED STATES TRES SC STRP INT 0.000 05/15/12 3,000,000 2,872,621 2,876,190 0.20%
UNITED STATES TRES SC STRP INT 0.000 08/15/17 1,590,000 1,278,622 1,174,120 0.08%
UNITED STATES TRES SC STRP INT 0.000 11/15/17 6,300,000 4,267,029 4,578,840 0.32%
U.S. Government Direct Obligations 120,405,448 116,977,634 120,977,683 8.45%
AOF Total 1,370,967,945 1,431,182,507 1,432,121,237 100.00%
{This area intentionally left blank}
A-57
This is trial version
www.adultpdf.com
A-58
This is trial version
www.adultpdf.com
A-59
Room 160 • State Capitol Building • P.O. Box 201705 • Helena, MT • 59620-1705
Phone (406) 444-3122 • FAX (406) 444-9784 • E-Mail
LEGISLATIVE AUDIT DIVISION
Tori Hunthausen, Legislative Auditor Deputy Legislative Auditors
Monica Huyg, Legal Counsel James Gillett
Angie Grove
I A’ R
e Legislative Audit Committee
of the Montana State Legislature:
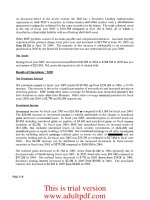
We have audited the accompanying Statement of Net Assets of the Enterprise Fund of the Montana
Board of Investments as of June 30, 2009, and 2008, and the related Statement of Revenues, Expenses
and Changes in Fund Net Assets, and Statement of Cash Flows for each of the scal years then
ended. e information contained in these nancial statements is the responsibility of the Board's
management. Our responsibility is to express an opinion on these nancial statements based on our
audit.
We conducted our audit in accordance with auditing standards generally accepted in the United States
of America. ose standards require that we plan and perform the audit to obtain reasonable assurance
about whether the nancial statements are free of material misstatement. An audit includes examining,
on a test basis, evidence supporting the amounts and disclosures in the nancial statements. An audit
also includes assessing the accounting principles used and signicant estimates made by management,
as well as evaluating the overall nancial statement presentation. We believe that our audit provides a
reasonable basis for our opinion.
In our opinion, the nancial statements referred to above present fairly, in all material respects, the
nancial position of the Enterprise Fund of the Montana Board of Investments as of June 30, 2009,
and 2008, and its changes in net assets and cash ows for each of the scal years then ended, in
conformity with accounting principles generally accepted in the United States of America.
Respectfully submitted,
/s/ James Gillett
James Gillett, CPA
Deputy Legislative Auditor
October 27, 2009
This is trial version
www.adultpdf.com
A-60
This is trial version
www.adultpdf.com
Assets
2009
2008
Current assets:
Cash and cash equivalents (Note 1) $ 9,450,048 $ 9,230,138
Interest receivable 612,231 878,280
Notes/loans receivable (Note 1) 7,305,015 9,779,321
Interfund notes/loans and interest receivable (Note 1) 3,914,397 4,133,105
Component Unit notes/loans and interest receivable (Note 1) 1,902,780 1,856,884
Short-term investments at fair value (Notes 1 and 2) 1,735,074 9,907,678
Security lending cash collateral (Note 3) 7,985
1,370
Total current assets 24,927,530 35,786,776
Noncurrent assets:
Restricted investments at fair value (Notes 1 and 2) 3,065,218 3,920,255
Long-term investments at fair value (Notes 1 and 2) 10,124 2,914
Notes/loans receivable (Note 1) 35,021,551 34,841,007
Interfund notes/loans and interest receivable (Note 1) 24,102,946 21,577,526
Component Unit notes/loans receivable (Note 1) 7,548,335 8,260,506
Capitalized cost of issue (Note 1) 1,315,245 1,419,379
Equipment 6,090 6,090
Accumulated depreciation (3,758)
(2,977)
Total noncurrent assets 71,065,751 70,024,700
Total assets $ 95,993,281 $ 105,811,476
Liabilities
Current liabilities:
Due to other funds 1,926 2,434
Accrued expenses 12,090 13,873
Accrued interest payable 689,258 1,146,090
Security lending obligations (Note 3) 7,985 1,370
Arbitrage rebate tax payable 19,454 25,370
Compensated absences 12,424 12,385
Current bonds/notes payable (Note 4) 88,956,456
98,462,463
Total current liabilities 89,699,593 99,663,985
Noncurrent liabilities
Bonds/notes payable (Note 4 ) 843,694 1,435,903
Compensated absences 14,902 40,684
Arbitrage rebate tax payable 14,426
OPEB implicit rate subsidy (Note 10) 29,408
14,910
Total noncurrent liabilities 888,004 1,505,923
Total liabilities $ 90,587,597 $ 101,169,908
Net Assets
Invested in capital assets, net of related debt $ 2,332 $ 3,113
Restricted (Note 1) 1,936,397 3,132,940
Unrestricted 3,466,955
1,505,515
Total net assets (Note 7) $ 5,405,684 $ 4,641,568
Total liabilities and net assets $ 95,993,281 $ 105,811,476
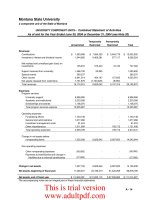
STATE OF MONTANA BOARD OF INVESTMENTS ENTERPRISE FUND
STATEMENT OF NET ASSETS AS OF JUNE 30, 2009 AND 2008
The accompanying notes are an integral part of these financial statements.
A-61
This is trial version
www.adultpdf.com
Operating revenue 2009 2008
Reimbursements $ 25,927 $ 33,321
Investment income 403,540 1,043,973
Security lending income 559 321
Financing income 3,132,033
3,425,902
Total operating revenue 3,562,059 4,503,517
Operating expenses
Personal services 195,598 297,247
Contracted services 18,611 32,163
Supplies and materials 3,296 5,419
Communications 12,793 6,830
Travel 3,257 2,132
Rent 43,916 42,893
Repair and maintenance 315 300
Indirect and other costs 36,778 44,603
OPEB (Note 10) 14,498 14,910
Depreciation expense 781 47
Arbitrage rebate tax expense (Note 9) (20,343) 23,580
Security lending expense 188 251
Debt service
Interest expense 2,855,503 3,729,900
Trustee fee expense 66,055 66,473
Bond issuance cost amortization expense 104,134 106,752
Other debt service expense 187,563
179,280
Total operating expenses 3,522,943 4,552,780
Operating income (loss) 39,116 (49,263)
Nonoperating income:
Transfers from other funds (Note 8) 725,000
0
Change in net assets 764,116 (49,263)
Beginning net assets 4,641,568
4,690,831
Ending net assets (Note 7) $ 5,405,684 $ 4,641,568
The accompanying notes are an integral part of these financial statements.
STATE OF MONTANA BOARD OF INVESTMENTS ENTERPRISE FUND
STATEMENT OF REVENUES, EXPENSES, AND CHANGES IN FUND NET ASSETS
FOR THE FISCAL YEARS ENDED JUNE 30, 2009 AND 2008
A-62
This is trial version
www.adultpdf.com
2009 2008
Cash flows from operatin
g
activities:
Receipts for sales and services $ 25,927 $ 33,321
Pa
y
ments to suppliers for
g
oods and services (117,651) (142,063)
Pa
y
ments to emplo
y
ees (222,986) (296,865)
Net cash (used for) operatin
g
activities (314,710) (405,607)
Cash flows from non-capital financin
g
activities:
Pa
y
ment of principal and interest on bonds and notes (13,664,170) (5,840,364)
Proceeds from issuance of bonds and notes 0 429,549
Transfers from other funds (Note 8) 725,000
0
Net cash provided b
y
(used for) non-capital financin
g
activities (12,939,170) (5,410,815)
Cash flows from capital and related financin
g
activities:
Acquisition of fixed assets 0
(3,100)
Net cash (used for) capital and related financin
g
activities 0 (3,100)
Cash flows from investin
g
activities:
Collections for principal and interest on loans 26,933,904 23,480,099
Cash pa
y
ments for loans (22,949,550) (30,025,737)
Purchase of investments (816,761) (10,043,998)
Proceeds from securit
y
lendin
g
559 321
Securit
y
lendin
g
costs (188) (251)
Proceeds from sales or maturities of investments 9,835,095 1,076,000
Interest on investments 470,731 893,515
(Pa
y
ment for) refund from arbitra
g
e rebate tax 0 (43,105)
Net cash provided b
y
(used for) investin
g
activities 13,473,790 (14,663,156)
Net increase (decrease) in cash and cash equivalents 219,910 (20,482,678)
Cash and cash equivalents, Jul
y
1 9,230,138 29,712,816
Cash and cash equivalents, June 30 9,450,048 9,230,138
Reconciliation of net income to net cash (used for) operatin
g
activities:
Net operatin
g
(loss) income 39,116 (49,263)
Ad
j
ustments to reconcile net income to net cash (used for) operatin
g
activities
Depreciation 781 47
Interest on investments (403,540) (1,043,973)
Financin
g
income (3,132,033) (3,425,902)
Interest expense 3,213,257 4,082,405
Securit
y
lendin
g
income (559) (321)
Securit
y
lendin
g
expense 188 251
Arbitra
g
e rebate tax expense (Note 9) (20,343) 23,580
Chan
g
e in assets and liabilities:
(Increase) decrease in other assets 1,959 (4,995)
Increase (decrease) in other pa
y
ables (1,783) (7,358)
Increase (decrease) in due to other funds (508) (2,846)
Increase (decrease) in compensated absences pa
y
able (25,743) 7,858
Increase (decrease) in OPEB pa
y
ables (Note 10) 14,498 14,910
Total ad
j
ustments (353,826) (356,344)
Net cash (used for) operatin
g
activities $ (314,710) $ (405,607)
Schedule of noncash transactions:
Increase/(decrease) in fair value of investments $ 21,613
$ (147,098)
Total noncash transactions $ 21,613 $ (147,098)
The accompanying notes are an integral part of these financial statements.
STATE OF MONTANA BOARD OF INVESTMENTS ENTERPRISE FUND
STATEMENT OF CASH FLOWS FOR THE YEARS ENDED JUNE 30, 2009 AND 2008
A-63
This is trial version
www.adultpdf.com
STATE OF MONTANA BOARD OF INVESTMENTS ENTERPRISE FUND
NOTES TO FINANCIAL STATEMENTS
FOR THE FISCAL YEARS ENDED JUNE 30, 2009 AND JUNE 30, 2008
1. SUMMARY OF SIGNIFICANT ACCOUNTING POLICIES
a. Basis of Accounting
The Board uses the accrual basis of accounting for the Enterprise Fund. Under the accrual basis of accounting, expenses are
recorded when incurred and revenues are recorded when earned. The financial statements are prepared from the Statewide
Accounting, Budgeting, and Human Resource System (SABHRS) and information contained in the bond trustee statements.
The statements include the financial activity administered by the Board in the Enterprise Fund.
b. Presentation of Programs
The Board uses the Enterprise Fund to account for its programs created under the Economic Development Bond Act and the
Municipal Finance Consolidation Act.
Economic Development Bond Act programs include:
The Stand Alone Economic Development Bond Program provides access to limited economic development projects
through the issuance of conduit debt.
The Conservation Reserve Enhancement Program (CRP), created in 1990 by issuing bonds, allows farmers to receive
a lump sum payment by assigning their federal CRP contract to the Board. The farmers under contract must comply
with seeding and other requirements. The Conservation Reserve Enhancement Program is currently funded by the
Montana Trust Funds Bond Pool.
Municipal Finance Consolidation Act programs include:
The INTERCAP loan program provides funds to eligible Montana governments to finance capital expenditures for
up to fifteen years.
The Irrigation District Pooled Loan Program provided funds for the Board to purchase the refunding bonds from
participating irrigation districts for the purpose of prepaying the U.S. Department of Interior, Bureau of Reclamation
Projects Loans.
c. Fixed Asset Depreciation
The equipment fixed assets recorded in the Enterprise Fund are depreciated on a straight-line basis value, in accordance with
state policy.
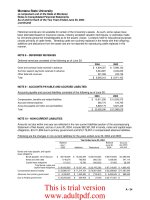
d. Receivables
The Enterprise Fund notes/loans receivables of $79,435,279 as of June 30, 2009 and $80,024,100 as of June 30, 2008, represent
loans made to Montana businesses, state and local governments. The Enterprise Fund notes/loans are classified in three
categories as follows:
1) Notes/loans receivable from local governments and Montana businesses
2) Interfund notes/loans receivable from state agency governments
3) Component Unit notes/loans receivable from certain state agencies and university units for which the State is
financially accountable.
The InterFund notes/loans receivable as of June 30, 2009 and 2008 includes $356,710 and $419,254, respectively, in interest
accruals from state agencies and university units.
e. Capitalized Cost of Issue
The Enterprise Fund capitalized cost of issue asset of $1,315,245 and $1,419,379 as of June 30, 2009 and June 30, 2008,
respectively, represents paid bond issuance costs which have been capitalized and are being amortized, using the straight-line
method over the life of the bonds.
A-64
This is trial version
www.adultpdf.com