Báo cáo hóa học: " Validation of the Korean version of the pediatric quality of life inventory™ 4.0 (PedsQL™) generic core scales in school children and adolescents using the rasch model" ppt
Bạn đang xem bản rút gọn của tài liệu. Xem và tải ngay bản đầy đủ của tài liệu tại đây (342.84 KB, 15 trang )
BioMed Central
Page 1 of 15
(page number not for citation purposes)
Health and Quality of Life Outcomes
Open Access
Research
Validation of the Korean version of the pediatric quality of life
inventory™ 4.0 (PedsQL™) generic core scales in school children
and adolescents using the rasch model
Seung Hee Kook*
1
and James W Varni
2
Address:
1
Department of Psychiatry, Chonnam National University Hospital, 8 Hak-dong, Dong-gu, Gwangju 501-757, South Korea and
2
Department of Pediatrics, College of Medicine, Department of Landscape Architecture and Urban Planning, College of Architecture, Texas A&M
University, 3137 TAMU, College Station, TX 77843-3137, USA
Email: Seung Hee Kook* - ; James W Varni -
* Corresponding author
Abstract
Background: The Pediatric Quality of Life Inventory™ (PedsQL™) is a child self-report and
parent proxy-report instrument designed to assess health-related quality of life (HRQOL) in
healthy and ill children and adolescents. It has been translated into over 70 international languages
and proposed as a valid and reliable pediatric HRQOL measure. This study aimed to assess the
psychometric properties of the Korean translation of the PedsQL™ 4.0 Generic Core Scales.
Methods: Following the guidelines for linguistic validation, the original US English scales were
translated into Korean and cognitive interviews were administered. The field testing responses of
1425 school children and adolescents and 1431 parents to the Korean version of PedsQL™ 4.0
Generic Core Scales were analyzed utilizing confirmatory factor analysis and the Rasch model.
Results: Consistent with studies using the US English instrument and other translation studies,
score distributions were skewed toward higher HRQOL in a predominantly healthy population.
Confirmatory factor analysis supported a four-factor and a second order-factor model. The analysis
using the Rasch model showed that person reliabilities are low, item reliabilities are high, and the
majority of items fit the model's expectation. The Rasch rating scale diagnostics showed that
PedsQL™ 4.0 Generic Core Scales in general have the optimal number of response categories, but
category 4 (almost always a problem) is somewhat problematic for the healthy school sample. The
agreements between child self-report and parent proxy-report were moderate.
Conclusion: The results demonstrate the feasibility, validity, item reliability, item fit, and
agreement between child self-report and parent proxy-report of the Korean version of PedsQL™
4.0 Generic Core Scales for school population health research in Korea. However, the utilization
of the Korean version of the PedsQL™ 4.0 Generic Core Scales for healthy school populations
needs to consider low person reliability, ceiling effects and cultural differences, and further
validation studies on Korean clinical samples are required.
Published: 2 June 2008
Health and Quality of Life Outcomes 2008, 6:41 doi:10.1186/1477-7525-6-41
Received: 11 June 2007
Accepted: 2 June 2008
This article is available from: />© 2008 Kook and Varni; licensee BioMed Central Ltd.
This is an Open Access article distributed under the terms of the Creative Commons Attribution License ( />),
which permits unrestricted use, distribution, and reproduction in any medium, provided the original work is properly cited.
Health and Quality of Life Outcomes 2008, 6:41 />Page 2 of 15
(page number not for citation purposes)
Background
Health-related quality of life (HRQOL) measures should
be based on patient's perceptions through self-assess-
ment, use understandable and age appropriate language,
provide evidence of acceptable or good reliability and
validity, assess multiple dimensions, and consist of a
'core' set of questions as well as a set of specific items for
different conditions. In addition, HRQOL measures
should be feasible; that is, they should be short so that
they may be administered repeatedly and easy to score
and analyze, be acceptable to patients by being inoffen-
sive, and be usable in a busy, clinical setting. Patients who
are ill become tired after 15–20 minutes and lengthy ques-
tionnaires can increase the risk of failure to complete
them or items near the end of a questionnaire [1].
The assessment of pediatric HRQOL is complicated by
developmental considerations and by questions regarding
the accuracy and acceptability of parent-proxy ratings of
patients' quality of life. The Pediatric Quality of Life
Inventory™ (PedsQL™) is a measure with demonstrated
reliability and validity for child self-report and parent
proxy-report. It has been developed to assess HRQOL in
children and adolescents from 2 to 18 years of age. It is
based on a modular approach with generic and disease-
specific instruments. As a generic instrument, the Ped-
sQL™ 4.0 Generic Core Scales are brief (23 items), practi-
cal (less than 4 minutes to complete), flexible (designed
for use with community, school, and clinical pediatric
populations), and multidimensional [2]. The PedsQL™
4.0 Generic Core Scales cover physical, emotional and
social functioning which are the core dimensions of
health as delineated by the World Health Organization
(WHO), as well as role (school) functioning.
The PedsQL™ 4.0 Generic Core Scales have previously
demonstrated evidence of feasibility, reliability and valid-
ity as a school population health measure in a U.S. sample
[3], as well as in numerous clinical populations [4-10].
These previous studies have demonstrated the reliability
and validity of PedsQL™ 4.0 Generic Core Scales using
Classical Test Theory (CTT). However, CTT has a limita-
tion that it is unable to estimate item difficulty and person
ability characteristics separately. Another limitation of
CTT is that it yields only a single reliability estimate and
corresponding standard error of measurement, but the
precision of measurement varies by ability level. Because
of these limitations, the CTT method is less than ideal for
applications that require item difficulty, person ability,
and conditional standard error of measurement [11].
Although CTT has served test development well over sev-
eral decades, Item Response Theory (IRT) has rapidly
become mainstream as the theoretical basis for measure-
ment [12]. IRT methods model the association between a
respondent's underlying level on a characteristic (latent
variable) and probability of a particular item response
using a non-linear monotonic function [13]. The Rasch
model [14], sometimes referred to as a one-parameter
logistic model under IRT, provides a mathematical frame-
work against which test developers can compare their
data. The model is based on the idea that useful measure-
ment involves examination of only one human attribute
at a time (unidimensionality) on a hierarchical "more
than/less than" line of inquiry. Person and item perform-
ance deviations from that line (fit) can be assessed, alert-
ing the investigator to reconsider item wording and score
interpretations from these data [15]. Additionally, the way
each rating scale is constructed has great influence on the
quality of data obtained from the scale [16], and a rating
scale may not be used by respondents in the way it was
intended by the developer of the scale [15]. Thus, the
assumptions about both the quality of the measures and
utility of the rating scale in facilitating interpretable meas-
ures should be tested empirically [15], which can be done
utilizing the Rasch model [17].
The PedsQL™ 4.0 Generic Core Scales have been linguisti-
cally validated in many different languages. However,
only local translations without linguistic validation have
been available in Korea [18]. This study aimed to assess
the psychometric properties of the Korean translation of
the PedsQL™ Generic Core Scales for Korean school chil-
dren and adolescents. The feasibility, reliability, construct
validity, and agreement between child self-report and par-
ent proxy-report were investigated based on previous Ped-
sQL™ 4.0 CTT methods [3,6-10]. Additionally, the person
and item reliability, item statistics and category function-
ing were assessed using the Rasch model [17].
Methods
Participants and settings
The Korean translations of PedsQL™ 4.0 Generic Core
Scales were administered to schoolchildren ages 8–18 and
their parents in 60 classes (28 elementary school classes,
16 middle school classes, and 16 high school classes) at 5
elementary schools, 5 middle schools, and 4 high schools
within two small cities, two metropolitan cities, and a cap-
ital city. Classes at schools were randomly selected within
grade. Trained research personnel visited each classroom
and distributed the questionnaires and informed parent
consent and child assent forms for students to take home
to their parents. Parents signed the informed consent and
completed the parent report surveys at home, then
returned them to school via students. Parents were asked
to return the surveys even if they chose not to consent to
participate. The students completed their questionnaire
after the parents gave informed consent. The consent rate
of all classes was above 70%.
Health and Quality of Life Outcomes 2008, 6:41 />Page 3 of 15
(page number not for citation purposes)
Measures
The Korean translations of the Pediatric Quality of Life Inventory™
Version 4.0(PedsQL™ 4.0) Generic Core Scales
The 23-item PedsQL™ 4.0 Generic Core Scales encompass:
(1) Physical functioning (8 items), (2) Emotional func-
tioning (5 items), (3) Social functioning (5 items), and
(4) School functioning (5 items). The PedsQL™ 4.0
Generic Core Scales are composed of parallel child self-
report and parent proxy-report formats. Child self-report
includes ages 5–7, 8–12, and 13–18. Parent proxy-report
includes ages 2–4 (toddler), 5–7 (young child), 8–12
(child), 13–18 (adolescent), and assesses parent's percep-
tion of their child's HRQOL. The items for each of the
forms are essentially identical, differing in the develop-
mentally appropriate language, or first or third person
tense. The instructions ask how much of a problem each
item has been during the past 1 month. A 5-point
response scale is utilized across child self-report for ages
8–18 and parent proxy-report (0 = never a problem; 1 =
almost never a problem; 2 = sometimes a problem; 3 =
often a problem; 4 = almost always a problem). Items are
reverse-scored and linearly transformed to 0–100 scale (0
= 100, 1 = 75, 2 = 50, 3 = 25, 4 = 0), so that higher scores
indicate better HRQOL. Scale scores are computed as the
sum of the items divided by the number of items
answered (this accounts for missing data). The physical
health summary score is the same as the physical func-
tioning subscale. To create the psychosocial health sum-
mary score, the mean is computed as the sum of the items
divided by the number of items answered in the emo-
tional, social, and school functioning subscales. If more
than 50% of the items in a scale are missing, the Scale
Score is not computed [3,19].
The PedsQL™ 4.0 Generic Core Scales were translated
independently into Korean by a clinical psychologist and
a social psychologist fluent in English and translated back
into English by a bilingual English native speaker. After
review and comments by the instrument author, the sec-
ond Korean translations of the PedsQL™ 4.0 Generic Core
Scales were tested on a panel of 13 school children with
cognitive interviewing methods. The cognitive interviews
were conducted by four certified clinical psychologists at
the participant's home and revisions in the translation
were conducted to rectify the identified problems. Finally,
the third versions were produced and proofread to be con-
sidered as final. All the results of phases were reported to
the instrument author and Mapi Research Institute, which
were reviewed and accepted by them.
The Korean translation of the PedsQL™ Family Information Form
The PedsQL™ Family Information Form [10] was com-
pleted by parents. The PedsQL™ Family Information Form
contains demographic information including the child's
date of birth, gender, race/ethnicity, and parental educa-
tion and occupation information. One survey question
asks the parent to report on the presence of a chronic
health condition ("In the past 6 months, has your child
had a chronic health condition?") defined as a physical or
mental health condition that has lasted or is expected to
last at least 6 months and interferes with the child's activ-
ities. If the parents check "Yes" to this question, they are
asked to write in the name of the chronic health condi-
tion.
This form also was translated independently into Korean
by two clinical psychologists fluent in English and trans-
lated back into English by a bilingual English native
speaker. After review and comment by the instrument
author, the Korean translations of the PedsQL™ Family
Information Form was revised and accepted by the instru-
ment author. All the results of phases were reported to the
instrument author and Mapi Research Institute.
Statistical analysis
The feasibility of the PedsQL™ 4.0 Generic Core Scales as
a school health measure was determined from the per-
centage of missing values for each item and distribution of
item responses [20,21]. Range of measurement was fur-
ther tested based on the percentage of scores at the
extremes of the scaling range, that is, the maximum possi-
ble score (ceiling effect) and the minimum possible score
(floor effect) [21]. Scale descriptives for child self-report
and parent proxy-report were calculated using SPSS Ver-
sion 13.0 for Windows.
Factor structure of the PedsQL™ 4.0 Generic Core Scales
across age group was examined by a confirmatory factor
analysis (CFA) of items with missing data, using the soft-
ware Mplus [22]. The missing data option in Mplus was
implemented to avoid list-wise deletion. Factor indicators
were stated as categorical variables due to ceiling effect
and the estimator was weighted least square parameter
estimates using a diagonal weighted matrix with standard
errors and mean-and variance-adjusted chi-square test sta-
tistic (WLSMV). WLSMV is one of the estimators that are
robust to non-normality and involves the analysis of a
matrix of polychoric correlations. The PedsQL™ four-fac-
tor model was tested, which consisted of physical, emo-
tional, social, and school functioning factor. Additionally,
the PedsQL™ second-order factor model was tested, which
consisted of physical health and psychosocial health fac-
tors. Psychosocial health factor was the second-order fac-
tor, which consisted of three first-order factors including
emotional, social and school functioning factor. The
physical health factor is the same as the Physical Func-
tional Scale.
The fit of models was evaluated by Chi-square statistic and
fit indices including the Comparative Fit Index (CFI) [23],
Health and Quality of Life Outcomes 2008, 6:41 />Page 4 of 15
(page number not for citation purposes)
Tuker-Lewis Index (TLI) [24], and Root Mean Square Error
of Approximation (RMSEA) [25]. Chi-square is a test of
exact fit. With large samples, there is considerable power
to reject the null hypotheses, even though the model may
fit the data well. Therefore, other goodness of fit indices
should be considered. The CFI [23] and TLI [24] both are
incremental fit indices, ranging from 0 (indicating poor
fit) to 1.00 (indicating a perfect fit) and are derived from
the comparison of a restricted model with a null model.
For two indices, a value greater than .90 indicates a psy-
chometrically acceptable fit to the data. More recent liter-
ature suggests that high values greater than or equal to .95
indicate a good fit [26]. RMSEA is one of absolute fit indi-
ces and a measure of discrepancy between the observed
and model implied covariance matrices adjusted for
degrees of freedom. The values of RMSEA of .05 or less
indicate close fit, less than .08 indicates a fair or reasona-
ble fit, less than .10 indicates a mediocre fit, and greater
than .10 indicates an unacceptable fit [25].
Construct validity was further determined utilizing the
known-groups method. The known-groups method com-
pares scale scores across groups known to differ in the
health construct being investigated. In this study, groups
differing in health status (healthy vs. chronic health con-
dition groups) were compared, using t-tests. In order to
determine the magnitude of the differences between
healthy children and children with chronic health condi-
tions, effect sizes were calculated [27]. Effect size as uti-
lized in these analyses was calculated by taking the
difference between the healthy sample mean and the
chronic health condition sample mean, divided by the
healthy sample standard deviation.
The person and item reliability, item statistics, and cate-
gory functioning were assessed by the Rasch rating scale
model (RSM) [28], using WINSTEPS [29]. The Rasch RSM
analyses were conducted on the four subscales of child
self-report and parent proxy-report. The Rasch model [17]
can be generalized to polytomous items with ordered cat-
egories. The formulation of an extended Rasch model
includes Partial Credit Model (PCM) [30] and Rating
Scale Model (RSM) [31]. Given that Likert scales can be
modeled according to either a PCM or a RSM, it is neces-
sary to determine which polytomous Rasch model and its
respective set of estimated parameters would best explain
the data. To choose an appropriate model, several esti-
mates obtained from the PCM and RSM are compared on
the scales. For this study, a more parsimonious model, the
RSM was chosen because the two models produced com-
parable person and item fit, reliability estimates.
The person reliability indicates the replicability of person
ordering we would expect if this sample of persons were
to be given another set of items measuring the same con-
struct [28]. Analogous to Cronbach's alpha, it is bounded
by 0 and 1. Person separation index is an estimate of the
spread or separation of persons on this measured variable.
Item reliability index is the estimate of the replicability of
item placement within a hierarchy of items along the
measured variable if these same items were to be given to
another sample of comparable ability. Analogous to
Cronbach's alpha, it is bounded by 0 and 1. The item sep-
aration index is an estimate of the spread or separation of
items on the measured variable. It is expressed in standard
error units. The person and item separation should be at
least 2, indicating that the measure separated persons,
items, or both into at least two distinct groups [15].
To check if items fit the model's expectation, item fit mean
square (MNSQ) statistics were computed using the RSM.
MNSQ determines how well each item contributes to
defining one common construct. Item MNSQ values of
about 1.0 are ideal and values greater than 1.4 may indi-
cate a lack of construct homogeneity with other items in a
scale and item MMSQ values smaller than 0.6 may indi-
cate item redundancy [32]. However, the cutoff values
tend to vary depending on the purpose for which the rat-
ings are used [33]. Typically, two MNSQ statistics are
used: infit (weighted) and outfit (unweighted) statistics.
Infit is more sensitive to misfitting responses to items near
the person's ability level, while outfit is sensitive to misfit-
ting items that are further away [34].
It is often the case that respondents fail to react to a rating
scale in the manner the test constructor intended [35].
Because it is always uncertain how a rating scale was used
by a sample, an investigation of the functioning of the rat-
ing scale is always necessary [36] and can be done with the
Rasch analysis. The rating scale diagnostics include cate-
gory frequencies, average measures, threshold estimates,
probabilities, and category fit. These diagnostics should
be used in combination [15]. Average measure are defined
as the average of the ability estimates for all persons in the
sample who choose that particular response category,
with the average calculated across all observations in that
category [37]. They increase monotonically, indicating
that on average, those with higher abilities/stronger atti-
tudes endorse the higher categories, whereas those with
lower abilities/weaker attitudes endorse the lower catego-
ries [15]. Because observations in higher categories must
be produced by higher measures, the average measures
across categories must increase monotonically. Fit statis-
tics provide another criterion for assessing the quality of
rating scales. Outfit mean squares greater than 1.3 indi-
cate more misinformation than information, meaning
that the particular category is introducing noise into the
measurement process. The step measures or thresholds
define the boundaries between categories. Thresholds too
should increase monotonically [38]. Thresholds not
Health and Quality of Life Outcomes 2008, 6:41 />Page 5 of 15
(page number not for citation purposes)
increasing monotonically across the rating scale are con-
sidered disordered [15].
Finally, agreement between child self-report and parent
proxy-report was determined through two-way mixed
effect model (absolute agreement, single measure) Intrac-
lass Correlations (ICC) [39]. The ICC offers an index of
absolute agreement given that it takes into account the
ratio between subject variability and total variability
[39,40]. Intraclass Correlations (ICC) are designated as ≤
0.40 poor to fair agreement, 0.41–0.60 moderate agree-
ment, 0.61–0.80 good agreement, and 0.81–1.00 excel-
lent agreement [41]. Statistical analyses were conducted
using SPSS Version 13.0 for Windows.
Results
Sample characteristics
The overall response rate was 70.9%. The response rate for
the elementary school survey (grades three through six)
was 71.0%. The response rate for the middle and high
schools was 70.8. A total 1453 of parent-child dyads com-
pleted the Korean translations of PedsQL™ 4.0 Generic
Core Scales and the Korean translations of PedsQL™ Fam-
ily Information Form. Child self-reports for 1425 (98.1%)
children were available since 28 (1.9%) child self-reports
had more than 50% missing items in the scale. Parent
proxy-reports for 1431 (98.5%) parents were available
since 22 (1.5%) parent proxy-reports had more 50% miss-
ing items in the scale. There were 633 (44.4%) child self-
reports and 638 (44.6%) parent proxy-reports for ages
8–12. There were 792 (55.6%) adolescent self-reports and
793 (55.4%) parent proxy-reports for ages 13–18.
The number of boys (n = 644, 45.2%) was less than the
number of girls (n = 781, 54.8%; missing = 28, 1.9%). The
race/ethnicity of the total sample was Asian. Respondents
of parent self-report consisted of mother (n = 1250,
86.0%), father (n = 159, 10.9%), grandmothers (n = 5,
0.3%), grandfathers (n = 3, 0.2%), guardians (n = 1,
0.1%), and others (n = 12, 0.8%; missing = 23, 1.6%). Of
the respondents, mothers' education level was 6
th
grade or
less (n = 16, 1.3%), 7
th
through 9
th
grade or less (n = 55,
4.4%), 10
th
to 12
th
grade or less (n = 609, 48.7%), some
college or certification course (n = 153, 12.2%), college
graduate (n = 358, 28.6%), graduate or professional
degree (n = 32, 2.6%; missing = 27, 2.2%). Of the
respondents, fathers' education level was 6
th
grade or less
(n = 4, 2.5%), 7
th
through 9
th
grade or less (n = 8, 5.5%),
10
th
to 12
th
grade or less (n = 55, 34.0%), some college or
certification course (n = 13, 8.2%), college graduate (n =
64, 40.3%), graduate or professional degree (n = 11,
6.9%; missing = 5, 3.1%). The sample included 1396
(96.1%) healthy children and 50 (3.4%; missing = 7,
0.5%) children whose parents reported the presence of
chronic health condition in the past 6 months.
Feasibility
The percentage of missing item responses was less than
1.7% for child self-report and 1.4% for parent proxy-
report.
Descriptive statistics
For child self-report and parent proxy-report, all items
were negatively skewed and 12 items showed skewness
greater than -2. Table 1 presents the Cronbach's alphas,
means, standard deviations, range, and percent of floor
Table 1: Scale descriptives for PedsQL™ 4.0 Generic Core Scales: Child self-report and parent proxy-report
Scale Scale descriptives
Number of items N α Mean SD Range %Floor %Ceiling
Child self-report
Total Score 23 1396 .90 87.93 10.90 35.87–100 0.0 13.3
Physical Health 8 1405 .79 88.14 12.62 15.63–100 0.0 26.4
Psychosocial Health 15 1415 .87 87.73 11.72 20.00–100 0.0 18.6
Emotional Functioning 5 1418 .83 82.58 18.79 0.00–100 0.1 32.4
Social Functioning 5 1422 .82 93.47 11.31 25.00–100 0.0 60.8
School Functioning 5 1423 .72 87.07 13.10 20.00–100 0.0 30.6
Parent proxy-report
Total Score 23 1399 .90 90.33 9.68 47.83–100 0.0 20.3
Physical Health 8 1415 .80 91.71 11.02 37.50–100 0.0 41.3
Psychosocial Health 15 1412 .88 89.52 10.64 43.33–100 0.0 25.4
Emotional Functioning 5 1422 .83 84.26 16.56 20.00–100 0.0 35.6
Social Functioning 5 1427 .88 89.31 12.40 15.00–100 0.0 69.3
School Functioning 5 1428 .75 89.29 12.39 30.00–100 0.0 41.3
α = Cronbach's alpha. % Floor/ceiling = percentage of scores at the extremes of the scaling range. Higher scores equal better health-related quality
of life.
Health and Quality of Life Outcomes 2008, 6:41 />Page 6 of 15
(page number not for citation purposes)
and ceiling effect of the PedsQL™ 4.0 Generic Core Scales
for total sample. Cronbach's alpha coefficients for child
self-report and parent proxy-report all exceeded the mini-
mum reliability standard of .70. The alpha values were
higher for the total score and lower for the school func-
tioning scale of child self-report and parent proxy-report.
Scale means all were higher than those of the PedsQL™
school study [3]. The full range of 0–100 was used for the
emotional functioning scale of child self-report. The range
of 40–100 was used for the total score and psychosocial
health scale of parent proxy-report. There were essentially
no floor effects. However, moderate to high ceiling effects
existed in the majority of scales, except for the total score
of child self-report. Especially, notable ceiling effects were
found in the social functioning scale of child self-report
and parent proxy-report in this mostly healthy sample.
Validity
Table 2 shows the goodness-of fit indices for four- and sec-
ond-order factor model in the PedsQL™ 4.0 Generic Core
Scales. All Chi-square statistics were significant and indi-
cated a poor fit. For child self-report and parent proxy-
report, the CFI approximated or exceeded the .90 stand-
ards of acceptable model fit and the TLI exceeded the .95
value of good model fit. For parent proxy-report ages
13–18, the CFI exceeded the .95 value of good model fit
and the RMSEA was less than .08 that indicates a fair fit.
For other scales, the RMSEA generally were greater than
.08 but less than .09, those indicate a mediocre fit.
Table 3 and 4 show the factor loadings and covariances for
the four-factor and the second-order factor model across
age group. As can be seen, all loadings are over .60, which
indicates that the items and first-order factor fit well with
their respective factors and their second-order factor. The
covariances were relatively high, suggesting all scales are
correlated across age group.
Table 5 contains the PedsQL™ 4.0 scores for healthy chil-
dren and children with a chronic health condition within
the sample. Consistent with previous findings [3,10] with
the PedsQL™ 4.0, healthy children scored significantly
higher on the PedsQL™ 4.0 (better HRQOL) than children
with a chronic health condition in the scales. The only
exception was on the social functioning scale of child self-
report.
Person and item reliability
Table 6 shows the reliability and separation index for per-
sons and items across the four subscales. Person reliability
and separation are low while Item reliability and separa-
tion are high. These results indicate that the sample has a
narrow spread and the sample size is large enough.
Item statistics
Table 7 shows item infit and outfit statistics on the four
subscales. The majority of items showed mean square infit
and outfit statistics within the 0.6 and 1.4 range, save for
item 5 (Hard to take a bath or shower) of the physical
health scale and item 3 (Teased) of the social functioning
scale for child self-report.
Rating scale diagnostics
Table 8 shows average measures, infit and outfit MNSQ,
and step measures on the four subscales. The average
measures in all scales of child self-report and parent
proxy-report increase monotonically across the rating
scale. They function as expected and indicate that, on aver-
age, persons with higher measures selected higher catego-
ries. Most infit and outfit are close to 1.00 or a little below
except category 4. The people who chose each category
accord with the people we would expect to choose those
categories. Somewhat problematic is the infits or the out-
fits for category 4 in the physical, social and school func-
tioning of child self-report and all subscales of parent
proxy-report. This indicates that persons with low meas-
Table 2: Goodness-of-fit indices for four- and second-order factor model in the PedsQL™ 4.0 Generic Core Scales: Child self-report
and parent proxy-report
Scale Four-factor model Second-order factor model
χ
2
df CFI TLI RMSEA χ
2
df CFI TLI RMSEA
Child self-report
Total (N = 1425) 1114.051* 98 .897 .961 .085 1055.771* 96 .902 .962 .084
Ages 8–12 (N = 633) 469.769* 92 .906 .955 .081 472.812* 92 .905 .955 .081
Ages 13–18 (N = 792) 535.513* 77 .934 .972 .087 490.199* 74 .940 .974 .084
Parent proxy-report
Total (N = 1431) 826.681* 77 .942 .974 .082 806.168* 77 .944 .975 .081
Ages 8–12 (N = 638) 410.812* 68 .938 .968 .089 417.768* 68 .936 .967 .090
Ages 13–18 (N = 793) 399.522* 67 .959 .980 .079 376.245* 66 .962 .981 .077
CFI = Comparative fit index. TLI = Tuker-Lewis index. RMSEA = Root mean square error of approximation. *p < .00001.
Health and Quality of Life Outcomes 2008, 6:41 />Page 7 of 15
(page number not for citation purposes)
ures unexpectedly selected this high category. Step meas-
ures indicate the structure of the category probability
curves in as sample-independent manner as possible.
They are advancing, and show a structure of a "range of
hills" in physical, emotional, and school functioning of
child self-report and parent-proxy-report. However, step
measures 3 and 4 are disordered in social functioning of
child self-report and parent proxy-report.
Table 3: Factor loadings of items for four-factor model in the PedsQL™ 4.0 Generic Core Scales: Child self-report and parent proxy-
report
Factor and item Child self-report Parent proxy-report
Total Ages 8–12 Ages 13–18 Total Ages 8–12 Ages 13–18
Physical Health
1. Hard to walk more than one block .751 .749 .785 .809 .813 .808
2. Hard to run .819 .784 .857 .867 .815 .902
3. Hard to do sports or exercise .846 .785 .899 .872 .814 .913
4. Hard to lift something heavy .746 .696 .805 .822 .791 .845
5. Hard to take a bath or shower .623 .606 .683 .762 .762 .811
6. Hard to do chores around house .694 .699 .718 .786 .795 .797
7. Hurt or ache .719 .649 .769 .748 .757 .753
8. Low energy .653 .642 .691 .670 .729 .678
Emotional Functioning (.823) (.818) (.824) (.840) (.849) (.835)
1. Feel afraid or scared .794 .694 .872 .815 .800 .837
2. Feel sad or blue .857 .786 .896 .872 .851 .889
3. Feel angry .813 .751 .855 .813 .814 .815
4. Trouble sleeping .724 .706 .738 .727 .690 .755
5. Worry about what will happen .777 .714 .831 .796 .776 .821
Social Functioning (.827) (.856) (.813) (.833) (.828) (.841)
1. Trouble getting along with peers .893 .833 .931 .910 .895 .925
2. Other kids not wanting to be friends .889 .843 .928 .917 .915 .922
3. Teased .699 .657 .766 .846 .833 .869
4. Doing things other peers do .822 .823 .825 .896 .902 .900
5. Hard to keep up when play with others .862 .836 .879 .894 .873 .907
School Functioning (.722) (.760) (.726) (.739) (.732) (.764)
1. Hard to pay attention .806 .787 .813 .857 .836 .872
2. Forget things .756 .682 .794 .784 .756 .807
3. Trouble keeping up with schoolwork .780 .763 .784 .819 .822 .830
4. Miss school-not well .838 .810 .858 .874 .886 .863
5. Miss school to go to doctor or hospital .853 .832 .860 .892 .898 .879
Numbers in parentheses are factor loadings of subscale on psychosocial health of second-order factor.
Table 4: Covariances of factors for four factor model and second-order factor model in the PedsQL™ 4.0 Generic Core Scales: Child
self-report and parent proxy-report
Scale and Factor Total Ages 8–12 Ages 13–18
Physical Emotional Social Physical Emotional Social Physical Emotional Social
Child self-report
Psychosocial (.799) (.835) (.786)
Emotional .672 .719 .656
Social .659 .666 .688 .690 .641 .658
School .559 .591 .621 .626 .576 .698 .555 .601 .607
Parent proxy-report
Psychosocial (.758) (.733) (.775)
Emotional .660 .668 .656
Social .622 .688 .581 .680 .651 .695
School .544 .608 .544 .507 .589 .658 .582 .637 .652
Numbers in parentheses are covariances between physical health factor and psychosocial health factor of second-order factor.
Health and Quality of Life Outcomes 2008, 6:41 />Page 8 of 15
(page number not for citation purposes)
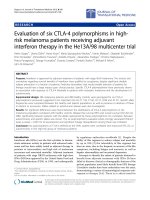
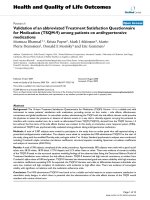
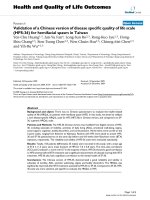
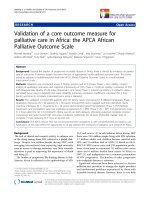
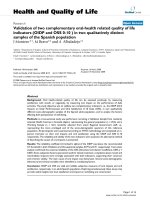
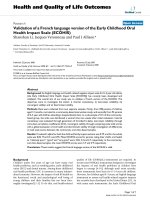
For child self-report and parent proxy-report, the RSM cat-
egory probability curves are shown in Figures 1, 2, 3 and
4. There are 5 curves visible for each scale, starting from
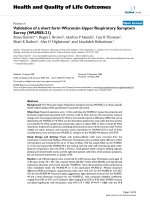
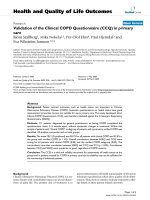
the left. They in general depict the expected succession of
"hills". However, the disordered step measures 3 and 4 in
social functioning scales of child self-report and parent
proxy-report also are reflected in the probability curves. As
shown in Figure 3, the cross-over between the curves for
category 3 and 4 is to the left of that for category 2 and 3
in social functioning scales of child-self-report and parent
proxy-report.
Parent/child agreement
Table 9 shows the ICCs between PedsQL™ 4.0 child self-
report and parent proxy-report. For the total sample, ICCs
were higher for total score and psychosocial health scales
and lower for physical health scale. For children ages
8–12, ICCs were higher for school functioning scale and
lower for physical health scale and social functioning
scale. For adolescents ages 13–18, ICCs were higher for
total score and psychosocial health scale and lower for
physical health scale and social functioning scale. How-
ever, the range of ICCs was between .47 and .61 across the
ages. These results suggest moderate agreement. In partic-
ular, there was good agreement for the total score of ages
13–18. Furthermore, the results indicate a trend towards
higher ICCs with increasing age, save for the school func-
tioning scale.
Discussion
The purpose of this study was to assess the psychometric
properties of the Korean translation of the PedsQL™ 4.0
Generic Core Scales in school children and adolescents
ages 8–18. Like in the school study with the original U.S.
English instrument [3] and other translation studies
[4,42,43], items on the PedsQL™ 4.0 had minimal missing
responses. It suggests that children and parents are willing
and able to provide good quality data regarding the child's
HRQOL [3].
There were no floor effects and moderate to high ceiling
effects, especially for social functioning scales, which
showed notable ceiling effects. These findings might be
expected for a healthy school-age population. Responsive-
ness is an important measurement property in a clinical
Table 5: Scale descriptives for PedsQL™ 4.0 Generic Core Scales child self-report and parent proxy-report: Healthy sample and
chronic condition sample
Scale Healthy sample Chronic health condition sample Difference Effect size t score
NMeanSD N Mean SD
Child self-report
Total Score 1341 88.16 10.74 48 81.23 13.53 6.93 0.65 -4.35***
Physical Health 1350 88.44 12.33 48 79.49 16.96 8.95 0.73 -4.87***
Psychosocial Health 1359 87.93 11.61 49 81.94 13.52 5.99 0.52 -3.53***
Emotional Functioning 1362 82.91 18.52 49 73.27 23.73 9.64 0.52 -3.55***
Social Functioning 1366 93.55 11.28 49 90.51 12.34 3.04 0.23 -1.85
School Functioning 1367 87.22 13.00 49 82.04 15.44 5.18 0.40 -2.72**
Parent proxy-report
Total Score 1347 90.56 9.47 47 83.67 12.88 6.88 0.73 -4.83***
Physical Health 1362 92.02 10.75 48 82.62 14.87 9.40 0.87 -5.87***
Psychosocial Health 1360 89.70 10.49 47 84.08 13.49 5.62 0.54 -3.58***
Emotional Functioning 1370 84.43 16.40 47 78.40 20.14 6.03 0.37 -2.46*
Social Functioning 1373 94.97 10.15 49 91.63 12.05 3.34 0.33 -2.25*
School Functioning 1369 89.58 12.18 49 82.14 16.04 7.44 0.61 -4.15***
Effect sizes are designated as small (0.20), medium (0.50), and large (0.80). *p < .05. **p < .01.***p < .0001.
Table 6: Reliability and separation index for PedsQL™ 4.0
Generic Core Scales: Child self-report and parent proxy-report
(Total sample only)
Scale and index Child self-report Parent proxy-report
Person Item Person Item
Physical Health
Reliability .54 1.00 .49 .99
Separation 1.09 15.71 .99 13.81
Emotional Functioning
Reliability .59 .99 .60 .99
Separation 1.20 9.58 1.24 12.67
Social Functioning
Reliability .40 .95 .59 .97
Separation .82 4.44 1.20 5.56
School Functioning
Reliability .45 1.00 .44 1.00
Separation .91 19.55 .89 16.78
Health and Quality of Life Outcomes 2008, 6:41 />Page 9 of 15
(page number not for citation purposes)
trial, and one of the factors that can affect responsiveness
is floor and ceiling effect [19]. However, detecting
improving health among persons who are already quite
well may prove difficult because of ceiling effects, and
most school children are quite healthy [3]. The presence
of ceiling effects may be expected in generic HRQOL
instruments since they are designed to be applicable to a
wide range of populations [44]. Thus, the findings can be
a reflection of the sample characteristics, i.e., a healthy
school population. Although most children are quite
healthy, measuring HRQOL in large school populations
has several distinct benefits. It can aid in identifying sub-
groups of children who are at risk for health problem, in
determining the burden of a particular disease or disabil-
ity, and informing efforts aimed at prevention and inter-
vention [45]. In addition, utilization of HRQOL measures
may assist in the evaluation of the healthcare needs of a
school district, and results can be used to inform public
policy, including the development of strategic healthcare
plans and school health clinics, identifying health dispar-
ities, promoting policies and legislation related to school
health, and aiding in the allocation of health care
resources [46].
On the other hand, it has been suggested that concepts
and measures from the more positive end of the HRQOL
continuum are needed for healthy populations [47] and
inclusion of emotional well-being, positive affect, vitality,
and health perceptions aid in discriminating and measur-
ing change in well populations [48]. Even though the
items of PedsQL™ 4.0 are reverse-scored and higher score
indicate better HRQOL, the instructions ask how much of
a problem each item has been during the past 1 month. In
other words, the interaction between sample characteris-
tics and the focus on "problems" in the items and instruc-
tions of PedsQL™ 4.0 might cause such ceiling effects in a
healthy sample. Finally, in the Korean culture, individuals
who have good interpersonal relationships tend to be
regarded as having a good personality and virtue, which
may lead to some social desirability responding on social
functioning items, leading to notable ceiling effects. Com-
pared with other translation studies [43,49], these poten-
tial cultural differences require further research using a
wide range of the Korean population, including healthy
and chronically ill children and adolescents to more fully
understand cultural differences.
Table 7: Item statistics for PedsQL™ 4.0 Generic Core Scales: Child self-report and parent proxy-report (Total sample only)
Factor and item Child self-report Parent proxy-report
Infit MNSQ Outfit MNSQ Infit MNSQ Outfit MNSQ
Physical Health
1. Hard to walk more than one block 1.00 .73 .97 .59
2. Hard to run .89 .87 .95 .84
3. Hard to do sports or exercise .88 .71 .96 .88
4. Hard to lift something heavy .92 .92 .81 .75
5. Hard to take a bath or shower 1.43 1.00 1.15 1.06
6. Hard to do chores around house 1.08 .99 1.01 1.00
7. Hurt or ache 1.16 1.05 1.19 .99
8. Low energy 1.29 1.26 1.33 1.30
Emotional Functioning
1. Feel afraid or scared .92 .92 .99 .98
2. Feel sad or blue .79 .75 .73 .70
3. Feel angry .93 .93 .95 .93
4. Trouble sleeping 1.34 1.28 1.32 1.29
5. Worry about what will happen 1.09 1.10 1.07 1.11
Social Functioning
1. Trouble getting along with peers .77 .77 1.00 .99
2. Other kids not wanting to be friends .76 .80 .81 .80
3. Teased 1.44 1.41 1.22 1.23
4. Doing things other peers do 1.08 1.11 .97 1.05
5. Hard to keep up when play with others .93 .92 1.02 .95
School Functioning
1. Hard to pay attention .84 .84 .86 .85
2. Forget things 1.03 1.01 1.07 1.06
3. Trouble keeping up with schoolwork 1.08 .97 .95 .93
4. Miss school-not well 1.17 1.17 1.15 1.07
5. Miss school to go to doctor or hospital 1.10 .97 1.14 1.08
Infit = Information-weighted fit statistic. Outfit = Outlier-sensitive fit statistic. MNSQ = Mean-square statistic with expectation 1.
Health and Quality of Life Outcomes 2008, 6:41 />Page 10 of 15
(page number not for citation purposes)
The CFA on the PedsQL™ 4.0 Generic Core Scales sup-
ported a four-factor model and a second-order factor
model. It suggests the statistical evidence that the Ped-
sQL™ 4.0 Generic Core Scales cover the core dimensions
of health as delineated by the WHO and have construct
validity for the utilization of five summary and scale
scores.
Children with chronic health conditions were reported to
experience lower physical, emotional, and school func-
tioning in comparison to healthy children. This indicates
that PedsQL™ 4.0 Generic Core Scales can differentiate
HRQOL in healthy children as a group in comparison to
children with chronic health conditions. However, there
was no significant difference on the social functioning
scale between healthy and unhealthy children in this
study, even though the social functioning of the children
with chronic health conditions was lower than that of the
healthy children. In the previous PedsQL™ school study in
the US [3], there was a statistically significant difference
on the social functioning scale between healthy and
unhealthy children. Comparisons to the mean scores of
the other subscales within the present study to those of
the previous PedsQL™ school study [3], the mean scores
on the social functioning scale of both healthy children
and unhealthy children were very high. Therefore, non-
significant difference on the social functioning of child
self-report should be further studied in Korean samples,
especially when compared to clinical populations with
larger sample sizes of chronically ill children with physi-
cian-diagnosed chronic health conditions. This compari-
son is essential because the type and severity of chronic
health conditions did not have a significant impact on the
social functioning of the children who participated in the
present study. In addition, it should be noted that it might
be caused by social desirability and cultural differences in
Korean populations.
Rasch RSM analysis on the four subscales of PedsQL™ 4.0
Generic Core Scales show that person reliability and sep
Table 8: Category measures and fit for PedsQL™ 4.0 Generic Core Scales: Child self-report and parent proxy-report (Total sample
only)
Scale and
category label
Child self-report Parent proxy-report
Average
Measure
Infit MNSQ Outfit MNSQ Step measure Average
measure
Infit MNSQ Outfit MNSQ Step measure
Physical Health
0 -29.26 1.01 1.01 None -32.57 1.02 1.02 None
1 -16.10 .97 .69 -12.66 -18.64 .90 .63 -14.97
2 -9.31 1.04 1.02 -8.91 -10.51 1.04 .97 -11.26
3 -1.81 1.10 1.21 7.61 -3.90 1.33 1.60 9.84
4 1.99 1.53 1.59 13.97 10 1.76 2.13 16.29
Emotional
Functioning
0 -23.63 1.02 1.02 None -32.14 .98 .99 None
1 -14.99 .92 .90 -15.95 -20.52 .98 .99 -24.84
2 -7.05 .97 .96 -8.62 -9.41 .95 .96 -12.54
3 1.52 .92 .98 8.25 1.94 1.04 1.07 13.31
4 6.37 1.33 1.34 16.32 2.91 1.93 2.01 24.07
Social
Functioning
0 -29.17 1.02 .99 None -43.57 .98 .92 None
1 -19.01 .90 .93 -21.40 -25.79 .86 .91 -35.72
2 -9.12 1.02 1.03 -1.46 -9.49 1.10 1.14 13
3 -1.28 1.03 1.06 12.34 7.99 .93 1.03 21.80
4 2.73 1.30 1.54 10.52 9.87 1.94 3.23 14.05
School
Functioning
0 -36.90 1.03 1.02 None -39.70 .99 .99 None
1 -20.95 .94 .91 -23.84 -23.79 .91 .85 -27.76
2 -9.14 1.01 1.03 -8.79 -11.59 1.05 1.15 -10.98
3 1.84 .97 .98 13.00 -1.87 1.14 1.16 13.86
4 8.93 1.38 1.43 19.63 3.83 1.40 1.45 24.89
Infit = Information-weighted fit statistic. Outfit = Outlier-sensitive fit statistic. MNSQ = Mean-square statistic with expectation 1. 0 = never a
problem. 1 = almost never a problem. 2 = sometimes a problem. 3 = often a problem. 4 = almost always a problem.
Health and Quality of Life Outcomes 2008, 6:41 />Page 11 of 15
(page number not for citation purposes)
Response Functions for 5 categories: Physical HealthFigure 1
Response Functions for 5 categories: Physical Health.
&KLOGVHOIUHSRUW 3DUHQWSUR[\UHSRUW
Response Functions for 5 categories: Emotional FunctioningFigure 2
Response Functions for 5 categories: Emotional Functioning.
&KLOGVHOIUHSRUW 3DUHQWSUR[\UHSRUW
Health and Quality of Life Outcomes 2008, 6:41 />Page 12 of 15
(page number not for citation purposes)
aration are low, while item reliability and separation are
high. As we mentioned earlier, these results indicate that
the sample has a narrow spread and the sample size is
large enough. Person reliability refers to the replicability
of person placement across other items measuring the
same construct. Item reliability refers to the replicability
of item placement within the hierarchy across other sam-
ples [28]. The chief influences on person reliability are
sample "true" standard deviation, test length, number of
categories per item, and test targeting sample [50]. In this
study, test lengths of each subscale are adequate in length
and number of categories per item is sufficient. Person
reliability is a characteristic of the person measures for the
sample being tested. To increase person reliability, testing
persons with more extreme abilities or attitudes and
improving the test targeting may be slightly helpful. Ped-
sQL™ 4.0 Generic Core Scales have been originally devel-
oped for targeting clinical samples. Considering the
predominantly healthy characteristics of this study sam-
ple, most of the PedsQL™ 4.0 Generic Core Scales items
might be too "severe" for healthy school populations in
Korea. On the other hand, it should be noted that internal
consistency reliability alpha coefficients presented in
Table 1 were between .72 and .90. However, raw-score
based reliabilities (e.g., Cronbach's alpha) in general over-
state the "true" reliability while the Rasch reliabilities
understate the "true" reliability [51]. Therefore, further
studies on clinical samples are needed to find out what
exactly caused low person reliability in Korean samples.
According to the results of item statistics, all items of the
subscales were found to represent a homogenous con-
struct and it has been already confirmed by CFA as well.
Rating scale diagnostics to identify the optimal categoriza-
tion showed that category 4 is somewhat problematic as
well as step measures 3 and 4 are disordered in the social
functioning scale of child self-report and parent proxy-
report. These results indicate a low probability of observ-
ance of certain categories, i.e., category 4 (almost always a
problem) seems not to work as intended for this healthy
school sample in Korea.
The pattern of parent-child correlation for the total sam-
ple, child ages 8–12, and adolescent ages 13–18 was dif-
ferent from those of the PedsQL™ 4.0 school population
study [3] and the UK-English version study on the Ped-
sQL™ 4.0 Generic Core Scales [49], where better correla-
tion was found for physical than for psychological and
social functioning. While it might be expected that the
intercorrelations between child and parent report across
the physical, emotional, social and school functioning
scales would follow the conceptualization that more
observable domains (i.e., physical functioning) would
yield higher agreement, this has not necessarily been the
case in the published literature with other HRQOL instru-
Response Functions for 5 categories: Social FunctioningFigure 3
Response Functions for 5 categories: Social Functioning.
&KLOGVHOIUHSRUW 3DUHQWSUR[\UHSRUW
Health and Quality of Life Outcomes 2008, 6:41 />Page 13 of 15
(page number not for citation purposes)
ments. A comprehensive review [52] found mixed results
in terms of higher intercorrelations between self and
proxy reports of physical functioning across pediatric
HRQOL instruments, with most studies demonstrating
this effect, while some others did not. In addition, it was
suggested that levels of agreement can be affected by child
age, domains investigated, and parent's own QOL [40].
On the other hand, all the ICCs between PedsQL™ 4.0
child self-report and parent proxy-report showed moder-
ate agreement and a general trend towards higher agree-
ments with increasing age. The ICCs were consistently
higher than those of the PedsQL™ 4.0 school population
study [3], despite the fact that the ICC values of this study
were derived using absolute agreement type while the
PedsQL™ 4.0 school population study used consistency
type. In situations where children are unable or unwilling
to respond for themselves, measurement of QOL is often
obtained by parent proxy-report [40]. Thus, these consist-
encies between child self-report and parent proxy-report
suggest that parent proxy-report can be informative for
measuring HRQOL of children when they are not able to
respond. The trend towards higher agreement with
Table 9: Agreement between PedsQL™ 4.0 Generic Core Scales for parent proxy-report and child self-report across scales and ages
8–18
Scale Age Group
Total Sample Child (8–12) Adolescent(13–18)
Total Score .58 .54 .61
Physical Health .49 .47 .50
Psychosocial Health .58 .54 .60
Emotional Functioning .55 .50 .57
Social Functioning .50 .48 .50
School Functioning .56 .59 .54
Values are Single Measure Intraclass Correlation Coefficients (ICC). ICC values were derived using a two way mixed effects model with absolute
agreement type. ICC are designated as ≤ 0.40 poor to fair agreement, 0.41–0.60 moderate agreement, 0.61–0.80 good agreement, and 0.81–1.00
excellent agreement.
Response Functions for 5 categories: School FunctioningFigure 4
Response Functions for 5 categories: School Functioning.
&KLOGVHOIUHSRUW 3DUHQWSUR[\UHSRUW
Health and Quality of Life Outcomes 2008, 6:41 />Page 14 of 15
(page number not for citation purposes)
increasing age is consistent with the results of the Ped-
sQL™ 4.0 school population study [3] and can be
explained by the greater verbal communication skills typ-
ically manifested with increasing developmental age.
There are several limitations to this study. First, we were
not able to collect data from a representative sample
based on the Korean population census. However, it
should be noted that we had a large enough sample size
in two small cities, two metropolitan cities, and a capital
city. Second, we were not able to determine which chil-
dren and adolescents did not understand the instructions
of PedsQL™ 4.0 due to cognitive dysfunction, even though
there were no developmental disorders in the parent's
report on the presence of a chronic health condition in
their children. For this study, PedsQL™ 4.0 Generic Core
Scales were administered as a group test in schools, and
thus, there may be some covariates that were not
accounted for. Furthermore, the sample size for children
with a chronic health condition was very small, and may
not be representative of chronically ill children in general
or specifically in Korea. In particular, if the same factor
structure is not confirmed on a less healthy population,
their scores might not be comparable. Thus, further vali-
dation studies on Korean clinical samples are required.
Finally, we applied the unidimensional Rasch model to
analyze item responses in the PedsQL™ 4.0 Generic Core
Scales. However, the unidimensional approach ignores
the correlations between latent traits and yields imprecise
measures when tests are short [53]. PedsQL™ 4.0 Generic
Core Scales can be analyzed as a whole, but the approach
ignores the evidence for the subscale structure. In a further
study, to take the correlations into account, the applica-
tion of multidimensional item response models is
needed. Additionally, for assessing cross-cultural equiva-
lence of PedsQL™ 4.0 Generic Core Scales, the analysis of
differential item functioning (DIF) is needed for both the
Korean and the US samples.
Conclusion
The results demonstrate the feasibility, validity, item reli-
ability, item fit, and agreement between child self-report
and parent proxy-report of the Korean version of PedsQL™
4.0 Generic Core Scales for school population health
research in Korea. However, the utilization of the Korean
version of the PedsQL™ 4.0 Generic Core Scales for
healthy school populations needs to consider low person
reliability, ceiling effect and cultural differences, and fur-
ther validation studies on Korean clinical samples are
required.
Abbreviations
HRQOL: Health-Related Quality of Life; PedsQL™: Pediat-
ric Quality of Life Inventory™; WHO: World Health
Organization; CTT: Classical Test Theory; IRT: Item
Response Theory; CFA: Confirmatory Factor Analysis;
WLSMV: Weighted Least Square Parameter Estimates
Using a Diagonal Weighted Matrix with Standard Errors
and Mean-and Variance-Adjusted Chi-Square Test Statis-
tic; CFI: Comparative Fit Index; TLI: Tuker-Lewis Index;
RMSEA: Root Mean Square Error of Approximation; PCM:
Partial Credit Model; RSM: Rating Scale Model; ICC: Intra-
class Correlation; INFIT: Information-Weighted Fit Statis-
tic; OUTFIT: Outlier-Sensitive Fit Statistic; MNSQ: Mean-
Square Statistic with Expectation 1; DIF: Differential Item
Functioning.
Competing interests
Dr. Varni holds the copyright and the trademark for the
PedsQL™ and receives financial compensation from the
Mapi Research Trust, which is a nonprofit research insti-
tute that charges distribution fees to for-profit companies
that use the Pediatric Quality of Life Inventory™. The Ped-
sQL™ is available at the PedsQL™ Website [18].
Authors' contributions
SHK and JWV designed the study, SHK collected the data
and performed the statistical analyses, SHK and JWV
drafted the manuscript, JWV participated in the statistical
analyses. All authors read and approved the final manu-
script.
Acknowledgements
The contributions of clinical psychologists In Soon Han, Ji Suk Yu, Hyun Jung
Kang, and Hyun Jung Kim, as well as Prof. Dr. Hae Ja Kang and Prof. Dr.
David E Schaffer to this study are gratefully acknowledged.
References
1. Osoba D: Guidelines for measuring health-related quality of
life in clinical trials. In Quality of Life Assessment in Clinical Trials:
Methods and Practice Edited by: Staquet MJ, Hays RD, Fayers PM.
Oxford, UK: Oxford University Press; 1998:27-29.
2. Varni JW, Burwinkle TM, Seid M: The PedsQL™ as a pediatric
patient-reported outcome: Reliability and validity of the
PedsQL™ Measurement Model in 25,000 children. Expert
Review of Pharmacoeconomics and Outcomes Research 2005, 5:705-719.
3. Varni JW, Burwinkle TM, Seid M: The PedsQL™ 4.0 as a school
population health measure: Feasibility, reliability, and valid-
ity. Quality of Life Research 2006, 15:203-215.
4. Bastiaansen D, Koot HM, Bongers IL, Varni JW, Verhulst FC: Meas-
uring quality of quality in children referred for psychiatric
problems: Psychometric properties of the PedsQL™ 4.0
Generic Core Scales. Quality of Life Research 2004, 13:489-495.
5. Varni JW, Burwinkle TM, Berrin SJ, Sherman SA, Artavia K, Malcarne
VL, Chambers HG: The PedsQL™ in pediatric cerebral palsy:
Reliability, validity, and sensitivity of the Generic Core
Scales and Cerebral Palsy Module. Developmental Medicine and
Child Neurology 2006, 48:442-449.
6. Varni JW, Burwinkle TM, Jacobs JR, Gottschalk M, Kaufman F, Jones
KL: The PedsQL™ in Type 1 and Type 2 diabetes: Reliability
and validity of the Pediatric Quality of Life Inventory™
Generic Core Scales and Type 1 Diabetes Module. Diabetes
Care 2003, 26:631-637.
7. Varni JW, Burwinkle TM, Katz ER, Meeske K, Dickinson P: The Ped-
sQL™ in pediatric cancer: Reliability and validity of the Pedi-
atric Quality of Life Inventory™ Generic Core Scales,
Multidimensional Fatigue Scale, and Cancer Module. Cancer
2002, 94:2090-2106.
Health and Quality of Life Outcomes 2008, 6:41 />Page 15 of 15
(page number not for citation purposes)
8. Varni JW, Burwinkle TM, Rapoff MA, Kamps JL, Olson N: The Ped-
sQL™ in pediatric asthma: Reliability and validity of the
Pediatric Quality of Life Inventory™ Generic Core Scales
and Asthma Module. Journal of Behavioral Medicine 2004,
27:297-318.
9. Varni JW, Seid M, Knight TS, Uzark K, Szer IS: The PedsQL™ 4.0
Generic Core Scales: Sensitivity, responsiveness, and impact
on clinical decision-making. Journal of Behavioral Medicine 2002,
25:175-193.
10. Varni JW, Seid M, Kurtin PS: PedsQL™ 4.0: Reliability and valid-
ity of the Pediatric Quality of Life Inventory™ Version 4.0
Generic Core Scales in healthy and patient populations. Med-
ical Care 2001, 39(8):800-812.
11. Hays RD: Item response theory models. In Quality of Life Assess-
ment in Clinical Trials: Methods and Practice Edited by: Staquet MJ, Hays
RD, Fayers PM. Oxford, UK: Oxford University Press; 1998:183-184.
12. Embretson SE, Reise SP: Item Response Theory for Psychologists
Mahwah, NJ: Lawrence Erlbaum Associates; 2000.
13. Reise SP, Widaman KF, Pugh RH: Confirmatory factor analysis
and item response theory: Two approaches for exploring
measurement invariance. Psychological Bulletin 1993,
114:552-566.
14. Rasch G: An item analysis which takes individual differences
into account. Br J Math Stat Psychol 1966, 19(1):49-57.
15. Bond TG, Fox CM: Applying the Rasch Model: Fundamental Measure-
ment in the Human Sciences New Jersey: Lawrence Erlbaum Associ-
ates; 2001.
16. Clark HH, Schober MF: Asking questions and influencing
answers. In Questions about Questions: Inquiries into the Cognitive Bases
of Surveys Edited by: Tanu JM. New York: Russell Sage; 1992:15-48.
17. Rasch G: Probabilistic Models for Some Intelligence and Attainment Tests
Copenhagen: Danmarks Paedagogiske Institut; 1960.
18. PedsQL™ [ />Tables.doc]
19. Fairclough DL: Design and Analysis of Quality of Life Studies in Clinical Tri-
als: Interdisciplinary Statistics New York: Chapman & Hall/CRC;
2002:29-30.
20. Essink-Bot ML, Krabbe PFM, Bonsel GJ, Aaronson NK: An empirical
comparison of four generic health status measures: The
Nottingham Health Profile Survey, the Medical Outcomes
Study 36-item Short-Form Health Survey, the COOP/
WONGA Charts, and The EuroQol Instrument. Medical Care
1997, 35:522-537.
21. McHorney CA, Ware JE, Lu JFR, Sherbourne CD: The MOS 36-
item short-form health survey (SF-36): III Tests of data qual-
ity, scaling assumptions, and reliability across diverse patient
groups. Medical Care 1994, 32:40-66.
22. Muthén LK, Muthén BO: Mplus. Version 4.0. Los Angeles, CA: Muth-
én & Muthén; 2006.
23. Bentler PM: Comparative fit indices in structural equation
models. Psychological Bulletin 1990, 107:238-246.
24. Bentler PM, Bonett DG: Significance tests and goodness of fit in
the analysis of covariance structures. Psychological Bulletin 1980,
88(3):588-606.
25. Browne MW, Cudeck R: Single sample cross-validation indices
for covariance structures. Multivariate Behavioral Research 1989,
24:445-455.
26. Hu L, Bentler PM: Evaluating model fit. In Structural Equation Mod-
eling, Issues, Concepts, and Applications Edited by: Hoyle R. Newbury
Park, CA: Sage; 1995:76-99.
27. Cohen J: Statistical Power Analysis for the Behavioral Sciences 2nd edition.
Hillsdale, NJ: Erlbaum; 1988.
28. Wright BD, Masters GN: Rating Scale Analysis Chicago, IL: Mesa Press;
1982.
29. Linacre JM, Wright BD: WINSTEPS: Multiple-choice, rating
scale, and partial credit Rasch analysis. Chicago: MESA Press;
2003.
30. Masters GN: A Rasch model for partial credit scoring. Psy-
chometrika 1982, 47:149-174.
31. Andrich D: Rating formulation for ordered response catego-
ries. Psychometrika 1978, 43:561-573.
32. Institute for Objective Measurement
[ />rmt/rmt83b.htm]
33. Karabatsos G: The sexual experiences survey: Interpretation
and validity. Journal of Outcome Measurement 1997, 1:305-328.
34. Piquero AR, MacIntosh R, Hickman M: Applying Rasch modeling
to the validity of a control balance scale. Journal of Criminal Jus-
tice 2001, 29:493-505.
35. Institute for Objective Measurement [ />rmt/rmt83q.htm]
36. Linacre JM: Optimizing rating scale category effectiveness.
Journal of Applied Measurement 2002, 3:85-106.
37. Institute for Objective Measurement [ />rmt/rmt93j.htm]
38. Linacre JM: Investigating rating scale category utility. Journal of
Outcome Measurement 1999, 3(2):103-122.
39. McGraw KO, Wong SP: Forming inferences about some Intra-
class Correlation Coefficients. Psychological Methods 1996,
1:30-46.
40. Cremeens J, Eiser C, Blades M: Factors influencing agreement
between child self-report and parent proxy-reports on the
Pediatric Quality of Life Inventory™ 4.0 (PedsQL™ 4.0)
Generic Core Scales. Health and Quality of Life Outcomes 2006,
4:58.
41. Bartko JJ: The intraclass correlation coefficient as a measure
of reliability. Psychological Reports 1966, 19:3-11.
42. Felder-Puig R, Frey E, Proksch K, Varni JW, Gadner H, Topf R: Vali-
dation of the German version of the Pediatric Quality of Life
Inventory™ (PedsQL™) in childhood cancer patients off
treatment and children with epilepsy. Quality of Life Research
2004, 13:223-234.
43. Reinfjell T, Diseth TH, Veenstra M, Vikan A: Measuring health-
related quality of life in young adolescents: Reliability and
validity in the Norwegian version of the Pediatric Quality of
Life Inventory™ 4.0 (PedsQL™) Generic Core Scales. Health
and Quality of Life Outcomes 2006, 4:61.
44. Upton P, Maddocks A, Eiser C, Barbes PM, Williams J: Development
of a measure of the health-related quality of life of children
in public care. Child: Care, Health and Development 2005,
31(4):409-415.
45. Kaplan RM, Quality of life in children: A health care policy per-
spective. In Quality of Life in Child and Adolescent Illness Concepts,
Methods and Findings Edited by: Koot HM, Wallander JL. East Sussex,
Great Britain: Brunner-Routledge; 2001:89-120.
46. Centers for Disease Control and Prevention: Measuring Healthy Days:
Population Assessment of Health-Related Quality of Life Atlanta Georgia:
CDC; 2000.
47. Stewart AL, Ware JE: Measuring Functioning and Well-being: The Medical
Outcomes Study Approach Durham, North Carolina: Duke University
Press; 1992.
48. Patrick DL, Erickson P: Assessing health-related quality of life
for clinical decision-making. In Quality of Life Assessment: Key
Issues in the 1990s Edited by: Walker SR, Rosser RM. Lancaster, UK:
Kluwer Academic Publishers; 1993:14-15.
49. Upton P, Eiser C, Cheung I, Hutchings HA, Jenny M, Maddocks A,
Russell IT, Williams JG: Measurement properties of the UK-
English version of the Pediatric Quality of Life Inventory™
4.0 (PedsQL™) Generic Core Scales. Health and Quality of Life
Outcomes 2005, 3:22.
50. WINSTEPS
®
& Facets Rasch Software [
steps.com/cgi-local/forum/Blah.pl?b-cc/m-1158888547]
51. WINSTEPS
®
& Facets Rasch Software [
steps.com/winman/index.htm?reliability.htm]
52. Eiser C, Morse R: Quality of life measures in chronic diseases
of childhood. Health Technology Assessment 2001, 5(4):1-157.
53. Wang WC, Chen PH: Improving measurement precision of
test batteries using multidimensional item response models.
Psychological Methods 2004, 9:116-136.