Natural Hazards Analysis - Chapter 6 pptx
Bạn đang xem bản rút gọn của tài liệu. Xem và tải ngay bản đầy đủ của tài liệu tại đây (3.33 MB, 32 trang )
© 2009 by Taylor & Francis Group, LLC
135
6Chapter
Social, Economic, and
Ecological Vulnerability
Objectives
1. Define the concept of vulnerability and extreme events.
2. Examine the three dimensions of vulnerability.
3. Clarify how we can measure the three dimensions of vulnerability.
4. Identify examples of the three dimensions of vulnerability.
Key Terms
Vulnerability
Resiliency
Geo-hazard/extreme events
Social system
Infrastructural system
Economic system
Ecological system
Smart growth
Coastal sprawl
© 2009 by Taylor & Francis Group, LLC
136 Natural Hazards Analysis: Reducing the Impact of Disasters
Critical inking: Why do some communities bounce back and even prosper
from disasters while others take much longer to recover or experience delays in
restoring their ecological, social, or economic systems? How can we measure the
potential impacts from natural hazards on social-cultural, economic, or ecological
systems? How can we better understand how these interconnected systems within
a community might be impacted?
Introduction
Vulnerability refers to the susceptibility or potential for harm to social, infrastruc-
tural, economic, and ecological systems. It is the result of a set of conditions and
processes that influence the way that these systems are harmed by natural and
technological hazards or extreme events. Vulnerability is closely associated with
resilience, which involves the capacity of these systems to bounce back from disas-
ters or their capacity to both respond to and cope with extreme hazard events. We
earlier noted that risk was the result of hazard potential, time, and vulnerability.
us vulnerability becomes central in understanding how our communities deal
with risks associated with disasters. Expressed in a different way, vulnerability is
the result of our exposure to hazards and our capacity to cope and recover in a
sustainable manner.
Approaches to Vulnerability
Recent literature suggests that vulnerability takes many forms, and scholars have
developed many techniques that analyze this phenomenon. ree popular methods
include the utilization of an exposure model that emphasizes the identification of
conditions that make people and places vulnerable to disastrous conditions and
is related to the relative frequency and intensity of the hazard, risk, or threat. An
exposure model would also allow testing of the vulnerability of critical infrastruc-
ture and facilities to impacts of hazardous events. Quantitative approaches in the
engineering sciences attempt to assess the infrastructure resilience with the goal
to reduce losses through research and the application of advanced technologies
that improve engineering, pre-event planning and post-event recovery strategies
(Bruneau et al. 2003). Vulnerability as a hazard exposure includes the distribution
of people, economies, and the environment to hazardous conditions. e emphasis
here is on the physical occupation of areas that may be prone to hazardous events.
Under this view, vulnerability is a result of a physical condition that is associated
with place (Cutter 1996).
A second approach views vulnerability as a social condition that measures
societal resistance or resilience to hazards (Blaikie et al. 1994; Hewitt 1997).
© 2009 by Taylor & Francis Group, LLC
Social, Economic, and Ecological Vulnerability 137
Vulnerability is an outcome of the relation between a hazard and a social condition
that includes the capacity to respond and cope in a positive manner. is coping
capacity is thus inherent within the resilience of families and groups of people in an
area of a hazardous event. e final element is the community’s capacity to respond
and cope within a geographic area. What resources does the community have to
deal with disasters?
Vulnerability includes the robustness of social networks in a community, the
strength of critical infrastructure to hazards, an area’s risk of a hazardous event,
and efforts by the community to reduce potential losses or to mitigate exposure. A
community’s vulnerability is thus filtered through their social fabric, their efforts to
strengthen their infrastructure, and business enterprises’ initiatives to reduce their
exposure and increase capacity to deal with disasters (risk management). Both com-
munity mitigation activities as well as organizational risk management initiatives
thus impact the social, economic, and ecological exposure to hazards. Vulnerability
is thus more complex than just the exposure of people to hazards, for their efforts to
prepare and cope, along with community and organization initiatives, contribute
to the community’s capacity to respond and cope with disaster events. e fact is
that the natural, economic, and social systems are deeply integrated and interde-
pendent in many ways that must be considered in understanding that some com-
munities, people and natural environments are better able to cope and recover from
disasters than others.
e third is an integrated approach that examines potential exposures and social
resilience (Cutter 1996; Cutter et al. 2000; Kasperson et al. 1988). e integrated
approach combines vulnerability associated with risk and exposure with vulnerabil-
ity as a social response, along with vulnerability of place. Cutter (1996) notes prob-
lematic issues even in this integrated approach, because of its lack of consideration
of the underlying causes of social vulnerability and its failure to consider distinct
spatial outcomes that may vary over time. e variability of risk over a geographic
area is central to Cutter et al.’s hazards of place model (2003). Social and biophysi-
cal conditions thus interact to produce an overall place vulnerability.
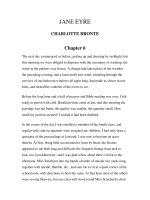
Vulnerability, however, is more than just exposure to and the impact of hazards
on essential characteristics of a community’s social, economic, and ecological sys-
tems. It requires coping strategies by individuals or agencies at multiple spatial and
temporal scales. Figure
6.1 shows a conceptual view of vulnerability.
Critical inking:
e scale at which vulnerability of place is examined may vary
from large regions such as metropolitan areas to the neighborhood level. e analy-
sis of vulnerability at the neighborhood level is present in isolated disaster case stud-
ies and not included in assessments of large-scale disasters in the United States or
internationally. Tornadoes impacting a small community or neighborhood would
serve as a very different scale to a disaster such as a hurricane or many floods. What
other examples of small-scale disasters can you provide?
© 2009 by Taylor & Francis Group, LLC
138 Natural Hazards Analysis: Reducing the Impact of Disasters
Coping strategies should be included in an integrated approach to vulnerability
approach. Vulnerability thus is integrated into the development of action or cop-
ing strategies that can be implemented. ese strategies reflect choices or public
policies that are made by individuals, families, businesses, and public agencies and
models that allow testing them. We are interested in who lives in the community
and where they reside, but it is the decisions that people make on an individual and
collective basis that really drive vulnerability.
For example, some communities may adopt land-use planning and hazard-
resistant building codes. For these communities, structures built to the code may
be hazard resistant and less likely to be damaged by high wind, floods, storm surge,
fire, or other anticipated hazards. Zoning restrictions control building in high-
hazard zones either by requiring base elevation for a structure above a specific flood
height or by setback requirements from coastal zones. Human choices and our poli-
cies are part of our examination of vulnerability.
Vulnerability is influenced by and dependent on coping capacity, so the level of
response and recovery can be measured by monetary resources available, deployment
of technology by type, resilience of infrastructure, and capacity of the emergency
response system. Per capita income may suggest many things about a community
and resilience. e United Nations Development Program (UNDP) (2000) sees a
relationship between per capita income and fatalities by country. Others see a rela-
tionship between per capita income and health attainment (level of life expectancy
for a country) as measured by UNDP (2000). Per capita income and (unrestricted)
access to medical facilities and health care result in a more resilient population
against various disease and therefore longer life expectancy. Economic capacity
also provides a base for people in a country to deal with disaster losses—more
Change in Extreme
Event Dynamics
Exposure Coping
To pography (land)
Atmosphere (air)
Hydrology (water)
Biosphere (life)
Pedosphere (soil)
Population
Political will
Economic incentives
Use of technology
Infrastructure hardening
Restoration of natural
resource base
Social cohesion
(foster neighborhood
identification/cohesion)
Economy
Natural resource base
Agriculture production
Climate change
Infrastructure
Experience/social or
cultural values
Value or appreciation of
natural landscape
Value of recreation
Figure 6.1 Conceptual view of vulnerability. Graphic design by Mary Lee
Eggart.
© 2009 by Taylor & Francis Group, LLC
Social, Economic, and Ecological Vulnerability 139
financial resources mean that countries can cope more effectively. RADIUS (Risk
Assessment Tool for Diagnosis of Urban Areas against Seismic Disasters) used haz-
ard exposure, context vulnerability, and emergency response plan (coping mecha-
nism) to shape their indicators of vulnerability (Morrow 1999).
Dimensions of Vulnerability
Vulnerability consists of three dimensions, including social, economic, and ecologi-
cal elements of our communities. Our goal is to identify sensitive indicators in each
area so as to understand how a community might be harmed in a disaster.
Social, economic, and ecologic indicators emerged independently during the
1960s and 1970s specifically designed to provide indices of exposure and environ-
mental health (Cutter et al. 2003). e UNDP has used socioeconomic indica-
tors to examine social and economic implications of regional partnerships (UNDP
2005). e Coastal Risk Atlas is one of the few attempts to link physical hazards
and social vulnerabilities (Boyd et al. 2005). Richmond (2001) concluded “there
exists no established methodology for determining the hazardous nature of a coast-
line,” and Cutter et al. reconfirmed that metric standards do not exist to assess
the vulnerability to environmental hazards (2003). Richmond et al. quantified the
effects of only physical hazards to the Hawaiian Islands by historical records and a
ranking scheme based on hazard dynamic and frequency to define an overall haz-
ard assessment to be used for coastal land-use planning (Cutter et al. 2003).
Nakagawa and Shaw (2004) note that there are common features that sug-
gest why some communities are more resilient than others. ey see that there is
a complex mixture of social, economic, religious, and political factors present that
influence community resilience to disasters.
Environmental degradation can result in health and economic losses, poverty,
loss of intellectual property rights, loss of natural heritage, and conflict exposure to
extreme events. It also might be related to the root causes of a hazard outcome such
as disease. As an example, water supply, air pollution (indoor), and sanitation are all
related to the highest level of risk from disease. is would suggest that indicators
are thus related to specific hazards and may be a strong association to some threats
while not to others.
Critical inking: It is widely agreed upon that social vulnerability is influenced
by a lack of information, political representation, richer social networks, culture,
infrastructure, age, gender, race, and socioeconomic status, language, and disabili-
ties (Cutter et al. 2003). Hazard potential, geography, and infrastructure condi-
tions interface with the social and economic fabric of a region to influence risk
(Cutter et al. 2003).
© 2009 by Taylor & Francis Group, LLC
140 Natural Hazards Analysis: Reducing the Impact of Disasters
Social and Human Vulnerability
e social dimension of vulnerability arises from the exposure of people, neigh-
borhoods, cities and rural populations and their capacity to recover from hazard
events. e hazards literature has noted that the poor, unemployed, single head
of a household, elderly, handicapped, or carless households (Blaikie et al. 1994;
Yohe and Tol 2001) are much more likely to suffer the hardest and have more
difficulty in restructuring their lives after a disaster than other households that
have more resources. e more vulnerable populations take more time than their
counterparts to recover following a disaster and as a result suffer to a greater extent.
Vulnerability also impacts individual self-protection actions and access to political
networks and institutions. Cutter et al. acknowledge these factors, but stresses the
geographic dimensions of vulnerability noting that place matters (2003). Too often,
the poor and most vulnerable populations reside in the most hazardous zones in a
community.
Social vulnerability suggests a differential capacity of groups and individuals
in dealing with the adverse effects of hazards based on their positions within the
physical and social world (Dow 1992). Historical, cultural, social, and economic
processes shape an individual’s or social group’s coping capacity (Blaikie et al.
1994). Research studies suggest that specific populations are far more vulnerable
to the risks from natural and human-caused disasters (Cutter et al. 2003; Peacock
et al. 2000). ese studies also indicate that there is a strong relationship between
socioeconomic vulnerability and disasters and that social and economic costs of
disasters fall unevenly on these population groups (e.g., Blaikie et al. 1994; Bolin
and Stanford 1991; Cutter et al. 2003; Heinz 2000; Mileti 1999; Morrow 1999).
It is widely agreed upon that social vulnerability is influenced by a lack of infor-
mation, political representation, richer social networks, culture, infrastructure,
age, gender, race, and socioeconomic status, non-English speaking, and disabilities
(Cutter et al. 2003). More valuable homes and higher incomes increase resilience
to hazards and reduce risks (Cutter et al. 2000). us, hazard potential, geography,
and infrastructure conditions interface with the social and economic fabric of a
region to influence risk (Cutter et al. 2003). e key question raised by these studies
centers on the suggestion that some groups are at greater risk than others.
Carter (2006) takes a different perspective on social vulnerability, observing
that for some, droughts, hurricanes, and other environmental disasters deal a blow
to the poor and vulnerable populations in many parts of the world, so as to trap
them in poverty, despair, and dependency. ey view patterns around the world to
suggest that the poorest households struggle to overcome the desperate situation
that disaster or shocks deal them. eir short- and long-term well-being and sus-
tainability make it impossible to ever catch up with wealthier households.
A hurricane hazard vulnerability assessment conducted during 2005 for the
Mississippi Gulf Coast combined a GIS-based risk atlas and hurricane simulations
(Boyd 2005). Risks were ranked such as flood zones, and vulnerability was examined
© 2009 by Taylor & Francis Group, LLC
Social, Economic, and Ecological Vulnerability 141
using income, age, single parents, education, non-English, vehicle ownership, home
ownership, and type of home to identify populations at risk and hurricane hazards.
Nakagawa and Shaw (2004) note that there are common features that sug-
gest why some communities are more resilient than others. ey see that there
is a complex mixture of social, economic, religious, and political factors present
that influence community resilience to disasters. ey found that the resilience of
communities to recover following a disaster is based on both social and economic
activities that are heavily influenced by social capital or the level of trust present in
the community, social norms, degree of community participation, and finally, the
presence of strong community networks.
Critical inking: Hoffman (2003) examined who might be hidden victims of
disaster and suggests that some very vulnerable people fall through the cracks in
disaster recovery, not getting the type of relief needed, and endure ongoing suffer-
ing as a result of their situation. She explains that those less able to prepare or cope
with disasters are poor or working classes and are some of the most unprotected
people in a disaster. As a result of catastrophes, some people slip into a state of per-
petual misery. ese hidden victims could include undocumented workers, people
who lost rental housing (owners or renters) and who did not have insurance, the
mentally ill or those with chronic illnesses, people who are severely incapacitated or
people who are viewed as social parasites such as beggars, trash scavengers, hustlers,
or just the homeless. She raises the question of what happens when those hidden
victims who are at the bottom of our society or bottom of the heap are not helped.
What happens to the rest of society?
Economic Vulnerability
When we look at economic vulnerability, we examine our risk to changes in the
production, distribution, and consumption of goods and services from the private
commercial sector but also from the nonprofit and public sectors. e health and
vitality of a community’s economy is interdependent with the region, nation, and
world. e identification of local, regional, national, and international forces that
influence local wages, production, export volume, unemployment, and the number
and types of jobs may be impacted by many external forces. ere are many link-
ages in our economies that shape the robustness of our local, regional, and state
economic base. Suggesting that we can predict accurately how to establish a highly
productive economy is very different from the examination of a set of economic
indicators that will suggest that a local community could withstand or recover from
a natural disaster. Our task then is to identify and examine indicators that will sug-
gest how robust our economy is for a given community and its capacity to contrib-
ute in a positive manner to a recovery from a disaster. Economic vulnerability also
includes factors that could harm a labor force such as human disease or epidemics.
© 2009 by Taylor & Francis Group, LLC
142 Natural Hazards Analysis: Reducing the Impact of Disasters
United Nations World Vulnerability Report (UNDP) documents indicators for
indexing and monitoring the potential for disasters.
When we assess the economic vulnerability, we evaluate not only jobs and the
nature of the local economy but the capacity of roads, bridges, airports, rail lines,
hospitals, prisons, manufacturing plants, shopping areas, utilities, and communica-
tion systems to withstand a disaster. It is the potential impact to employee wages,
employment, and infrastructure such as electrical, natural gas, and communica-
tion sectors that impacts our community’s capacity to recover from a disaster. As
Comfort et al. (1999) point out, our vast set of services to our rural and urban com-
munities offers a vital backbone to our commerce and standard of living; the scale
of these systems also creates dependence and losses that have vast consequences on
our economic stability.
e infrastructural and economic vulnerabilities are in fact tightly connected,
but can be clearly separated if we consider two aspects: a physical and a nonphysi-
cal aspect. While the built environment and its physical resilience against extreme
events may be impacted by the physical forces of a hazard, the economic resilience
would deal with pressures and impacts of the global economy. In today’s global
economy, financial, trade, and policy decisions in other parts of the world may have
a significant impact on a local economy.
International agencies judge the size and structure of an economy, exposure
to international trade shocks, as well as extreme natural events to justify loan
or aid programs (USAID 1999). e U.S. AID examines economic vulnerabil-
ity by determining the frequency and intensity of hazards and conditions such
as energy dependency, export characteristics and destinations, and reliance on
external financing (Crowards 1999). Munich Re Group (2002) looks at disasters
from an economic perspective, including annual per capita income as a reflection
of purchasing power. In the agricultural sector of our economy the production of
various goods can be measured. But production is highly impacted by external
forces such as soil moisture or meteorological forces or geological variables reflect-
ing the hazard itself.
Environmental Vulnerability
Ecological dimensions of vulnerability refers to the capacity of our natural systems
to bounce back from disaster. It is the inability of our natural systems to deal
with stress that may evolve over time and space (Williams and Kaputska 2000).
Saltwater intrusion into freshwater marshes can cause the impairment and even
the loss of breeding grounds for fish and other water creatures, birds, and other
coastal animals. Long-term intrusion of saltwater into marsh areas can also impact
community surface water systems. Hazardous material contamination that results
from flooding, wind, or storm surge can cause immediate and long-term decay of
delicate coastal environments.
© 2009 by Taylor & Francis Group, LLC
Figure 1.3 Louisiana’s Comprehensive Master Plan for a Sustainable Coast
( />0&pid=28&fmid=0&catid=0&elid=0).
Legend
Night Time Population
Cities
Interstate
Railroads
Water Features
Water Bodies
A Flood Zones
State Roads
0.00 to 31.00
31.00 to 104.00
104.00 to 261.00
261.00 to 625.00
625.00 to 1537.00
(c) 1997–2003 FEMA.
Calcasieu Parish Risk Assessment
Night Time Population
4 Kilometers024
Figure 7.4 Nighttime population with fiood zones.
© 2009 by Taylor & Francis Group, LLC
Legend
Residental Exposure
0.00 to 2454.00
2454.00 to 7634.00
7634.00 to 20111.00
20111.00 to 43930.00
43930.00 to 113873.00
(c) 1997–2003 FEMA.
N
00.5 12 34
Miles
S
EW
Water Features
Figure 2.3 A choropleth map of New Orleans, LA, showing residential structure
values.
Figure 2.2 City of New Orleans, LA, elevation map.
City of New Orleans Hurricane Katrina Flood Levels
September 2, 2005
Legend
Katrina Flooding
Value
Interstate HWY
Interstate HWY
Water Features
USGS DEM
High : 56.2
High : 13.49
Low: –12.0
Low: 0.00
(c) 1997–2003 FEMA.
N
00.5 12 34
Kilometers
S
E
W
Water Features
© 2009 by Taylor & Francis Group, LLC
USGS DOQQ 2004
St. Gabriel
USGS DOQQ 1998
St. Gabriel
Figure 3.3 Development in a rapidly growing community.
New Orleans 100-Year Level of Protection: Gentilly Neighborhoods
U.S. Army Corps of Engineers, New Orleans District
Interstate HWY
Interstate HWY
Water Features
Water Features
100-Ye ar Flood
High: 16.500000
Low: 0.000000
(c) 1997–2003 FEMA.
N
S
W
00.450.9 1.82.7 3.6
Kilometers
E
Legend
Figure 3.2 Flood map of New Orleans—Gentilly neighborhood (http://www.
mvn.usace.army.mil/hps/100maps.htm).
© 2009 by Taylor & Francis Group, LLC
Study Region: East Baton Rouge and Livingston Parishes - Amite River
Study Case: 500-Ye ar Flood using HEC-RAS
Legend
500-Ye ar Flood
Value
300-meter DEM
Value
(c) 1997–2003 FEMA.
0 1 2 4 6 8
Kilometers
High: 32
High: 27.628805
Roads
Interstate
Water Features
Low: - 1.86
Low: – 1.86
Figure 4.1 Riverine fiood modeling results within HAZUS-MH Flood.
USGS DEM 5 Meter Resolution
St. Gabriel
USGS DOQQ 2004
St. Gabriel
Figure 3.5 USGS DEM, 5-meter DEM, and high-resolution image.
© 2009 by Taylor & Francis Group, LLC
Legend
Percent of Renters
(c) 1997–2003 FEMA.
N
W
E
S
4 2 0 4 Kilometers
Interstate HWY
Water Features
0.00–0.18
0.19–0.40
0.41–0.58
0.59–0.77
0.78–1.00
Figure 4.3 Percent of renters for the City of New Orleans at the census-block-
group level.
New Orleans High Resolution Image
with Census Roads
New Orleans High Resolution Image
with Edited Roads
Figure 4.2 Comparison of Census Bureau road flles and edited flles.
© 2009 by Taylor & Francis Group, LLC
Shelter Capacity
South Louisiana Parishes
Legend
Shelter Capacity
10
50
100
250
500
1,000
Parishes
Parishes
Interstate
Interstate
Water Bodies
Water Bodies
(c) 1997–2003 FEMA.
N
S
W
0510203040
Miles
E
Figure 4.7 Use of proportional symbols in mapping data.
Data Mapped with Four Different
Classification Methods (6 Classes)
64–1212
>1212–2359
>2359–3507
>3507–4655
>4655–5802
>5802–6950
64–736
1041–4043
>4043–4368
>4368–4814
>4814–6168
6950
64–612
>612–1475
>1475–2476
>2476–3169
>3169–4031
>4031–6950
–2––1 Std. Dev.
>1–0 Std. Dev.
>0–1 Std. Dev.
>1–2 Std. Dev.
>2–3 Std. Dev.
Equal steps
Natural breaks
Quantiles (Sixtiles) Standard deviations
Figure 4.6 Visualization of data using different classification methods.
© 2009 by Taylor & Francis Group, LLC
Mar Mar Mar
DATES: 03/02/2004 to 03/09/2004 11:00
USGS 03241500 Massies Creek at Wilberforce, OH
Discharge, Cubic Feet per Second
Explanation
Discharge
Median Daily Streamflow Based on 50 Years of Record
Provisional Data Subject to Revision
Mar Mar Mar Mar Mar 02 03
90
80
70
60
50
40
30
20
04 05 06 07 08 09
Figure 5.6 USGS hydrograph for a water feature.
Miles
Miles
>= 750 ppm = ERPG–3
>= 150 ppm = ERPG–2
>= 25 ppm = ERPG–1
Confidence Lines
0.75
0.25
0
0.25
0.75
00.5 1.521
Figure 5.3 Hazard risk zones representing alternative exposure limits.
© 2009 by Taylor & Francis Group, LLC
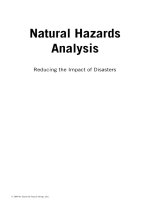
Figure 6.3 Environmental capital: healthy forest, clean water, and soils that sup-
port flsh and wildlife.
Tuesday, March 09, 2004 11:20ET
AK
HI
PR-VI
NH
VT
MA
RI
CT
NJ
DE
MD
DC
Figure 5.7 USGS river gauges in the United States (go to />waterwatch to review active state stations).
© 2009 by Taylor & Francis Group, LLC
Social, Economic, and Ecological Vulnerability 143
Environmental systems are also significant to the quality of life for a com-
munity and its productivity as well as sustainability. Critical views of the rate of
deforestation, annual water use as a percentage of total water resources, popula-
tion density, annual use of water by a household, volume of recycled materials per
household, and the relation of coastline to land area. ere could be a relationship
between number of threatened species in a land area and the ratio of total number
of natural disasters to land area (1970–1996) (Parkins 2000). e Yale Center for
Environmental Law and Policy (YCELP) identified five components for environ-
mental sustainability including (1) the health of environmental systems, (2) envi-
ronmental stresses and risks, (3) human vulnerability to environmental impacts,
(4) social and institutional capacity, and (5) global stewardship (World Economic
Forum 2000).
Lovins et al. (1999) advocates that businesses restore, sustain, and expand our
ecosystem so that it can produce vital services and biological resources abundantly.
is view suggests that our natural environment as natural capital is to be used,
but in a conscious manner so as to reduce waste and expand the productivity of
our natural resources. ey suggest systems thinking so as to reduce energy costs
and waste products. Energy savings can be productivity enhancing. is approach
suggests that per capita energy and water consumption is a valid indicator of effi-
cient natural resource allocation and consumption. Further, waste minimization
also fits within this model, and thus per capita waste generation and recycling
are good indicators of natural systems sustainability. Waste minimization and
pollution prevention are also EPA-recommended risk management strategies.
Finally, they recommend that we view our natural environment as natural capital
and one where we make an investment that will lead to positive return on our
investments.
EPA goes further to suggest that a healthy environment provides us with clean
air and water, rainfall, productive oceans and water features, fertile soil, and sus-
tainable watersheds. Social economic and environmental sustainability are interde-
pendent, and you cannot have one without the other.
Hossain (2001) noted the efforts of the Commonwealth Secretariat in
using indicators to understand environmental sustainability including annual
rate of deforestation, population density, and annual water use as a total water
resource (Parkins 2000). e World Bank (1999) approach to environmental
analysis is based on climate, water, forest, and pollution. Environmental degrada-
tion can result in health and economic losses, poverty, loss of intellectual prop-
erty rights, loss of natural heritage, and conflict exposure to extreme events. It
also might be related to the root causes of a hazard outcome such as disease. As
an example, water supply, air pollution (indoor), and sanitation are all related to
the highest level of risk from disease. is would suggest that indicators are thus
related to specific hazards and may be a strong association to some threats, while
not to others.
© 2009 by Taylor & Francis Group, LLC
144 Natural Hazards Analysis: Reducing the Impact of Disasters
Measuring Vulnerability
An indicator is a quantifiable measurable reflection of a phenomenon. We can
use indicators to understand a community’s capacity to suffer from, cope with, or
recover from a disaster. Indicators are also measurements that help us to understand
key assets in our community. By looking at these indicators over time, we can tell if
our community is improving, declining, or just remaining the same.
No set of measures tell us everything that we want to know. e Dow Jones
Industrial Average does not include all stocks, nor does the Consumer Price Index
examine all goods. e key is that we use indicators to give us a barometer of how
well something is doing. Quality indicators reflect existing and objective data from
well-known sources. e indicators measure something that reflects local condi-
tions or assets that are valued by the community.
Damage measures tangible concrete things that are usually built, such as
bridges, homes, commercial or industrial buildings, cars and trucks, or commu-
nication towers. Coping indicators demonstrate a community’s preparedness for a
disaster, such as persons evacuated or sheltered. e number of people evacuated
or sheltered could reflect effective warning systems or procedures to help people
get out of harm’s way. ese indicators may reflect a community’s preparedness,
the effectiveness of hazard mitigation or response strategies, and could explain why
some communities recover more quickly than others, suggesting that they are more
resilient.
No set of indicators can be all-inclusive. e Dow Jones Industrial Average, a
widely respected indicator of stock market performance, does not include every
stock traded on the New York Stock Exchange. Nor does the Consumer Price Index
measure the prices of all consumer goods. Both indices, like the Sierra Nevada
Wealth Index, are based on developing and monitoring a sample of indicators
which, viewed together, provide a barometer of overall performance. e 60 indi-
cators serve as an index and were selected because:
ey are measurable and can be updated with existing and objective data N
sources.
ey measure the condition of assets of material importance to the Sierra N
Nevada’s wealth.
ey measure the condition of assets where active public interest exists. N
Indicators of Social Conditions
One of the key issues that we face is to understand if socioeconomic population
characteristics indicate higher vulnerability (Cutter et al. 2003). High-risk groups,
such as those with lower incomes, the very young and elderly, the disabled, women
living alone, female-headed households, families with low ratios of adults to depen-
dents, ethnic minorities, renters, recent residents, tourists, and the homeless, are
© 2009 by Taylor & Francis Group, LLC
Social, Economic, and Ecological Vulnerability 145
good social vulnerability indicators of risk and that “social and economic costs
of disasters fall unevenly on [these] different classes of victims and stakeholders”
(Bolin and Stanford 1991; Cutter et al. 2000; Blaikie et al. 1994; Heinz 2000;
Morrow 1999). Economic income limitations impact many people, and thus they
are not prepared to deal with or recover from disasters (Mileti 1999). Age (less than
18; over 65), gender (females), race, and income (mean household value) are viewed
as primary social vulnerability indicators (Cutter et al. Handbook).
Common indicators that reflect a community’s vulnerability include nonwhite
population, household incomes less than $25,000, households who rent, number
of individuals over 65, disabled individuals (not including employment disabili-
ties), individuals over age 25 without a high school diploma, households without
a vehicle, renters, single-parent households with children under the age of 18, and
households without a phone. Where the indicator is expressed by household, the
value was then divided by the number of total households in the block group.
Households earning less than $25,000: Percentages of households earning N
less than $25,000 represents the number of households with earnings less
than $25,000 divided by the total number of occupied housing units in the
block group. is indicator was chosen to reflect an income threshold instead
of households living at or below poverty. is income value reflects the mini-
mum required to qualify for a home mortgage for a home.
No vehicle: Percentages of households by block group without a vehicle (car, N
truck, or van) was selected as one of our social vulnerability indicators. e
Census Bureau defines housing unit as a house, apartment, mobile home,
group of rooms, or a single room that is occupied as separate living quarters.
Nonwhite race: Much of the hazards vulnerability research has suggested that N
a nonwhite race is usually located in the highest hazard areas (Bolin 1986;
Peacock et al. 2000; Pulido 2000). e percentage of nonwhite population
by block group in New Orleans was selected as a social vulnerability indica-
tor and consists of African-Americans as well as Asian and Latino neighbor-
hoods. Howell (2005) noted that African-Americans were less likely to have
evacuated or retreated to a safer place for Hurricane Georges and thus could
be at a greater risk for Hurricane Katrina. FEMA prioritizes vulnerability
in the order of (1) income distribution, (2) elderly populations, (3) disabled
populations, (4) children, (5) minority neighborhoods, and (6) language and
cultural barriers. FEMA suggests what populations are vulnerable to specific
hazards; it is likely that vulnerable populations can be assumed as having
similar characteristics.
e elderly: e percentage of persons within a block group over the age of N
65 was selected as a social vulnerability indicator. e hazards literature sites
numerous studies that suggest that the elderly are a particularly vulnerable
population to hazards. ese studies note that physical, mental, and sensory
skills become weaker with age. Age is recognized as an indicator of social
© 2009 by Taylor & Francis Group, LLC
146 Natural Hazards Analysis: Reducing the Impact of Disasters
vulnerability due to mobility limitations, major dependence on relatives, fre-
quency of respiratory distress, and a lower resilience after the disaster (Cutter
et al. 2000; Hewitt 1997; Mileti 1999; O’Brien et al. 1992). Howell found
that individuals over the age of 65 were less likely to evacuate or have a plan
for evacuation for Hurricane Georges (2005), which threatened New Orleans
in the summer of 1998.
Disability: e percentage of noninstitutionalized individuals with a disabil- N
ity includes persons who have sensory, physical, mental, or other self-care
limitations that limit their activities outside the home. is category does not
include those with employment disabilities. e percentage is based on the
number of disabled individuals in the block group, unlike the other indica-
tors, which use households as the measurement.
Education: is indicator includes the percentage of individuals over the age N
of 25 with no high school diploma. Lower education has been suggested as
a constraint in understanding hazard warnings (Heinz 2000). e indicator
reflects the number of people over the age of 25 in each block group rather
than the number of households.
Use of rental housing: e percentage of rented housing units represents the N
number of occupied households renting divided by the total number of occu-
pied households in a block group. Several studies suggest that renters are vul-
nerable because of their lack of finances and/or limitations in transportation
(Heinz 2000; Morrow 1999).
No phone: e percentage of housing units without a phone represents all N
households without a phone divided by the total occupied housing units.
Telephones are an important means of communication to notify people of
an immediate evacuation. Calls can be made from emergency managers to
inform people of evacuation and locate those who are willing to answer the
phone and respond with key punches to indicate if they do not have means
to evacuate. Although phone calling as a means of communication has not
yet been documented as a warning tool, access to a phone is an important
vulnerability criterion. Automated systems for early hazard warning utilize
local phone capabilities (Burby 1998).
Single-parent households: e percentage of single parents who are the head N
of a household was selected as a social vulnerability indicator. is indicator
reflects single parents who are the head of a household with children under
the age of 18.
Number of persons injured or fatalities. N
Number of weeks injured workers out of work. N
Percent of population forced to evacuate. N
Duration of displacement. N
Percent of population below poverty level displaced by the disaster (per- N
sonal wealth).
Duration of population below poverty level displaced. N
© 2009 by Taylor & Francis Group, LLC
Social, Economic, and Ecological Vulnerability 147
Crime incidence following a disaster as compared to pre-event levels. N
Percent of population living in a high risk zone (flood zone). N
Percent of high school dropouts (annual basis).
N
Percent of students failing high school exit exam. N
Indicators of Economic Conditions
Traditional indicators of economic conditions center on employment, housing,
business sales, business taxes, and construction. Unemployment rate has been an
excellent economic indicator, for it reflects each of the sectors of the economy as well
as the public and private employment. Construction has also been used to judge the
vitality of a local economy, separating permits for industrial or commercial opera-
tions from either rental or home construction. Examining the number of housing
starts over a long-term period is a good way to determine if the present condition
is performing at a higher rate. Business taxes are also a good indicator of local eco-
nomic health, with the number of car sales a steady measure of local conditions.
In selecting economic indicators, the measures should be a reflection of the
broad basis of the economy and not heavily focused on a single sector. e number
of jobs in each of the major economic categories as viewed over a long period pro-
vides this type of broad measure. Unemployment rates also provide a broad view of
the economy. ese indicators include the number of employers and employees (by
sector industry), overall unemployment rate (especially small business which has
from 1 to 5 employees), the percentage of business failures, household population,
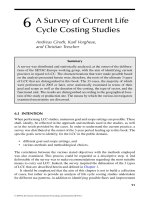
and the number of students in schools by type of school or college. Employment
estimates provide a good economic indicator for the local economy as reflected in
the employment in Figure
6.2 for Orleans Parish following the impacts of Hurricane
Katrina and Rita in 2005.
Zandi et al. also provide a breakdown of volume of production as a key indica-
tor of recovery from a disaster, including fishing, chemical production, retail sales,
and home and rental prices (average home sale price and the fair market rent for
a two-bedroom apartment) (2006). Comparisons of production volume over mul-
tiple years is an excellent indicator of the health of the local economy.
Number of residential units destroyed (compare renters and homeowners)
Number of weeks to restore residential units for use
Percent of electrical system shut down
Duration of recovery period to restore utilities
Percent of businesses closed because of the disaster
Percent of businesses open one month or six months after a disaster (recovery
period)
Production level of agricultural commodities or units processed by month (com-
parison of production levels) (single sector or multiple sectors present in a com-
munity). To what extent is the community dependent on a single sector?
© 2009 by Taylor & Francis Group, LLC
148 Natural Hazards Analysis: Reducing the Impact of Disasters
Average weekly wage prior to an event and afterwards (by month)
Percent of homes built prior to 1992 (pick a specific data for a community when
a building code was adopted)
Percent of residents in a flood zone with NFIP flood insurance
Percent of homes, rental units, or businesses with flood insurance
Indicators of Environmental Conditions
In a study of the effects of urban design on aquatic ecosystems in the United States,
Beach (2004) examined the relationship between land use and the effects of sprawl
on both air and water quality. He demonstrated that, as the percent of impervious
surfaces increased in a coastal community, the nature of the water runoff into water
features changed, causing increased levels of nitrogen and phosphorus, organic car-
bon, trace metals such as copper, zinc, and lead, and pesticides (Schueler and Holland
2000). is dynamic is considered coastal sprawl, which is the expansion of low-den-
sity residential and commercial development scattered across large coastal land areas.
e result was that changes in urban growth patterns affected habitat quality, water
temperature, pollutants, and aquatic life. Further, as coastal communities expanded
using traditional development patterns of sprawl, drivers were forced into longer trips
for work, recreation, or just normal shopping impacting air quality.
–20
Employment Loss in Metro New Orleans Area in ousands
0
–40
–60
–80
–100
–120
–140
–160
–180
–200
–131.3
Jul 05
–0.8 Aug 05
Sep 05
Oct 05
Nov 05
Dec 05
Jan 06
Feb 06
Mar 06
Apr 06
May 06
Jun 06
Jul 06
Aug 06
Sep 06
Oct 06
Nov 06
Dec 06
Jan 07
Feb 07
Mar 07
Apr 07
Aug 05
Aug 05
–178.7
–165.6
–153.6
–158.1
–148.2
–135.5
–131.2
–126.0
–119.2
–122.8
–118.5
–113.8
–111.7
–109.4
–107.4
–108.6
–108.1
–103.2
–102.1
–101.8
–101.5
Figure 6.2 Employment loss in Metro New Orleans area in thousands.
© 2009 by Taylor & Francis Group, LLC
Social, Economic, and Ecological Vulnerability 149
Beach’s work centers on a national and even worldwide problem of development
patterns in coastal areas. Coastal counties make up 17% of the land area in the
United States but just 13% of the nation’s acreage. Unfortunately, this coastal zone
is home to more than half of the U.S. population. e issue unfortunately is not in
the present condition but that this coastal region is where the United States is expe-
riencing population increases. We are continuing to put more people in a small area.
Pollution and habitat degradation are the end results of this pattern. e population
density of a community would be part of an effort to determine the burden that
people have on the environment. is indicator alone does not reflect the magni-
tude of human impacts on environmental health. We need further indicators.
Beach cited studies demonstrating that when impervious surfaces cover more
than 10% of a watershed, water features and estuaries become biologically degraded.
A key indicator for a community is the percent of the watershed that is composed
of impervious surfaces. When it exceeds 10% there will be problems, according to
Beach (2004). e fact is that the ecosystem health, including streams, marshes,
and rivers impacted by development, results in less diverse, less stable, and less pro-
ductive watersheds. Walker (1996) examined two streams and compared the effects
of development patterns on the ecosystem health. Increases in impervious surfaces
lead to higher levels of sediments containing higher concentrations of nitrogen and
phosphorus, organic carbon, or metals such as copper, zinc, or lead, as well as petro-
leum hydrocarbons and pesticides (Schueler and Holland 2000). e study found
differences in channel erosion, but also the health of estuaries. Increased levels of
nitrogen lead to algal blooms and fish kills. Increases in fertilizer use in watersheds
also reduce water clarity, allowing less light to penetrate below the water’s surface,
impacting the health of biologic habitats and aquatic habitats.
e issues related to urban development patterns are not limited to the produc-
tivity of watersheds but also to the changes in the volume of water in streams or the
discharge. e fact is that there is an increased threat of flooding as development
increases in a watershed and impervious surfaces increase (Booth 1991; Booth
and Reinelt 1993; National Research Council 2000). Changes in water feature
discharge reflect development patterns and provide a clear indicator for potential
flooding problems in a community.
Changes in impervious surfaces also result in the rise of temperatures in the
water. As the percent of impervious surface area increases in a watershed, the water
temperature increases (Galli 1991). e result may be decreases in oxygen levels
resulting in changes in the marine life and environment.
Hypersprawl is noted as the expansion of residential development with housing
densities of one unit on three acres or less. e indicator in this case would be the
number of housing units per three acres of land. Measuring housing unit density
thus provides us with a means of determining if growth patterns will impact our
water features or watershed habitat and should be adjusted to reduce the harmful
impacts of urban growth.
© 2009 by Taylor & Francis Group, LLC
150 Natural Hazards Analysis: Reducing the Impact of Disasters
Vehicle miles driven by residents also have an impact on environmental health. As
the vehicle miles driven per household increase, air quality is impacted. Unfortunately,
our urban growth patterns require people to drive further, so that the average com-
muter trip increases annually. Many communities have adopted more stringent
regulations requiring the use of cleaner gasoline or additional measures to prevent
pollutants. One can further measure growing emissions by looking at the average
interstate highway travel speed. For the United States, the average speed has dropped
from 53 to 41 miles per hour, or a 23% decline (Wallis et al. 2001). e result of the
decline in the spread is that the average drive takes longer and pollution increases.
EPA has adopted measures to determine when water features might be impacted
negatively from agricultural or related practices (use of fertilizers on commercial or
residential properties). e measure of Total Maximum Daily Loads (TMDLs) is
used by EPA and state regulatory agencies to determine how much pollution a body
of water can accept without becoming degraded.
e use of these environmental indicators thus provide a means of assessment
and monitoring our environment so as to determine if we are having a positive or
negative impact on water or air quality, aquatic habitat, or the risk of potential
flooding in the watershed. Our natural environment as reflected in in Figure 6.3
adds beauty to our quality of life but also contributes to a much broader sustainable
natural system.
To determine how much pollution a body of water can accept without becom-
ing degraded. Examples of indicators of environmental conditions include:
Population density (high density may reflect vulnerability and exposure to spe-
cific risks)
Area contaminated because of hazardous spill and duration of cleanup
Access to transportation infrastructure (access to transportation)
Amount of rainfall per month/annually
Per capita water use
Volume of commercial and or industrial water use
Deforestation
Methodological Issues
When we assess our local economy, as well as our education, public safety, or pub-
lic health systems, we need to view them from the same scale. at is, we would
measure them from a county, city, or neighborhood level. To ensure that any com-
parisons that are made are valid, we should make sure that our data reflect the same
scale. As an example, if we are assessing the capacity of a community to deal with a
disaster, we might obtain data on a county-wide basis and look at Census popula-
tion data, crime rates, educational attainment data, and public health information
for the county. We would then compare the result with other surrounding counties,
© 2009 by Taylor & Francis Group, LLC
Social, Economic, and Ecological Vulnerability 151
the state and the United States. If we have some data at one scale and then other data
at another, it makes our analysis more difficult, including our ability to determine
problems that the community might be facing. e key is to ensure that the infor-
mation that we collect is at the same level (county, census tract, or ZIP code level).
Weighting, Data Availability, and Accuracy
In reviewing the indicators of community vulnerability, a decision would need to
be made as to how we view each indicator. Are they of equal weight, or do some
indicators have a stronger association between the community’s capacity to deal
with a disaster than others? Most hazards analysis studies use an equal weighting
process where all the indicators are treated the same. Some assign specific weights
to various variables (SOPAC 2000).
roughout this text we have stressed the importance of ensuring that data
is current, accurate, and available for use in a hazards analysis. As we examine
Figure 6.3 (See color insert following page 142.) Environmental capital: healthy
forest, clean water, and soils that support fish and wildlife.