Veterinary Medicines in the Environment - Chapter 4 potx
Bạn đang xem bản rút gọn của tài liệu. Xem và tải ngay bản đầy đủ của tài liệu tại đây (1.14 MB, 40 trang )
57
4
Exposure Assessment
of Veterinary Medicines
in Aquatic Systems
Chris Metcalfe, Alistair Boxall, Kathrin Fenner,
Dana Kolpin, Mark Servos, Eric Silberhorn, and
Jane Staveley
4.1 INTRODUCTION
The release of veterinary medicines into the aquatic environment may occur
through direct or indirect pathways. An example of direct release is the use of
medicines in aquaculture (Armstrong et al. 2005; Davies et al. 1998), where chem-
icals used to treat sh are added directly to water. Indirect releases, in which med-
icines make their way to water through transport from other matrices, include the
application of animal manure to land or direct excretion of residues onto pasture
land, from which the therapeutic chemicals may be transported into the aquatic
environment (Jørgensen and Halling-Sørensen 2000; Boxall et al. 2003, 2004).
Veterinary medicines used to treat companion animals may also be transported
into the aquatic environment through disposal of unused medicines, veterinary
waste, or animal carcasses (Daughton and Ternes 1999; Boxall et al. 2004). The
potential for a veterinary medicine to be released to the aquatic environment will
be determined by several different criteria, including the method of treatment,
agriculture or aquaculture practices, environmental conditions, and the properties
of the veterinary medicine.
During the environmental risk assessment process for veterinary medicines,
it is generally necessary to assess the potential for aquatic exposure to the prod-
uct being assessed. For example, in the VICH phase I process, it is necessary to
estimate aquatic exposure concentrations for aquaculture products, and during
the phase II process it is also necessary to determine exposure concentrations
for products used in livestock treatments. Assessment of exposure must take into
account the many different pathways and scenarios that inuence the transport
of veterinary medicines into the aquatic environment. In some cases, we have a
good understanding of how these exposure scenarios can be evaluated, whereas
in other cases, there is insufcient knowledge to guide the exposure assessments.
Therefore, in this chapter we evaluate the current state of our knowledge con-
cerning exposure of veterinary medicines in aquatic systems and synthesize the
© 2009 by the Society of Environmental Toxicology and Chemistry (SETAC)
58 Veterinary Medicines in the Environment
available data on fate and transport. We have also identied gaps and uncertain-
ties in our understanding of exposure in order to inform the regulatory commu-
nity and identify research needs.
4.2 SOURCES OF VETERINARY MEDICINES
IN THE AQUATIC ENVIRONMENT
From Chapter 2, it is clear that there are many potential sources of emission of
veterinary medicines into the environment. This chapter focuses on direct or
indirect pathways by which medicines can reach the aquatic environment. In the
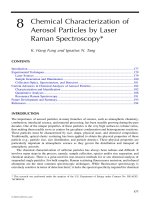
following sections, we review the inputs of veterinary medicines into our water
resources, including both groundwater and surface water (Figure 4.1), through
their use in agriculture and aquaculture.
4.2.1 TREATMENTS USED IN AGRICULTURE
The likelihood of exposures in the aquatic environment and the potential magni-
tude of these exposures will vary for different pathways (Table 4.1). However, the
major route of entry into the environment is probably under conditions of inten-
sive agriculture (Table 4.1, Section 1A). Veterinary medicines are excreted by the
animal in urine and dung, and this manure material is collected and subsequently
applied to agricultural land (Halling-Sørensen et al. 2001; and see Chapter 2).
TERRESTRIAL APPL ICATIONS AQUATIC APPLICATIONS
External application Internal application Aquaculture
Dung
Manure or slurry
Metabolism in the body
storage
Runoff and drainage
leaching
Groundwater
Surface water and sediment
Soil
FIGURE 4.1 Direct and indirect pathways for the release of veterinary medicines into
the aquatic environment.
© 2009 by the Society of Environmental Toxicology and Chemistry (SETAC)
Exposure Assessment of Veterinary Medicines in Aquatic Systems 59
Although each class of livestock production has different housing and manure
production characteristics, the distribution routes for veterinary medicines are
essentially similar. Following application onto soil, medicines may leach to shal-
low groundwater or be transported to surface water through runoff or tile ow
(Hirsch et al. 1999; Meyer et al. 2000; Kay et al. 2004, 2005; Burkhard et al.
2005; Stoob et al. 2007). Potentially important releases into the aquatic envi-
ronment can also occur when manure storage facilities overow because of rain
events or are breached by oods or when manure is accidentally spilled during
storage or transport (Table 4.1, 2A). When manure is stored in lagoons, veterinary
medicines may leach from these structures into groundwater or surface water
(Table 4.1, 3A). The potential for impacts from manure spills or releases from
lagoon sites should not be underestimated. For instance, in the state of Iowa in the
United States, more than 1000 aerobic and anaerobic lagoons for manure storage
and associated retention basins have been identied. The Department of Natural
Resources in Iowa recorded 414 sh kills in the 10-year period between 1995 and
2002. These sh kills were thought to be related to spills during manure trans-
port. These sources of veterinary medicines into the environment are not likely
to be an important factor in product approvals, but they may be important con-
siderations for product labeling or for the development of best management prac-
tices for manure storage and transport. Another signicant but probably lower
magnitude source of veterinary medicines is the deposition of urine and dung
onto pasture land by animals that are being raised under low-density conditions
(Table 4.1, 1B). Direct excretion of veterinary medicines in dung or urine into sur-
face water may also occur when pasture animals have access to rivers, streams,
or ponds (Table 4.1, 4B).
Inputs of substances that are applied and act externally may also be impor-
tant (e.g., ectoparasiticides). Various substances are used externally on pasture
animals, poultry, and companion animals for the treatment of external or internal
parasites and infection. Sheep in particular require treatments for scab, blowy,
ticks, and lice that include plunge dipping, pour-on formulations, and the use of
showers. The sheep dip products include insecticides from the pyrethroid (i.e.,
cypermethrin) and organophosphate (i.e., diazinon) classes. With externally
applied veterinary medicines, both direct and indirect releases to the aquatic
environment can occur (Table 4.1, 4B). Wash off of chemicals from the surface
of recently treated animals to soil, water, and hard surfaces (e.g., concrete) may
occur on the farm, during transport, or at stock markets (Littlejohn and Melvin
1991). Wash off of chemicals may also be a source of veterinary medicines from
companion animals, although the magnitude of these releases is probably small
(Table 4.1, 5C). In dipping practice, chemicals may enter watercourses following
disposal of used dip and leakage of used dip from dipping installations (Table 4.1,
6A and 6B). Other topically applied veterinary medicines that are likely to wash
off following use include udder disinfectants (containing anti-infective agents) for
dairy cattle and endoparasiticides for treating cattle.
Contaminated water that was used to wash indoor animal holding facilities
may be transported out of the farmyard or may be collected for later application to
© 2009 by the Society of Environmental Toxicology and Chemistry (SETAC)
60 Veterinary Medicines in the Environment
TABLE 4.1
Major sources of veterinary medicines and the activities leading to
exposure in aquatic environments
Source (animal — likelihood and magnitude)
Activity
A:
intensive
B:
pasture
C:
companion
animals
VICH
guidance
scenario
Need for
further
guidance
1) Direct excretion of
manure from animal
onto land, or land
application of
manure, litter, or
compost (slurry
and/or sludge) after
collection or storage
C, Ho, P
H5
C, P, Ho,
S, E
H3
X
H1
Y (for intensive
and pasture)
N
2) Manure spills,
overows during
transport
C, Ho, P
M/5
—— N Y
3) Lagoon leakage,
including runoff and
transport to
groundwater
C, Ho
H2
—— N Y
4) Direct excretion of
dung and urine from
animal into surface
water
— C, P, Ho,
S, E
M2
—Y—
5) Wash off of animals
from external
treatments (e.g. dips
and pour-ons)
— C,S
L3
X
L1
Y—
6) Direct spillage of
product and feeds
containing product
C, Ho, P
L2
C, P, Ho,
S, E
L1
—NN
7) Farm wastewater,
wash waters, etc.,
that do not go to a
lagoon
C, Ho, P,
E
M3
—— N N
8) Runoff from hard
surfaces: feedlots
C, Ho, P
H5
—— Y —
9) Runoff from hard
surfaces: barnyards
C, Ho
M4
C, S, E
L2
X
L1
Y—
10) Wastewater
treatment plants
S, C
L1
—X
L1
NN
11) Processing plant
wastes
C, Ho, P,
E
H1
—— N N
© 2009 by the Society of Environmental Toxicology and Chemistry (SETAC)
Exposure Assessment of Veterinary Medicines in Aquatic Systems 61
land (Table 4.1, 7A). In North America, intensive cattle production practices usu-
ally include housing of animals in feedlots for nal weight gain prior to slaughter.
The runoff of medicines from the hard surfaces of feedlots as a result of rain
events may be a signicant source of contamination of surface water (Table 4.1,
8A). Medicines washed off, excreted, or spilled onto farmyard hard surfaces may
be washed off to surface waters during periods of rainfall (Table 4.1, 9A and 9B).
Other potential sources of contamination are emissions of dipping chemicals
from wool-washing plants (Armstrong and Philips 1998) or emissions of therapeu-
tic medicines from milk-processing plants. Wastewaters from these facilities are
generally treated, but removal during treatment may not be adequate (Table 4.1,
10A). Veterinary medicines in the feces of companion animals that are deposited
into domestic sewage may also be discharged from municipal treatment plants
(Table 4.1, 10C). Although withdrawal periods are supposed to be sufcient to
clear veterinary medicines from animal tissues, it is possible that liquid wastes
from meat-processing plants may also contain these contaminants if waste-
water treatment is not effective at removing these compounds (Table 4.1, 11A).
Finally, the inappropriate disposal of containers and administration equipment
(i.e., syringes and inserts) for veterinary medicines, or the deposition of these
materials into landlls, could be a source to the aquatic environment (Table 4.1,
12A, 12B, and 12C).
4.2.2 TREATMENTS USED IN AQUACULTURE
The primary pathway for direct inputs of veterinary medicines to the aquatic
environment is through intensive aquaculture. Like other forms of intensive
food production, aquaculture will have environmental impacts, including high
inputs of nutrients. Cultured sh and commercially important invertebrates
TABLE 4.1 (continued)
Major sources of veterinary medicines and the activities leading to
exposure in aquatic environments
Source (animal — likelihood and magnitude)
Activity
A:
intensive
B:
pasture
C:
companion
animals
VICH
guidance
scenario
Need for
further
guidance
12) Disposal of inserts,
containers in landll,
etc.
C, P, Ho,
S, E
L2
C, P, Ho,
S, E
L2
X
L2
NN
Note: Animal: C = cattle, Ho = hogs, P = poultry, S = sheep/goats, E = horses, X = companion ani-
mals, All = All animals. Likelihood of exposure: H = high, M = moderate, L = low. Magnitude
of exposure: 5 (high) to 1 (low). The availability of exposure guidance (Committee for Medici-
nal Products for Veterinary Use [CVMP] 2006) is identied.
© 2009 by the Society of Environmental Toxicology and Chemistry (SETAC)
62 Veterinary Medicines in the Environment
(e.g., crustaceans and mollusks) raised in the crowded and stressful conditions of
aquaculture are susceptible to epidemics of infectious bacterial, viral, and para-
sitic diseases. For example, salmon are prone to infection from parasitic sea lice
that can have serious impacts on the health and marketability of the sh. Control
of sea lice infestations requires good sh husbandry but frequently requires treat-
ments with chemicals that are applied either by bath (immersion) or in medicated
feeds. Antibiotics are used in both marine and freshwater aquaculture applica-
tions, with medicated feed being the primary mode of administration. However,
sh can also be treated with antibiotics by immersion using soluble formulations.
Infections of the integument and gills in freshwater sh are typically treated using
baths with chemicals that are not specic to a target pathogen (e.g., hydrogen per-
oxide, potassium permanganate, or copper sulphate). Chemotherapeutic agents in
baths may be released directly into the aquatic environment once the treatment is
complete. A signicant portion of the chemotherapeutics in medicated feeds may
leave aquaculture facilities in feces or in surplus food (Lunestad 1992; Samuelsen
et al. 1992a, 1992b). For example, certain antibiotics such as oxytetracycline are
poorly absorbed by sh and are excreted largely unchanged in the feces. Thus,
veterinary medicines may be present in water and sediment via surplus medicated
feed or excretion by treated animals.
4.3 EXPERIMENTAL STUDIES INTO THE ENTRY, FATE,
AND TRANSPORT OF VETERINARY MEDICINES
IN AQUATIC SYSTEMS
4.3.1 A
QUATIC EXPOSURE TO VETERINARY MEDICINES USED
TO
TREAT LIVESTOCK
Livestock medicines will either be excreted directly to soil or applied to soil in
manure or slurry (see Chapter 2). Contaminants applied to soil can be transported
to aquatic systems via surface runoff, subsurface ow, and drainow. The extent
of transport via any of these processes is determined by a range of factors, includ-
ing the solubility, sorption behavior, and persistence of the contaminant; the phys-
ical structure, pH, organic carbon content, and cation exchange capacity of the
soil matrix; and climatic conditions such as temperature and rainfall volume and
intensity (Boxall et al. 2006). Most work to date on contaminant transport from
agricultural elds has focused on pesticides, nutrients, and bacteria, but recently
a number of studies have explored the fate and transport of veterinary medicines.
Lysimeter, eld plot, and full-scale eld studies have investigated the transport of
veterinary medicines from the soil surface to eld drains, ditches, streams, riv-
ers, and groundwater (e.g., Aga et al. 2003; Kay et al. 2004, 2005; Burkhard et al.
2005; Hamscher et al. 2005; Lissemore et al. 2006; Stoob et al. 2007). A range of
experimental designs and sampling methodologies has been used. These investi-
gations are described in more detail below and are summarized in Table 4.3.
© 2009 by the Society of Environmental Toxicology and Chemistry (SETAC)
Exposure Assessment of Veterinary Medicines in Aquatic Systems 63
4.3.1.1 Leaching to Groundwater
The movement of sulfonamide and tetracycline antibiotics in soil proles was
investigated at the eld scale using suction probes (Hamscher et al. 2000a; Black-
well et al. 2005, 2007). In these studies, sulfonamides were detected in soil pore
water at depths of both 0.8 and 1.4 m, but tetracyclines were not, most likely due
to their high potential for sorption to soil. Carlson and Mabury (2006) reported
that chlortetracycline applied to agricultural soil in manure was detected at soil
depths of 25 and 35 cm, but monensin remained in the upper soil layers. There
are only a few reports of veterinary medicines in groundwater (Hirsch et al. 1999;
Hamscher et al. 2000a; Krapac et al. 2005). In an extensive monitoring study con-
ducted in Germany (Hirsch et al. 1999), antibiotics were detected in groundwater
at only 4 sites. Although contamination at 2 of the sites was attributed to irrigation
of agricultural land with domestic sewage and hence measurements were prob-
ably due to the use of sulfamethazine in human medicine, the authors concluded
that contamination of groundwater by the veterinary antibiotic sulfamethazine at
2 of the sites was due to applications of manure (Hirsch et al. 1999).
4.3.1.2 Movement to Surface Water
Transport of veterinary medicines via runoff (i.e., overland ow) has been
observed for tetracycline antibiotics (i.e., oxytetracycline) and sulfonamide
antibiotics (i.e., sulfadiazine, sulfamethazine, sulfathiazole, and sulfachloro-
pyridazine), as reported by Kay et al. (2005), Kreuzig et al. (2005), and Gupta
et al. (2003). The transport of these substances is inuenced by the sorption
behavior of the compounds, the presence of manure in the soil matrix, and the
nature of the land to which the manure is applied. Runoff of highly sorptive sub-
stances, such as tetracyclines, was observed to be signicantly lower than that of
the more mobile sulfonamides (Kay et al. 2005). However, even for the relatively
water-soluble sulfonamides, total mass losses to surface water have been reported
to lie only between 0.04% and 0.6% of the mass applied under actual eld condi-
tions (Stoob et al. 2007). The presence of manure slurry incorporated into a soil
matrix was observed to increase the transport of sulfonamides via runoff by 10 to
40 times in comparison to runoff, following direct application of these medicines
to grassland soils (Burkhard et al. 2005). Possible explanations for this observa-
tion include physical “sealing” of the soil surface by the slurry or a change in pH
as a result of manure addition that altered the speciation and fate of the medicines
(Burkhard et al. 2005). It has been shown that overland transport from ploughed
soils is signicantly lower than runoff from grasslands (Kreuzig et al. 2005).
The transport of a range of antibacterial substances (i.e., tetracyclines, mac-
rolides, sulfonamides, and trimethoprim) has been investigated using lysimeter
and eld-based studies in tile-drained clay soils (Gupta et al. 2003; Kay et al.
2005, 2004; Boxall et al. 2006). Following application of pig slurry spiked with
© 2009 by the Society of Environmental Toxicology and Chemistry (SETAC)
64 Veterinary Medicines in the Environment
antibiotics to an untilled eld, test compounds were detected in drainow at con-
centrations up to a maximum of 613 µg L
–1
for oxytetracyline and 36 µg L
–1
for
sulfachloropyridazine (Kay et al. 2004). Spiking concentrations for the test com-
pounds were all similar, so differences in maximum concentrations were likely
due to differences in sorption behavior. In a subsequent investigation at the same
site (Kay et al. 2004), in which the soil was tilled, much lower concentrations
were observed in the drainow (i.e., 6.1 µg L
–1
for sulfachloropyridazine and
0.8 µg L
–1
for oxytetracyline). Although the pig slurry used in these studies was
obtained from a pig farm where tylosin was used as a prophylactic treatment, this
substance was not detected in any drainow samples, possibly because it is not
persistent in slurry (Loke et al. 2000).
Once a veterinary medicine is introduced into the environment on a farm or
in an aquaculture facility, there are many processes that will affect its fate in the
aquatic environment, including partitioning, biological degradation, photolysis,
and hydrolysis. These fate processes were reviewed by Boxall et al. (2004). Parti-
tioning to organic material may limit bioavailability and inuence environmental
fate. The chemicals may enter aquatic systems in association with organic matter
(dissolved or particulate) or in the aqueous (dissolved) phase. Many of the tetracy-
cline antibiotics interact strongly with organic matter, which may limit their bio-
logical availability. The quinolones, tetracyclines, ivermectin, and furazolidone
are all rapidly photodegraded, with half-lives ranging from < 1 hour to 22 days,
whereas trimethoprim, ormethoprim, and the sulfonamides are not readily pho-
todegradable (Boxall et al. 2004). Ceftiofur is one of the few veterinary com-
pounds identied that is subject to rapid hydrolysis, with a half-life of 8 days at
pH. Although propetamphos was rapidly hydrolyzed at pH 3, at environmentally
relevant pH levels (6 and 9), hydrolysis of this compound was much slower.
Monitoring of streams and rivers in close proximity to treated elds has been
performed to assess the potential for transport to receiving waters due to the inputs
described above. In a small stream receiving drainow inputs from elds where
trimethoprim, sulfadiazine, oxytetracycline, and lincomycin had been applied,
maximum concentrations ranged from 0.02 to 21.1 µg L
–1
for sulfadiazine and
lincomycin, respectively (Boxall et al. 2006). At this site medicines were also
detected in sediment at concentrations ranging from 0.5 µg kg
–1
for trimethoprim
to 813 µg kg
–1
for oxytetracycline. At a site where there was transport of veteri-
nary medicines from agricultural elds by both drainow and runoff, maximum
concentrations of sulfonamides in a small ditch adjacent to elds treated with pig
slurry ranged from 0.5 µg L
–1
for sulfamethazine to 5 µg L
–1
for sulfamethoxazole
(Stoob et al. 2007). In a region of the Grand River system in Ontario, Canada,
that passes through agricultural areas, Lissemore et al. (2006) detected several
veterinary medicines at ng L
–1
concentrations, including lincomycin, monensin,
and sulfamethazine. The maximum mean concentration of monensin observed at
a site in the Grand River was 332 ng L
–1
(Lissemore et al. 2006).
© 2009 by the Society of Environmental Toxicology and Chemistry (SETAC)
Exposure Assessment of Veterinary Medicines in Aquatic Systems 65
4.3.1.3 Predicting Exposure
Guidelines are available on how to assess exposure to livestock medicines in
aquatic systems (International Cooperation on Harmonization of the Technical
Requirements for Registration of Veterinary Medicinal [VICH] 2004; Commit-
tee for Medicinal Products for Veterinary Use [CVMP] 2006) through the most
common pathways. A number of approaches have been developed for predicting
concentrations of veterinary medicines in soil, groundwater, and surface waters
(e.g., Spaepen et al. 1997; Montforts 1999). Generally, at early stages in the risk
assessment process, simple algorithms are used that provide a conservative esti-
mation of exposure in soils. If an environmental risk is shown at this stage, more
sophisticated models are used. An outline of a number of the different algorithms
is provided below, and, where possible, we have tried to evaluate these against
experimental data.
In order to estimate the concentrations of veterinary medicines in aquatic sys-
tems, a prediction of the likely concentration in soils is required as a starting point.
Estimates of exposure concentrations in soil are typically derived using models
and model scenarios. The available modeling approaches for estimating concen-
trations in soils are described in detail in Chapter 6 (Section 6.7).
Concentrations in groundwater (PEC
groundwater
) and surface water (PEC
surface water
)
are estimated from the soil concentrations. Maximum concentrations in
groundwater can initially be approximated by pore water concentrations (i.e.,
PEC
groundwater
= PEC
pore water
), which can be derived according to equations laid
out in the guidelines for evaluating exposures to new and existing substances
(CVMP 2006). Based on these pore water concentrations, surface water concen-
trations are approximated by assuming runoff and drainow concentrations to
equal pore water concentrations, and subsequently applying a dilution factor of
10 to simulate the dilution of these concentrations in a small surface water body
(i.e., PEC
surface water
= PEC
pore water
/10). If these highly conservative approximations
indicate a risk to the environment, more advanced models are recommended for
calculating PECs in groundwater and surface water. Two modeling approaches
have been recommended for use with veterinary medicines, namely, VetCalc and
FOCUS (CVMP 2006). These are described in more detail below.
VetCalc (Veterinary Medicines Directorate n.d.) estimates PEC values for
groundwater and surface water using 12 predened scenarios in Europe, which
were chosen on the basis of the size, diversity, and importance of livestock pro-
duction; the range of agricultural practices covered by the scenarios; and distribu-
tion over 3 different European climate zones (Mediterranean, Central Europe,
and Continental Scandinavian). Each of the scenarios has been ranked in terms
of its potential for predicting inputs from specic livestock animals (e.g., cattle,
sheep, pigs, and poultry). The model also includes the typical manure manage-
ment practices for the region on which the scenario is based. The VetCalc tool
addresses a wide variety of agricultural and environmental situations, including
characteristics of the major livestock animals, associated manure characteristics,
© 2009 by the Society of Environmental Toxicology and Chemistry (SETAC)
66 Veterinary Medicines in the Environment
local agricultural practices, characteristics of the receiving environment (e.g., soil
or water), and the fate and behavior of chemicals within 3 critical compartments
(i.e., soil, surface water, and groundwater).
Background information on these key drivers is taken into account in each
scenario within the model database. Based on the dosage regime and chemical
characteristics, VetCalc rst calculates initial predicted concentrations in soil and
manure. These are then used to simulate transport to surface water through runoff
and leaching to groundwater. A third, fugacity-based model simulates the subse-
quent fate in surface water.
Another suite of mechanistic environmental models and accompanying sce-
narios has been created by a working group in Europe known as the Forum for the
Coordination of Pesticide Fate Models and Their Use (FOCUS n.d.) to simulate
the fate and transport of pesticides in the environment. Groundwater calculations
developed by FOCUS involve the simulation of the leaching behavior of pes-
ticides using a set of 3 models (PEARL, PELMO, and MACRO) in a series of
up to 9 geographic settings that have various combinations of crops, soils, and
climate. Groundwater concentrations are estimated by determining the annual
average concentrations in shallow groundwater (1 meter soil depth) for a period
of 20 consecutive years, then rank ordering the annual average values and select-
ing the 80th percentile value for comparison with the 0.1 g L
–1
drinking water
standard that has been established by the European Union.
The surface water and sediment calculations are performed using an over-
all calculation shell called SWASH (surface water scenarios help) that controls
4 models that simulate runoff and erosion (pesticide root zone model, or PRZM),
leaching to eld drains (MACRO), spray drift (internal to SWASH), and, nally,
aquatic fate in ditches, ponds, and streams (toxic substances in surface waters, or
TOXSWA). These simulations provide detailed assessments of potential aquatic
concentrations in a range of water bodies located in up to 10 geographical and
climatic settings. FOCUS models were originally designed for exposure assess-
ments of pesticides. However, the CVMP guidance document (2006) provides
some recommendations on how the model can be manipulated for applications to
veterinary medicines, although much more model validation is needed to assess
model performance for veterinary medicines.
4.3.1.4 Comparison of Modeled Concentrations
with Measured Concentrations
The relatively simple algorithms suggested by CVMP (2006) for predictions of
PECs in groundwater and in surface water would be expected to yield conserva-
tive estimates of levels in the environment. To test this assumption, we compared
measured environmental concentrations (MECs) for soil, leachate, runoff, drain-
ow, and groundwater from the semield and eld studies to PECs for soil, pore
water, and surface water predicted according to the algorithms reviewed above.
Wherever possible, actual measured or spiked manure concentrations were
used as the starting point for the calculation of soil concentrations. Also, where
© 2009 by the Society of Environmental Toxicology and Chemistry (SETAC)
Exposure Assessment of Veterinary Medicines in Aquatic Systems 67
possible, actual depths of incorporation were used instead of the default value of
5 cm. In all other cases, default concentrations in manure for a given animal type
and veterinary medicine had to be predicted from a knowledge of the treatment
dosage and regime (Spaepen et al. 1997). Measured concentrations were either
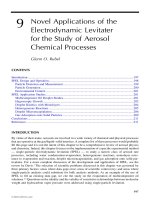
close to or signicantly lower than the predicted concentrations, indicating that the
models are indeed conservative (Figure 4.2). In those cases where manure load-
ings had to be estimated, the predicted soil concentrations were highly conserva-
tive. In those cases, where manure concentrations were either measured or spiked,
there was better agreement between predicted and measured soil concentrations.
To see whether algorithms for aquatic PECs were also conservative, PECs
in soil pore water were estimated using minimum and median K
oc
values and
then compared to measured concentrations in leachate, groundwater, drainow,
and runoff from 8 of the studies listed in Table 4.2. Again, the results show that
the pore water PECs are usually conservative estimates of the measured con-
centrations (Figure 4.2). However, when measured concentrations in receiving
waters are compared to surface water predictions derived from the pore water
predictions, there were 3 instances where measured concentrations exceeded
predicted concentrations (Figure 4.3). In all 3 cases, the substance belonged to
the tetracycline group. This is in agreement with the ndings of Kay et al. (2004)
that indicate that strongly sorbing compounds such as tetracyclines can be trans-
ported bound to colloidal organic matter. This mode of transport is currently not
FIGURE 4.2 Comparison of predicted pore water concentrations with measured maxi-
mum concentrations in leachate, groundwater, drainow, and runoff water for 8 veterinary
medicines for which measured concentrations were available in eld and semield studies.
Predicted concentration pore water (μg/L)
Measured concentration in pore water (μg/L)
0.0001 0.001 0.01
0.01
0.1
0.1
1
1
10
10
100
100
1000
1000
10000
10000
© 2009 by the Society of Environmental Toxicology and Chemistry (SETAC)
68 Veterinary Medicines in the Environment
TABLE 4.2
Field scale and column studies reported in the literature on the fate and transport of veterinary medicines
Study Location Study substances
Study
scale Application
Manure
type
Manure
storage
Matrices
analyzed
Sampling
regime
Application
rate
Soil
data
Climate
data
1) Aga et al.
(2003)
Illinois, US Tetracycline Column Natural Pig U S, L Set times Y Detailed Continuous
irrigation
2) Boxall et al.
(2005)
Derbyshire, UK Lincomycin
Oxytetracycline
Sulfadiazine
Trimethoprim
Field Natural Pig Y S, SW
S: set times;
SW:
continuous
Calculated Detailed Y
3) Blackwell
et al. (2007)
Derbyshire, UK Oxytetracycline
Sulfachloropyridazine
Tylosin
Plot Spiked (except
tylosin)
Pig Y S, IW Set times Y Detailed Y
4) Burkhard
et al. (2005)
Zürich,
Switzerland
Sulfadiazine
Sulfadimidine
Sulfathiazole
Plot Spiked manure
or aqueous
solution
Pig U OF Continuous Y Detailed irrigation
5) Gupta et al.
(2003)
Minnesota, US Tetracycline
Chlortetracycline
Tylosin
Plot Natural Pig Y OF, DW Continuous Y Some
data
N
6) Halling-
Sørensen
et al. (2005)
Askov and
Lundgaard,
Denmark
Chlortetracycline
Tylosin
Field Natural Pig Y S
Set times Calculated Detailed Y
7) Hamscher
et al. (2005)
Lower Saxony,
Germany
Tetracycline
Chlortetracycline
Sulfamethazine
Sulfadiazine
Field Natural Pig Y S, GW
Set times Y Y N
© 2009 by the Society of Environmental Toxicology and Chemistry (SETAC)
Exposure Assessment of Veterinary Medicines in Aquatic Systems 69
8) Mackie
et al. (2006)
Illinois, US Tetracycline
Chlortetracycline
Oxytetracycline
Anhydrotetracycline
B-apooxytetracycline
Anhydrochlortetracycline
Field Natural Pig Y GW, M Grab N Limited N
9) Kay et al.
(2004)
Cestershire, UK Oxytetracycline
Sulfachloropyridazine
Tylosin
Field Spiked manure
(except tylosin)
Pig Y DW, S S: set times
DW:
continuous
Y (except
tylosin)
Detailed Y
10) Kay et al.
(2005)
Cestershire, UK Oxytetracycline
Sulfachloropyridazine
Tylosin
Lysimeter Spiked (except
tylosin)
Pig Y S,L Continuous Y (except
tylosin)
Detailed Y
11) Kay et al.
(2005)
Cestershire, UK Oxytetracycline
Sulfachloropyridazine
Tylosin
Plot Spiked (except
tylosin)
Pig Y OF Continuous Y (except
tylosin)
Detailed Y
12) Kreuzig and
Holtge
(2005)
Lower Saxony,
Germany
Sulfadiazine Plot and
lysimeter
Spiked Pig NA S, L Set times Y Detailed Irrigation
13) Kreuzig
et al. (2005)
Lower Saxony,
Germany
Sulfadiazine Plot Spiked Pig NA OF Continuous Y Detailed Irrigation
14) Stoob et al.
(2007)
Switzerland Sulfamethoxazole
Sulfadimethoxine
Sulfamethazine
Field Spiked manure
(except
sulfamethazine)
Pig Y SW Continuous Y Detailed Y
Note: Y = yes, N = no, M = manure, S= soil, IW = interstitial water, GW = groundwater, SW = surface water, DW= drainage w
ater, OF = overland ow water, L = leachate, Se =
sediment.
© 2009 by the Society of Environmental Toxicology and Chemistry (SETAC)
70 Veterinary Medicines in the Environment
considered in the simple algorithms suggested by CVMP (2006). Thus, in the
case of strongly sorbing compounds, the algorithms may not provide a conserva-
tive estimate of the PEC.
VetCalc was also evaluated against measured concentrations. The persistence
and K
oc
values used in this evaluation are summarized in Table 4.3. VetCalc esti-
mates of concentrations in soil were generally higher than measured soil concen-
trations under eld application conditions (Figure 4.4). The only exception was
tylosin, where the predicted soil concentration was 10 orders of magnitude lower
than the measured soil concentration, which was 0.03 mg kg. The model assessment
for tylosin considered degradation during storage and assumed a typical manure
storage scenario, but it is possible that the eld storage duration was signicantly
lower than the default value, explaining the higher measured concentrations.
For concentrations in surface water, with the exception of oxytetracycline,
there was always at least 1 VetCalc scenario that predicted higher concentrations
than the measured maximum concentrations (Figure 4.5). There were also always
some VetCalc scenarios that resulted in predicted concentrations lower than mea-
sured concentrations. This is not perhaps surprising, as eld studies are generally
performed at sites that are known to be vulnerable to transport of chemicals to
water, whereas VetCalc models the fate of substances across a range of European
agricultural, soil, and climatic scenarios. For our case study compounds, the sce-
narios for Belgium, Denmark, Finland, France, Germany, and the United King-
dom tended to give estimates of surface water concentrations that were lower than
FIGURE 4.3 Comparison of predicted surface water concentrations with measured con-
centrations for surface water for 9 veterinary medicines for which measured concentra-
tions were available in eld studies.
Predicted concentration in surface water (μg/L)
Measured concentration in surface water (μg/L)
0.01
0.01
0.1
0.1
1
1
10
10
100
100
1000 10000
© 2009 by the Society of Environmental Toxicology and Chemistry (SETAC)
Exposure Assessment of Veterinary Medicines in Aquatic Systems 71
TABLE 4.3
Input data on chemical and physical parameters of veterinary medicines used in modeling
exercises
Substance CAS
Treatment
group
Dose
(mg kg
–1
d
–1
)
Treatment
duration (d)
Kd
(L kg
–1
) Koc (L kg
–1
)
DT50
(d)
Chlortetracycline 64-72-2 Hogs 20 7 4681-34270000
Median 400522
—
Enrooxacin Poultry 10 10 3037
5612
1230
260
496
6310
3548
4670
5986
186342
768740
99975
16506
70914
Median 99975
359-696
Lincomycin 154-21-2 Hogs 22 21 111 5.2
Monensin
9.3 7.4
7.5
Oxytetracycline 6153-64-6 Hogs 20
15 680
670
1026
417
42506
47881
93317
27792
Median 47932
18
16
(continued on next page)
© 2009 by the Society of Environmental Toxicology and Chemistry (SETAC)
72 Veterinary Medicines in the Environment
TABLE 4.3 (continued)
Input data on chemical and physical parameters of veterinary medicines used in modeling
exercises
Substance CAS
Treatment
group
Dose
(mg kg
–1
d
–1
)
Treatment
duration (d)
Kd
(L kg
–1
) Koc (L kg
–1
)
DT50
(d)
Sulfachloropyridazine 80-32-0 Hogs 20
10 3.3
8.1
16
18
Median 17
2.8
3.5
Sulfadiazine 68-35-9 Hogs 25 3 61 10.4
Sulfamethazine 57-68-1 Hogs
Min 46
Median 110
Sulfathiazole 72-14-0 Hogs
116
176
80
Median 118
Sulfadimethoxine
Min 89
Median 144
Sulfamethoxazole
Min
Tetracycline 60-54-8 Hogs 60
5 — 2723-65090000
Median 420999
Trimethoprim 738-70-5 Hogs 8 5 1680-3990
Median 2589
110
Tylosin 1401-69-0 Hogs 25 3 200-7988
Median 1264
< 2 (pig
slurry)
95
97
© 2009 by the Society of Environmental Toxicology and Chemistry (SETAC)
Exposure Assessment of Veterinary Medicines in Aquatic Systems 73
the measured concentrations reported in the few studies on veterinary medicines
in European surface waters. As with the simple algorithms, surface water con-
centrations of oxytetracycline were underpredicted, probably because colloidal or
particle-bound transport is not currently considered by VetCalc.
4.3.2 AQUACULTURE TREATMENTS
Veterinary medicines are widely used in aquaculture. For example, it is estimated
that more than 200 000 kg of antibiotics are used annually in US aquaculture
(Benbrook 2002), with about 75% of the antibiotics administered in aquacul-
ture entering the environment via excretion of feces and uneaten medicated feed
FIGURE 4.4 Comparison of VetCalc predictions of environmental concentration in soil
(PEC
soil
) under 12 scenarios with data on measured soil concentrations (MEC
soil
).
max : 550 μg/L
: 184 μg/L
chlorotetra-
cycline
lyncomycin oxytetra-
cycline
sulfadiazine trimethoprim
Maximal measured or predicted
surface water concentrations
(μg/L)
0
5
10
15
20
25
30
35
40
45
50
predicted
measured
FIGURE 4.5 Comparison of VetCalc predictions of environmental concentration in
surface water (PEC
surface water
) under 12 scenarios with data on measured surface water
concentrations (MEC
surface water
).
tylosin chlorotetra-
cycline
lynco-
mycin
oxytetra-
cycline
sulfadiazine sulfachloro-
pyridazine
Maximal measured or predicted soil
concentrations (mg/kg)
0
1
2
3
4
5
6
7
predicted
measured
© 2009 by the Society of Environmental Toxicology and Chemistry (SETAC)
74 Veterinary Medicines in the Environment
(Lalumera et al. 2004). The inputs and use vary between marine and freshwater
facilities. It has been recently recognized that the prophylactic use of antibiotics
in aquaculture is a growing environmental problem (Cabello 2006), particularly
in developing countries.
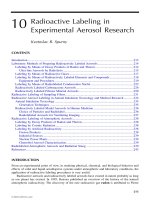
Four general types of systems are used in aquaculture: ponds, net pen cage,
ow-through systems (e.g., Figure 4.6), and recirculating systems. The potential
exposure pathways differ between the systems. Floating and bottom-culture sys-
tems are also used for culturing of mussels, clams, and oysters, but medicines are
rarely used to treat these organisms. In each of these systems there are 2 major
sources of medicine release: emissions from bath treatments or medicated feeds.
!"%
$
!#
#
$%
!
&
!!
!
"$
!!
!
'"!
FIGURE 4.6 Schematic of a typical ow-through aquaculture facility showing the basic
and optional components of the system.
© 2009 by the Society of Environmental Toxicology and Chemistry (SETAC)
Exposure Assessment of Veterinary Medicines in Aquatic Systems 75
Baths can be either static or ow-through, depending on the type of aquaculture
system and species being raised. Detailed information on the construction, opera-
tion, and maintenance of these different aquaculture facility types can be found
elsewhere (e.g., Lazur and Britt 1997; Losordo et al. 1999; Mazik and Parker 2001;
Tucker et al. 2001; Chen et al. 2002; Hargreaves et al. 2002; Steeby and Avery
2002; Whitis 2002; Stickney 2002; US Environmental Protection Agency 2004).
4.3.2.1 Inputs and Fate of Marine Aquaculture Treatments
Both antibiotics and sea lice treatments are used in marine aquaculture. Sea lice
treatments include the organophosphates (azamethiphos), pyrethroids (cyper-
methrin and deltamethrin), hydrogen peroxide, avermectin compounds (emamec-
tin benzoate), and chitin synthesis inhibitors (teubenzuron and diubenzuron).
Depending on the class, these may be administered either as a bath treatment or
as additives in medicated feed. Bath treatments are conducted by reducing the
depth of the net in the salmon cage, thus reducing the volume of water. The net
pen and enclosed salmon are surrounded by an impervious barrier, and the chem-
ical is added to the recommended treatment concentration. The salmon are main-
tained in the bath for a period of 30 to 60 minutes, and then the barrier is removed
and the treatment chemical is allowed to disperse into the surrounding water.
Medicated feeds are prepared by adding concentrated mix containing the active
ingredient to the feed during commercial preparation. The therapeutic agent is
absorbed from the feed into the sh and is then transferred to the sea lice as they
feed on the skin of the salmon. Medicated feeds are the primary method used to
control sea lice in salmon aquaculture because of ease of use, safer handling by
aquaculture personnel, and lower potential for losses to the environment (Burka
et al. 1997; Alderman and Hastings 1998; Haya et al. 2005).
Avermectins are often used in medicated feeds because of their efcacy and
low cost. The avermectin compound that is licensed for use in sea lice control is
emamectin benzoate. Avermectins can reach the marine environment in uneaten
feed pellets, or in the feces or biliary products excreted by sh. Emamectin ben-
zoate is relatively persistent, is hydrophobic, and has the potential to adsorb to
particulate material and marine sediments (Scottish Environmental Protection
Agency [SEPA] 1999; Haya et al. 2005). In a eld trial conducted in Scotland
(SEPA 1999), this compound was occasionally detected in water samples at con-
centrations of up to 1.06 µg L
–1
, but it was detected frequently in sediment sam-
ples near the salmon cages at concentrations up to 2.73 µg kg. This compound and
its metabolites were detected in sediments up to 12 month post treatment.
A small number of antibiotics are registered for use in the sh aquacul-
ture industry in Canada, the United States, and northern Europe. These include
amoxicillin, orfenicol, and substances from the quinolone, uoroquinolone,
sulfonamide (including potentiated sulfonamides), and tetracycline classes. Both
amoxicillin and orfenicol degrade rapidly in the environment. In contrast,
substances from the quinolone groups have been detected around aquaculture
facilities. For example, in a study conducted off the southwest coast of Finland,
© 2009 by the Society of Environmental Toxicology and Chemistry (SETAC)
76 Veterinary Medicines in the Environment
residues of oxolinic acid were detected in anoxic sediments collected below net
pens at concentrations up to 0.2 mg kg
–1
at 5 days posttreatment (Björklund et al.
1991). Oxytetracycline has been widely studied in terms of its environmental fate
and persistence. The absorption rate of oxytetracycline across the gut wall in
salmon is low (< 2% of the administered dose), and therefore fecal matter would
be expected to contain high concentrations of antibiotics (Samuelson et al. 1992a;
Weston 1996). Unconsumed antibiotic-treated feed pellets will be deposited
directly below the pen site or, in high current areas, may be distributed more
broadly. Mass balance budgets for oxytetracycline in the vicinity of salmon farms
have shown that 5% to 11% of the total oxytetracycline input could be accounted
for in sediment residues (Björklund et al. 1990; Coyne et al. 1994; Capone et al.
1996). From these data, it appears that most of the excreted oxytetracycline parti-
tions into the dissolved and particle-associated phases of the water column. How-
ever, no study has directly measured the distribution of oxytetracycline in water
around an aquaculture site following feed application.
Accumulation of antibiotics in sediments can occur either by direct deposi-
tion of treated feed in the vicinity of net pens or by adsorption of antibiotics
onto settling particles (Pouliquen et al. 1992). For example, concentrations of
oxytetracycline measured in coastal marine sediment at pen sites varied from
<10 mg kg
–1
(Björklund et al. 1991) to a maximum of 240 mg kg
–1
(Coyne et al.
1994). This antibiotic has also been detected in anoxic sediments near net pens
in Norway and Finland for periods of more than 1 year after treatment (Björk-
lund et al. 1991). The half-life of oxytetracycline in sediment was prolonged to
419 days under stagnant, anoxic conditions (Björklund et al. 1990).
4.3.2.2 Freshwater Aquaculture
There is a variety of veterinary medicines used in freshwater aquaculture,
although compared to marine aquaculture there has been little research examin-
ing the environmental occurrence of veterinary medicines following use in fresh-
water aquaculture. Most research has focused on determining concentrations in
water discharged or adjacent to sh aquaculture operations that have used antibi-
otic treatments (Smith et al. 1994; Bebak-Williams et al. 2002; Dietze et al. 2005),
with some examination of concentrations in sediment (Lalumera et al. 2004;
Bebak-Williams et al. 2002) and tissues (Xu et al. 2006; Wrzesinski et al. 2006).
For example, Dietze et al. (2005) reported that maximum antibiotic concentra-
tions in water reached 36 µg L
–1
during treatment and remained detectable for up
to 48 days following treatment. These concentrations were similar to concentra-
tions found in pig slurry lagoons (Meyer et al. 2003), so it is obvious that fresh-
water aquaculture has the potential to be an important source for the release of
antibiotics into the aquatic environment. Preliminary results indicate that more
frequent and higher antibiotic concentrations may be found in water from inten-
sive aquaculture facilities, relative to less intensive hatcheries (Dietze et al. 2005).
Antibiotics could accumulate in sh tissues, water, and sediment to a greater
extent in recirculating systems (Bebak-Williams et al. 2002).
© 2009 by the Society of Environmental Toxicology and Chemistry (SETAC)
Exposure Assessment of Veterinary Medicines in Aquatic Systems 77
4.3.2.3 Modeling Exposure from Aquaculture Treatments
Although exposure assessment approaches are available for estimating environ-
mental concentrations of aquaculture treatments (e.g., VICH 2004; CVMP 2006),
these are not well developed. For example, it is currently recommended for phase
I assessments (CVMP 2006) that the PEC be estimated by calculating the total
amount of active ingredient that is added to an aquaculture system and then sub-
tracting the amount that is retained in “sludge” (i.e., waste material that is ltered
or settles out within the facility). This calculation is not appropriate for assess-
ing aquatic exposures under many aquaculture scenarios, such as exposures in
net pens. In addition, limited guidance is available for higher tier assessments of
products intended for use in aquaculture.
Therefore, in this section, several simple algorithms are proposed for cal-
culating “generic” initial predicted environmental concentrations (PEC
initial
, also
known as environmental introduction concentrations) for veterinary medicines
applied in baths or in medicated feeds in the 4 general types of aquaculture sys-
tems described earlier. For closed or self-contained facilities, these PEC values
represent the concentrations of the veterinary medicine expected in efuents
at the point of release or discharge to surface water. For open systems, such as
marine net pens, the PECs represent concentrations at points immediately adja-
cent to the treatment area that may disperse laterally and vertically to a wider
environment. Guidance is also provided on ways to rene exposure assessments
using medicine-specic and/or facility-specic data.
Because of the wide variability in the design and operation of different aqua-
culture facilities it is preferable, when possible, to develop a series of facility-
specic PECs for use in risk assessment. Unfortunately, it is difcult to do this,
particularly for preapproval assessments of new medicines, because of the large
number of potential facilities, the lack of facility-specic data, and the need to
approve medicines on a country- or region-wide basis. However, in some cases,
survey data may be available for representative aquaculture facilities that would
be expected to use a medicine, once approved, or for facilities that are using a
particular medicine while it is undergoing investigational use, prior to approval.
These data could include such things as ow rates, treatment intervals, tank and
raceway sizes, solids or medicine removal rates, and surface water dilution factors.
These data may be used to develop a range of PECs, and in some instances may
allow for the development of probabilistic exposure assessments (see Chapter 3).
We do not recommend a specic default dilution factor, or factors, for calcu-
lating the PEC
sw-initial
(SW = surface water). Dilution factors representing the ratio
of the combined ow rate (volume and time) of the receiving water and the efu-
ent discharge, divided by the ow rate of the efuent discharge alone, may range
from 1 (no dilution) for efuent-dominated headwaters to 1 million or more for
large rivers. For an initial assessment, it is suggested that “reasonable worst-case”
scenarios be developed to determine appropriate, but conservative, dilution fac-
tors for each of the aquaculture systems in which use of the medicine occurs or is
expected to occur. The location of use and type of receiving water (stream, river,
© 2009 by the Society of Environmental Toxicology and Chemistry (SETAC)
78 Veterinary Medicines in the Environment
lake, estuary, etc.) will be the most important factors to consider in developing
these scenarios. Dilution will often vary signicantly with the season and weather,
so consideration should be given as to when the discharge will most likely occur.
This will depend on the medicine, what it is used for (e.g., species and indication),
where it is used, and when it is most likely to be used. For example, unintentional
discharges, such as those due to ooding of ponds, are most likely to occur during
periods of high rainfall when ow rates in receiving waters will also be high. In
contrast, medicines used in ow-through systems are more likely to be discharged
year-round, including during periods of low ow.
We caution against using a default dilution factor for the calculation of
PEC
sw-initial
without rst consulting the appropriate regulatory authority for infor-
mation on efuent discharges. Regulations in some jurisdictions, such as certain
states in the United States, do not allow any toxicity in the mixing zone where
an efuent discharges to and mixes with surface water. This means that dilution
cannot be considered and assessments must be based on concentrations at the end
of the pipe, where the efuent discharges.
4.3.2.3.1 Pond Systems
Medicated feeds and bath (immersion) treatments are both used to administer
medicines to aquaculture species reared in closed ponds, which include most
levee and watershed ponds that are operated as closed (static) systems with inter-
mittent ow during lling and draining operations. Aquaculture ponds may also
be operated as open systems with a continual inow and outow. Calculations for
“open” ponds are addressed in the section on ow-through systems. Whole-pond
bath treatments are not usually an economical alternative for most aquaculture
medicines; therefore, most treatments are made via medicated feeds. Exceptions
include oxidants such as potassium permanganate, metallic salts such as copper
sulfate, and parasiticides such as formalin. Some of these compounds may be
classied as medicines, pesticides, biocides, or disinfectants, depending on the
jurisdiction and their intended use.
The release of veterinary medicines from aquaculture ponds is usually inter-
mittent or irregular and may be either controlled (e.g., due to draw-down for har-
vesting or cleaning) or uncontrolled (e.g., through overtopping of dams or levees
during ood conditions). The magnitude of the release will depend on several fac-
tors, including the type of medicine treatment (feed versus bath), the persistence
of the medicine in pond water, and the time of the discharge in relation to the
time of the treatments. In most cases, the time of discharge will be well after the
time of treatments. However, because the discharge is not always controllable, it
is recommended that the PEC
initial
be conservatively calculated under the assump-
tion that the entire amount of medicine originally applied to the pond is present in
the water column at the time of discharge.
4.3.2.3.2 Pond Systems with Bath Treatments
For levee ponds with bath treatments, the PEC
initial
is simply the treatment con-
centration (as active ingredient, or a.i.) in mg L
–1
(ppm). In most cases, this
© 2009 by the Society of Environmental Toxicology and Chemistry (SETAC)
Exposure Assessment of Veterinary Medicines in Aquatic Systems 79
concentration is specied on the medicine product label. If not, it may be calcu-
lated as follows:
PEC
initial
rr
r
MP
V
1 000 000
100
,,
(4.1)
where
M = mass of medicinal product added to pond (kg)
1 000 000 = conversion factor (kg to mg)
P = percentage of active ingredient in medicine (w/w)
100 = conversion factor (percentage to fraction a.i.)
V = volume of pond (L)
For information on methods for determining the volumes of ponds, consult SRAC
Publication No. 103 (Masser and Jensen 1991).
For aquatic life in receiving waters, the PEC
sw-initial
is determined from the
PEC
initial
by taking into account dilution in the receiving water, but assuming no
other degradation or dissipation (e.g., adsorption) of the medicine prior to dis-
charge from the pond.
PEC =
PEC
Dilution Factor
sw-i nitial
initial
For watershed ponds undergoing bath treatments, the PEC
initial
is the treatment dose
in mg L
–1
, adjusted for the potential inow and outow of pond water prior to
discharge. In most cases this is probably not signicant, so the same algorithms
used above for the levee pond scenario with a bath treatment may be used here to
calculate the PEC
initial
and PEC
sw-initial
.
4.3.2.3.3 Pond Systems with Feed Treatments
With a medicated feed treatment used in a levee pond, the concentration in water
is estimated at the end of the treatment period, when it is expected to be highest.
The conservative default assumption for an initial assessment is that 100% of the
medicine that is initially present in medicated feed is subsequently released to
the water column (within the treatment period) through a combination of leach-
ing from feed and uptake and excretion by the animals being treated. It is also
assumed that there is no other degradation or dissipation of the medicine prior to
discharge from the pond. The PEC calculation is as follows:
PEC
BW
initial
rrr()DNfL
V
(4.2)
where
D = dose of the active ingredient (mg kg
–1
body weight day
–1
)
BW = body weight of all animals being treated (kg)
N = number of days of medicated feed treatment
f = fraction of medicine metabolized in sh
L = feed lost to sediment
V = volume of pond (L)
© 2009 by the Society of Environmental Toxicology and Chemistry (SETAC)
80 Veterinary Medicines in the Environment
The daily treatment dose of the active ingredient (mg kg
–1
body weight day
–1
)
is usually specied on product labeling, but can be calculated based on feeding
rate information for the species and life stage being treated if the concentration
of the medicine in the feed is known. Fish are typically fed a percentage of their
body weight each day, which may vary from < 1% to 10% or more depending on
the species, size of sh, water temperature, and other factors. For catsh, daily
feed requirements range from 1.2% body weight per day (% BW) for a 500 g sh
at 22.8 °C to 3.0% BW for a 20 g sh at 20.0 °C (Westers 2001). Publications by
Westers (2001), Huet (1994), Shepherd and Bromage (1992), or other experts can
be consulted for species-specic information.
The PEC is directly proportional to the biomass of animals in the pond, which
is often expressed in terms of density (e.g., kg m
–3
, kg ha
–1
). Density will vary
depending on the species, size, time of year, and other factors such as whether
or not there is supplemental aeration. In general, pond systems cannot support
nearly the same densities as ow-through systems because dissolved oxygen will
become limiting as the density increases. Fish densities in closed ponds may
range from about 0.05 kg m
–3
up to 2 kg m
–3
, depending on the amount of fertil-
ization, supplemental feeding, and aeration (Westers 2001). Because small sh
have a higher metabolic rate and consume more oxygen per unit of body weight
than large sh, they cannot be raised to as high a density. For example, ngerling
catsh are raised to a density of 0.33–0.67 kg m
–3
in 1-meter-deep ponds, whereas
adult catsh are raised to a density of 1.1 kg m
–3
.
If adequate and reliable data are available, the PEC
initial
may be adjusted by
taking into account the amount of feed consumed compared to the total amount
fed. This should only be done if the medicine is not very soluble in water and is
unlikely to leach from the uneaten feed back into the water column. Adsorption,
metabolism, and excretion data for the medicine in the species being treated may
also be used to adjust the PEC
initial
if these data are available, and as long as there
is adequate information to indicate that the metabolites have signicantly reduced
toxicity compared to the parent compound. If data on the metabolites are not avail-
able, it is generally assumed that they are just as active as the parent, and a total
residue approach is used to calculate the PEC
initial
. Some veterinary medicines,
including many antibiotics, are poorly absorbed in the gut and are largely excreted
unchanged in the feces. In this case, it is generally assumed that the medicine will
leach from the feces once excreted and will contribute to the PEC
initial
.
For aquatic life in receiving waters, the PEC
sw-initial
is determined from the
PEC
initial
by taking into account dilution in the receiving water, in the same way
as described previously for levee ponds.
Algorithms for a watershed pond with feed treatments are the same as shown
above for the levee pond with feed treatment. In theory, it may be possible to
adjust the initial PEC values by taking into account the volume of water owing
into and out of the watershed pond during the period of treatment with medicated
feed. However, in practice this is very difcult to do because the ow rate will
depend on the amount of local runoff to the pond, which in turn will depend
on the watershed-to-pond area, the amount of precipitation and evaporation, and
© 2009 by the Society of Environmental Toxicology and Chemistry (SETAC)
Exposure Assessment of Veterinary Medicines in Aquatic Systems 81
watershed characteristics such as slope, type and extent of vegetative cover, soil
type, and antecedent moisture.
4.3.2.3.4 Net Pen and Cage Systems
Most aquaculture operations using net pens and cage systems are located in
coastal marine waters, or in large freshwater lakes and reservoirs using oating
enclosures. Atlantic salmon are the most common species reared in these systems
worldwide; however, signicant production of other species also occurs in these
systems on a local basis (e.g., yellowtail and red sea bream in Japan). In the future,
greater use of these systems is expected in off-shore and deep-water environments
as the technology advances. In order to minimize storm damage, most of these
off-shore systems will be submerged, or anchored on the seabed.
4.3.2.3.5 Net Pen and Cage Systems with Bath Treatments
In open water systems, bath treatments of sh in individual net pens are made
using an impermeable barrier or liner (e.g., tarpaulin) to hold the medicine during
treatment. The liner is placed outside of the net pen, and then both it and the net
pen are raised until the sh are conned to a small area. The amount of applied
medicine is based on the volume of the conned area. Once the treatment period
has ended, the net pen and liner are lowered back into the water, the liner is
removed, and the solution of medicine is allowed to disperse by the action of tide,
waves, and currents. Treatments are usually made 1 pen at a time and as needed.
This type of treatment is most common for control of ectoparasites such as sea
lice, but may be effective for external bacterial and fungal diseases.
The PEC
initial
for this scenario is based on the volume of a single net pen, which
is considered to be the location from which the medicine is released to the greater
environment. Therefore, the PEC
initial
is the medicine concentration in the treated
volume (i.e., enclosed in the barrier) after dilution into the total volume of the net
pen in the lowered position. The equation described above for a levee pond with a
bath treatment may be used to calculate the PEC
initial
, except in this case the vol-
ume of the net pen is substituted for the volume of the pond. Information on the
amount (kg) of medicine applied in the conned area during treatment is needed
in order to calculate the PEC
initial
. This can be calculated knowing the treatment
concentration and volume of the conned area. A water depth of 3 m for the con-
ned area during treatment may be assumed if specic data are not available.
To determine the PEC
sw-initial
, dilution of the medicine is taken into account
assuming a water column mixing zone that includes the area within and extend-
ing laterally some distance beyond the perimeter of the net pen in all directions
on the surface and vertically down to the sea oor and water column interface.
According to the permits for Atlantic salmon aquaculture issued by the Depart-
ment of Environmental Protection for the state of Maine, United States, the lateral
distance beyond the net pen perimeter is stipulated to be 30 m. This distance
is based on requirements that the discharges from salmon aquaculture facilities
should not cause conditions that are toxic to aquatic life outside of the allocated
mixing zone. In the absence of other site-specic information, this 30-m lateral
© 2009 by the Society of Environmental Toxicology and Chemistry (SETAC)