Sustainable Growth and Applications in Renewable Energy Sources Part 4 potx
Bạn đang xem bản rút gọn của tài liệu. Xem và tải ngay bản đầy đủ của tài liệu tại đây (830.06 KB, 20 trang )
Renewable Energy Use and Energy Efficiency – A Critical Tool for Sustainable Development
51
3. They are clean and pollution-free and therefore are sustainable natural form of energy.
4. They can be cheaply and continuously harvested and therefore sustainable source of
energy.
Unlike the nuclear and fossil fuel plants which belong to big companies, governments, or
state around enterprises, renewable energy can be set up in small units and is therefore
suitable for community management and ownership. In this way, value from renewable
energy projects can be kept in the community.
Transition from fossil fuels to renewable energy will not result in net job losses or cause
harm to the economy. Renewal energy technologies (RETs) are labour intensive, and can
produce more jobs than fossil fuel or nuclear industries. When RETs are properly integrated
into national development plans and implemented, they can substantially reduce
greenhouse gas emissions and simultaneously increase employment (Pearce et al, 1989).
Moreover, it will also enhance energy security by reducing reliance on oil, preserve the
competitiveness of energy, lead to savings for consumers and provide transitional assistance
to workers in negatively affected industries and communities. With the right approach the
interest of working families and the environment can come together (Pearce et al, 1989).
2. What is energy efficiency?
Energy efficiency means improvement in practice and products that reduce the energy
necessary to provide services like lightning, cooling, heating, manufacturing, cooking,
transport, entertainment etc. Energy efficiency products essentially help to do more work
with less energy. Thus, the efficiency of an appliance or technology is determined by the
amount of energy needed to provide the energy service. For instance, to light a room
with an incandescent light bulb of 60w for one hour requires 60w/h. A compact
florescent light bulb would provide the same or better lighting at 11w and only use
11w/h. This means that 49w (82% of energy) is saved for each hour the light is turned
on.
Making homes, vehicles, and businesses more energy efficient is seen as a largely
untapped solution to addressing the problems of pollution, global warming, energy
security, and fossil fuel depletion. Many of these ideas have been discussed for years,
since the 1973 oil crisis brought energy issues to the forefront. In the late 1970s, physicist
Amory Lovins popularized the notion of a "soft energy path", with a strong focus on
energy efficiency. Among other things, Lovins popularized the notion of negawatts—the
idea of meeting energy needs by increasing efficiency instead of increasing energy
production (Krech, 2004).
Lovins viewed the energy problem not one of an insufficient supply of oil and other
conventional energy sources, but rather as one of inefficient energy use, coupled with lack of
development of renewable energy sources. Lovins argued that conventional energy
production was both energy intensive and a source of substantial pollution. With his
reformulation of the energy problem, "environmentalists criticized plans for large-scale
energy developments, especially those relying heavily on nuclear power".
The "soft energy path" assumes that energy is but a means to social ends, and is not an end
in itself. Soft energy paths involve efficient use of energy, diversity of energy production
methods (matched in scale and quality to end uses), and special reliance on co-generation
and "soft energy technologies" such as solar energy, wind energy, bio-fuels, geothermal
energy, wave power, tidal power, etc (Nash, 1979).
Sustainable Growth and Applications in Renewable Energy Sources
52
Soft energy technologies (appropriate renewables) have five defining characteristics. They
(1) rely on renewable energy resources, (2) are diverse and designed for maximum
effectiveness in particular circumstances, (3) are flexible and relatively simple to understand,
(4) are matched to end-use needs in terms of scale, and (5) are matched to end-use needs in
terms of quality (Nash, 1979).
Residential solar energy technologies are prime examples of soft energy technologies and
rapid deployment of simple, energy conserving residential solar energy technologies is
fundamental to a soft energy strategy. Active residential solar technologies use special
devices to collect and convert the sun's rays to useful energy and are located near the
users they supply. Passive residential solar technologies involve the natural transfer (by
radiation, convection and conduction) of solar energy without the use of mechanical
devices.
Lovins argued that besides environmental benefits, global political stresses might be
reduced by Western nations committing to the soft energy path. In general, soft path
impacts are seen to be more "gentle, pleasant and manageable" than hard path impacts.
These impacts range from the individual and household level to those affecting the very
fabric of society at the national and international level.
Lovins recognised that major energy decisions are always implemented gradually and
incrementally, and that major shifts take decades. A chief element of the soft path strategy is
to avoid major commitments to inflexible infrastructure that locks us into particular supply
patterns for decades.
Lovins explained that the most profound difference between the soft and hard paths — the
difference that ultimately distinguishes them — is their different socio-political impact. Both
paths entail social change, "but the kinds of social change for a hard path are apt to be less
pleasant, less plausible, less compatible with social diversity and freedom of choice, and less
consistent with traditional values than are the social changes which could make a soft path
work".
Moving towards energy sustainability will require changes not only in the way energy is
supplied, but in the way it is used, and reducing the amount of energy required to deliver
various goods or services is essential. Opportunities for improvement on the demand side of
the energy equation are as rich and diverse as those on the supply side, and often offer
significant economic benefits.
In most places, a lot of energy is wasted because industries, power companies, offices and
households use more energy than is actually necessary to fulfill their needs. The reasons is
because they use old and inefficient equipment and production processes; buildings are
poorly designed; and because of bad practices and habits. With energy efficiency practices
and products, nations can save over 50% of the energy being consumed. Using energy more
efficiently would:
1. Reduce electricity bills.
2. Leave more energy available to extend energy supply to all parts of the population.
3. Increase the efficiency and resilience of the economy – including reduced reliance on oil
and thus improve balance of payments.
4. Improve industries competitiveness internationally.
5. Minimize the building of new power stations and thus free up capital for other
investments like health and welfare.
Renewable Energy Use and Energy Efficiency – A Critical Tool for Sustainable Development
53
6. Reduce the negative environmental and human health impacts from energy production
and use.
7. Increase employment through interactions e.g. in industry, housing, transport.
3. Renewable energy and sustainable development
The World Summit on Sustainable Development (WSSD) in Johannesburg in 2002
recognized the important role of energy for reaching millennium development goals. Access
to affordable, reliable and sustainable energy is essential to sustainable development
(Hasna, 2007). An adequate solving of energy problems will contribute to achieving
progress across all pillars of sustainable development; social, economic and environmental
and in meeting the UN millennium goals. Although there are no MDGs on access to energy,
WSSD recognized that inadequate access to energy is both a cause and an effect of poverty
and recommended the following:
“Take joint actions and improve efforts to work together at all levels to improve access to reliable and
affordable energy service for sustainable development sufficient to facilitate the achievement of the
Millennium Development Goals, including the goal of halving the proportion of people in poverty by
2015, and as a means to generate other important services that mitigate poverty, bearing in mind
that access to energy facilitates the eradication of poverty” .
“Sustainable development” has been defined best by the Brundtland Commission as
development that meets the needs of the present without compromising the ability of future
generations to meet their own needs (Hasna, 2007). Adequate and affordable energy
supplies has been key to economic development and the transition from subsistence
agricultural economics to modern industrial and service oriented societies. Energy is central
to improved social and economic well being and is indispensable to most industrial and
commercial wealth organization. It is the key for relieving poverty, improving human
welfare and raising living standards. But however essential it may be for development,
energy is only a means to an end. The end is good health, high living standards, a
sustainable economy and a clean environment.
Much of the current energy supply and use, based as it is, on limited resources of fossil
fuels, is deemed to be environmentally unsustainable. There is no energy production or
conversion technology without risk or waste. Somewhere along all energy chains - from
resource extractions to the provision of energy service – pollutants are produced, emitted or
disposed of, often with severe health and environmental impacts (Dasgupta, 2001; Fatona,
2009). Combustion of fossil fuels is chiefly responsible for urban air pollution, regional
acidification and the risk of human – induced climate change (Dasgupta, 2001; Fatona, 2009).
Achieving sustainable economic development on a global scale will requires the judicious
use of resources, technology, appropriate economic incentives and strategic policy planning
at the local and national levels. It will also require regular monitoring of the impacts of
selected policies and strategies to see if they are furthering sustainable development or if
they should be adjusted (Arrow et al, 2004).
When choosing energy fuels and associated technologies for the production, delivery and
use of energy services, it is essential to take into account economic, social and environmental
consequences (Ott, 2003; Wallace, 2005). There is need to determine whether current energy
use is sustainable and, if not, how to change it so that it is. This is the purpose of energy
indicators, which address important issues within three of the major dimensions of
sustainable development: economic, social and environmental.
Sustainable Growth and Applications in Renewable Energy Sources
54
4. Energy indicators for sustainable development
4.1 Social dimension
SOC1: Share of households (or population) without electricity or commercial energy, or
heavily dependent on non-commercial energy
Households (or population) without electricity or commercial energy, or heavily
dependent on non-commercial energy
Total number of households or population
SOC2: Share of household income spent on fuel and electricity
Household income spent on fuel and electricity
Household income (total and poorest 20% of population)
SOC3: Household energy use for each income group and corresponding fuel mix
Energy use per household for each income group (quintiles)
Household income for each income group (quintiles)
Corresponding fuel mix for each income group (quintiles)
SOC4: Accident fatalities per energy produced by fuel chain
Annual fatalities by fuel chain
Annual energy produced
4.2 Economic dimension
ECO1: Energy use per capita
Energy use (total primary energy supply, total final consumption and electricity use)
Total population
ECO2: Energy use per unit of GDP
Energy use (total primary energy supply, total final consumption and electricity use)
GDP
ECO3: Efficiency of energy conversion and distribution
Losses in transformation systems including losses in electricity generation, transmission
and distribution
ECO4: Reserves-to-production ratio
Proven recoverable reserves
Total energy production
ECO5: Resources-to-production ratio
Total estimated resources
Total energy production
ECO6: Industrial energy intensities
Energy use in industrial sector and by manufacturing branch
Corresponding value added
ECO7: Agricultural energy intensities
Energy use in agricultural sector
Corresponding value added
ECO8: Service and commercial energy intensities
Energy use in service and commercial sector
Corresponding value added
ECO9: Household energy intensities
Energy use in households and by key end use
Renewable Energy Use and Energy Efficiency – A Critical Tool for Sustainable Development
55
Number of households, floor area, persons per household, appliance ownership
ECO10: Transport energy intensities
Energy use in passenger travel and freight sectors and by mode
Passenger-km travel and tonne-km freight and by mode
ECO11: Fuel shares in energy and electricity
Primary energy supply and final consumption, electricity generation and generating
capacity by fuel type
Total primary energy supply, total final consumption, total electricity generation and
total generating capacity
ECO12: Non-carbon energy share in energy and electricity
Primary supply, electricity generation and generating capacity by non-carbon energy
Total primary energy supply, total electricity generation and total generating capacity
ECO13: Renewable energy share in energy and electricity
Primary energy supply, final consumption and electricity generation and generating
capacity by renewable energy
Total primary energy supply, total final consumption, total electricity generation and
total generating capacity
ECO14: End-use energy prices by fuel and by sector
Energy prices (with and without taxes or subsidies)
ECO15: Net energy import dependency
Energy imports
Total primary energy supply
ECO16: Stocks of critical fuels per corresponding fuel consumption
Stocks of critical fuel (e.g. oil and gas)
Critical fuel consumption
4.3 Environmental dimension
ENV1: Greenhouse gas (GHG) emissions from energy production and use, per capita and
per unit of GDP
Population and GDP
ENV2: Ambient concentrations of air pollutants in urban areas
Concentrations of pollutants in air
ENV3: Air pollutant emissions from energy systems
Air pollutant emissions
ENV4: Contaminant discharges in liquid effluents from energy systems
Contaminant discharges in liquid effluents
ENV5: Soil area where acidification exceeds critical load
Affected soil area
Critical load
ENV6: Rate of deforestation attributed to energy use
Forest area at two different times
Biomass utilization
ENV7: Ratio of solid waste generation to units of energy produced
Amount of solid waste
Energy produced
Sustainable Growth and Applications in Renewable Energy Sources
56
ENV8: Ratio of solid waste properly disposed of to total generated solid waste
Amount of solid waste properly disposed of
Total amount of solid waste
ENV9: Ratio of solid radioactive waste to units of energy produced
Amount of radioactive waste (cumulative for a selected period of time)
Energy produced
ENV10: Ratio of solid radioactive waste awaiting disposal to total generated solid
radioactive waste
Amount of radioactive waste awaiting disposal
Total volume of radioactive waste
5. Dimensions of sustainable development
Sustainable development is essentially about improving quality of life in a way that can be
sustained, economically and environmentally, over the long term supported by the
institutional structure of the country (Adams, 2006; Chambers et al, 2000).
Scheme of sustainable development: at the confluence of three constituent parts
Renewable Energy Use and Energy Efficiency – A Critical Tool for Sustainable Development
57
Social dimension:- Availability of energy has a direct impact on poverty, employment
opportunities, demographic transition, pollution and health. Social equity is one of the
principal values underlying sustainable development, involving the degree of fairness and
inclusiveness with which energy resources are distributed, energy systems are made
accessible and pricing schemes are formulated to ensure affordability. Energy should be
available to all at a fair price.
The use of energy should not damage human health, but rather should improve it by
improving conditions. Yet the production of non renewable has the potential to cause injury
or disease through pollution generation or accidents. A social goal is to reduce or eliminate
these negative impacts. The health indicators have the sub theme of safety, which covers
accident fatalities caused by the extraction, conversion, transmission / distribution and use
of energy. Oil rigs and particularly coal mines are subjected to accidents that injure, main or
kill people. Oil refineries and power stations may release emissions into the air that cause
lung or respiratory diseases.
Economic dimension:- Modern economics depend on a reliable and adequate energy
supply, and developing countries need to secure this as a prerequisite for industrialization.
All sectors of the economy – residential, commercial, transport, service and agriculture
demand modern energy services. These services in turn foster economic and social
development at the local level by raising productivity and enabling local income generation.
Energy supply affects jobs, productivity and development.
The prices of end-use energy by fuel and sector have obvious economic importance.
Efficient energy pricing is a key to efficient energy supply and use and socially efficient
levels of pollution abatement.
Addressing energy security is one of the major objectives in the sustainable development
criteria of many countries. Interruptions of energy supply can cause serious financial and
economic issues. To support the goals of sustainable development, energy must be available
at all times, in sufficient quantities and at affordable prices. Secure energy supplies are
essential to maintain economic activities and providing reliable energy services to society.
Environmental dimension:- The production, distribution and use of energy create pressures
on the environment in the household, workplace and city and at the national, regional and
global levels. The environmental impacts can depend greatly on how energy is produced
and used, the fuel mix, the structure of the energy systems and related energy regulatory
actions and pricing structure. Gaseous emissions from the burning of fossil fuels pollute the
atmosphere. Large hydropower dams cause silting. Both the coal and nuclear fuel cycles
emit some radiation and generate waste. And gathering firewood can lead to deforestation
and desertification Daly & Cobb, 1990; Hilgenkamp, 2005).
Water and land quality are important sub-themes of the environmental dimensions. Land is
more than just physical space and surface topography; it is in itself an important natural
resource, consisting of soil and water essential for growing food and providing habitat for
diverse plant and animal communities. Non – renewable energy activities may result in land
degradation and acidification that affect the quality of water and agricultural productivity.
Land is also affected by energy transformation processes that often produce solid wastes,
including radioactive wastes, which require adequate disposal. Water quality is affected by
the discharge of contaminants in liquid effluents from energy systems, particularly from the
mining of non renewable energy resources, which is environmentally unsustainable (Daly &
Cobb1990; Hilgenkamp, 2005).
Sustainable Growth and Applications in Renewable Energy Sources
58
Environmental sustainability is the process of making sure current processes of interaction
with the environment are pursued with the idea of keeping the environment as pristine as
naturally possible based on ideal-seeking behavior.
Consumption of renewable
resources
State of environment Sustainability
More than nature's ability to
replenish
Environmental
degradation
Not sustainable
Equal to nature's ability to
replenish
Environmental
equilibrium
Steady state economy
Less than nature's ability to
replenish
Environmental renewal
Environmentally
sustainable
An "unsustainable situation" occurs when natural capital (the sum total of nature's
resources) is used up faster than it can be replenished. Sustainability requires that human
activity only uses nature's resources at a rate at which they can be replenished naturally
(Barbier, 2007). Inherently the concept of sustainable development is intertwined with the
concept of carrying capacity. Theoretically, the long-term result of environmental
degradation is the inability to sustain human life. Such degradation on a global scale could
imply extinction for humanity.
6. Conclusion
There is an intimate connection between energy, the environment and sustainable
development. A society seeking sustainable development ideally must utilize only energy
resources which cause no environmental impact. Clearly, a strong relation exists between
energy efficiency and environmental impact since, for the same services or products, less
resource utilization and pollution is normally associated with increased energy efficiency.
Sustainable energy is the provision of energy that meets the needs of the present without
compromising the ability of future generations to meet their needs. Sustainable energy
sources are most often regarded as including all renewable energy sources, such as
hydroelectricity, solar energy, wind energy, wave power, geothermal energy, bio-energy,
and tidal power. It usually also includes technologies that improve energy efficiency.
Renewable energy technologies are essential contributors to sustainable energy as they
generally contribute to world energy security, reducing dependence on fossil fuel resources
and providing opportunities for mitigating greenhouse gases. As such, sustainable energy
promotes sustainability. Sustainability, here, is twofold, as it constitutes self-sustenance and
the ability to foster sustainable development.
By being self-sustaining the energy source is in essence limitless. Solar energy, wind energy,
geothermal energy, hydropower and biomass are all self-sustaining. They all have sources
that cannot be depleted. These energy sources allow for the conservation of other energy
sources, like trees that would have been used for charcoal production. Using these
"renewable" energies also encourages the protection of the environment which traditional
energy sources have helped to destroy. The use of some traditional energy sources, like oil
and charcoal, the Natural Resources Conservation Authority (NRCA) reported "carries with
Renewable Energy Use and Energy Efficiency – A Critical Tool for Sustainable Development
59
it a number of environmental problems, such as water and air pollution and the
contamination of soils." Utilizing sustainable energy would then lead to the conservation of
the environment which would eventually lead to a development which meets the needs of
the present, without compromising the ability of future generations to meet their own
needs. In other words, sustainable energy use leads to sustainable development.
7. References
Adams, W.M. (2006). The future of sustainability: Rethinking environment and
development in the twenty-first century. Report of the IUCN renowned Thinkers
Meeting, 29-31 January 2006
American Council for an Energy-Efficient Economy (2007). The twin pillars of sustainable
energy: Synergies betweenenergy efficiency and renewable energy technology and
policy report E074
Arrow KJ, P. Dasgupta, L. Goulder, G Daily, PR Ehrlich, GM Heal, S Levin, K-G Maler, S
Schneider, DA Starrett, B Walker. (2004). Are we consuming too much? Journal of
Economic Perspectives, 18(3):147–172
Associated Plasma Laboratory (LAP) (n.d.) Accessed June June 24,
2011
Barbier, E. (2007). Natural Resources and Economic Development, Cambridge University
Press
Chambers N., C. Simmons & M. Wakernagel (2000). Sharing Nature’s Interest: Ecological
Footprint as an Indicator of Sustainability. Earthscan, London.
Dasgupta, P. (2001). Human Well-Being and the Natural Environment. Oxford University
Press, Oxford.
Daly H. & J.B. Cobb Jr (1990). For the Common Good, Green Print. The Merlin Press,
London.
Fatona, P. Olugbenga (2009). Energy exploitation, utilization and its environmental effects –
the choice to make and the decision to take. Toxicological & Environmental Chemistry,
91: 5, 1015-1019
H. Nash (Ed.) (1979). The Energy Controversy: Soft Path Questions and Answers, Friends of the
Earth, San Francisco, CA.
Hasna, A. M. (2007). "Dimensions of sustainability". Journal of Engineering for Sustainable
Development: Energy, Environment, and Health 2 (1): 47–57.
Hilgenkamp, K. (2005). Environmental Health: Ecological Perspectives. London: Jones &
Bartlett.
Jacobson, Mark Z. (2009). Review of solutions to global warming, air pollution, and
energy security. Energy and environmental science (Royal Society of Chemistry) 2:
148
Krech, Shepard (2004). "Encyclopedia of World Environmental History: A-E".
Routledge.
Ott, K. (2003). "The Case for Strong Sustainability." In: Ott, K. & P. Thapa (eds.)
(2003).Greifswald’s Environmental Ethics. Greifswald: Steinbecker Verlag Ulrich
Rose.
Sustainable Growth and Applications in Renewable Energy Sources
60
Pearce, D., A. Markandya and E. Barbier (1989). Blueprint for a green economy, Earthscan,
London, Great Britain
Wallace, Bill (2005). Becoming part of the solution : the engineer’s guide to sustainable development.
Washington, DC: American Council of Engineering Companies. Initiative 62(3):
282–292.
4
Renewable Energy and Coal Use in Turkey
Ali Osman Yılmaz
Karadeniz Technical University/Department of Mining Engineering, Trabzon
Turkey
1. Introduction
The development level of a country is directly related to its economical and social level. One
of the most important factors that takes an active role in achieving such development level is
energy. Energy, which is the requirement of sustainable development, can only be an
impulsive force in industrialization and overall development of societies if it is supplied on
time, with sufficient quantity and under reliable economical conditions and considering the
environmental impacts. The demand for energy increases rapidly in parallel with the
population increase, industrialization and technological developments in Turkey and the
other developing countries in the world.
Turkey has been developing since the foundation of the Republic of Turkey in 1923.
Turkish Government played a leading role in energy production and in energy use, as
well as in other fields, and implemented several policies to increase electricity production.
By 1950s, thermal power plants were used commonly in electricity production. In the
following years, hydroelectric power plants were put into operation in order to use the
considerable amount of water resources of the country. Coal-fired power plants using
national resources accounted for 70–80% of the thermal electricity production. After 1960s,
oil, an imported resource, was replaced with national resources due to two petroleum
crises. Therefore, the proportion of use of lignite in the energy field increased. By 1980s,
energy production lead by the government went on. Afterwards, applications of liberal
economy policies resulted in implementation of different energy production methods, and
the country had a increasing tendency to meet energy demand by imports as a result of
improvement in international economic relations. Natural gas became prevalent in the
country as well as all over the world and accounted for 50% of the electricity production
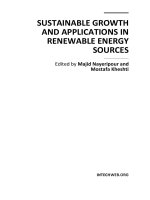
in 2009 (Fig 1, Table 1).
On the eve of 21st century, Turkey was unable to meet its energy requirement with its
limited sources as a result of the increasing population and industrialization and thus the
deficit between the energy production and energy consumption increased rapidly. Under
such conditions, utilizing own resources more effectively had become more important
increasingly day by day. Turkey became more dependent on imports year to year. It still
supplies about 71% of its primary energy consumption from imported energy sources. This
percentage is 59% for electricity production. It is now vital for Turkey to attach importance
to coal and renewable energy sources, which are the largest domestic energy sources of
Turkey, in order to meet this increasing energy deficit. Especially, it is possible to produce
electricity using the said domestic sources.
Sustainable Growth and Applications in Renewable Energy Sources
62
Population
73.722.988 (2010)
Gross national product (GNP)
615 billion $
GNP per capita
8.215 $/person
Primary energy production
30.328 ktoe (thousand tons of oil equivalent)
Distribution of primar
y
ener
gy
production
Lignite 52%,wood 12%, hydraulic 10%,
Petroleum 8%,hard coal 4%, other 14 %
Primary energy consumption
104.117 Ktoe
Distribution of primary energy
consumption
Petroleum 29 %, natural gas 31 %, lignite 15 %,
hard coal 14 %, hydraulic 3 %, other 8 %.
Distribution of primary energy
consumption by sectors
Industry 23 %,residential 27 %,
transportation 15%,
energy 25%, other 10%
Rate of primary energy
[production/consumption]
29 %
Primary energy consumption per capita
1435 Koe (Kilogram oil equivalent)
World primary energy consumption per
capita
1710 Koe
Installed capacity
44.761 MW
Distribution of installed capacity by
primary energy sources
Renewable 35 %, natural gas 26 %, lignite 18 %,
petroleum 4 %, imported coal 5 %,
hard coal 1%, other 11 %
Electricity generation
194.813 GWh
Distribution of electricity generation by
primary energy sources
Natural gas 49 %, renewable 19%,
lignite 20 %, petroleum 3%, imported
coal 6 %, hard coal 2 %, other 1 %.
Electricity gross consumption
194.079 GWh
Electricity gross generation per capita
2.685 kWh/person
Electricity net consumption per capita
2.162 kWh/person
Word electricity generation
20.202 billion kWh (2008)
Word electricity consumption
16.880 billion kWh (2008)
World electricity generation by primary
energy sources
Coal 42%,natural gas 21%, nuclear14 %,
hydraulic 16%,
petroleum 6%, biomass 3%, other 4 %. (2007)
World electricity production per capita
3012 kWh/person (2008)
World electricity consumption per capita
2516 kWh/person (2008)
Table 1. Energy Profile of Turkey (2009)
Renewable Energy and Coal Use in Turkey
63
15
14
15
16
16
16
16
17
18
17
17
18
19
19
20
22
24
25
25
26
25
26
27
26
27
27
27
28
29
28
26
25
24
24
24
25
27
27
29
30
19
20
22
24
25
27
30
32
33
31
32
32
34
36
37
39
42
47
48
51
53
54
56
59
58
63
68
72
73
73
79
74
77
82
86
89
98
106
104
104
77
72
68
64
64
60
55
52
55
56
54
57
56
54
54
56
55
54
51
51
48
47
48
44
46
42
40
39
40
38
33
33
32
29
28
28
27
26
28
29
0
10
20
30
40
50
60
70
80
90
0
20
40
60
80
100
120
1970
1971
1972
1973
1974
1975
1976
1977
1978
1979
1980
1981
1982
1983
1984
1985
1986
1987
1988
1989
1990
1991
1992
1993
1994
1995
1996
1997
1998
1999
2000
2001
2002
2003
2004
2005
2006
2007
2008
2009
Primary energy production-consumption [Mtoe]
[Production/Consumption]x 100 [%]
Consumption
Production
[production/Consumption]x100
Primary energy production compared with primary energy consumption
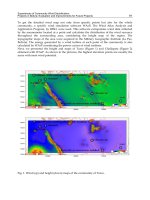
Fig. 1. During period of 1970-2009, primary energy production-consumption and rates of
production and consumption (data from MENR,1970-2009)
In this chapter, the primary energy production– consumption of renewable energy sources
of Turkey and coal as well as the development of their use rates in electricity production are
discussed for a definite time period. In addition, some information is given about the
projected use rates of such energy sources in energy production and projected consumption
in Turkey for the years 2015 and 2020.
2. Energy outlook of Turkey
When the Republic of Turkey was founded in 1923, Turkey’s population was 12 million.
Installed capacity of electricity production, total electricity production, per capita electricity
production and per capita electricity consumption were 33MW, 45 GWh, 3.6kWh and 3.3
kWh, respectively. Initially, almost all electricity demand was met by thermal power plants.
The foundation of the Turkish Republic became the start of the development of the country.
In 2009 year, the population has reached 73,7 million increasing about by six fold. In 2009
year, installed capacity reached 44.761MW increasing about by 1356-fold, electric
production reached to 194.813 GWh increasing by 4329-fold. Per capita electricity
production and electricity consumption reached 2685 and 2162 kWh increasing by 745-fold
and by 655-fold, respectively. In 2009 year, primary energy production and consumption
were 30.328 Ktoe and 104.117 Ktoe respectively. Also, distributions of primary energy
production were lignite 52%, wood 12%, hydraulic 10%, hard coal 4%, and petroleum 8%.
Distribution of primary energy consumptions were petroleum, natural gas, lignite, hard
coal, hydraulic and other 29%, 32 %, 15%, 14 %, 3 % and 8%, respectively (Table 1). The
net effect of all these factors is that Turkey’s energy demand has grown rapidly almost every
year and is expected to continue growing (Arıoğlu and Yılmaz, 1997a; SIS, 2003,2004;
Yılmaz, 2003, 2004,2011; TEIAS, 2004, 2009; Yılmaz and Uslu 2007; BP, 2009).
Energy has been the most important investment sector over the world. Turkey’s energy needs
are increasing quickly. Primary energy production-consumption and rates of production and
Sustainable Growth and Applications in Renewable Energy Sources
64
consumption are illustrated in Fig.1. Since Turkey is an energy importing country more than
about 70% of the country’s energy consumption is met by imports, and the share of imports is
growing in the following years. While the primary energy consumption in 1970 was 18.84
mtoe, it reached 104 mtoe (million ton oil equivalent) with an increase rate of 552% in 2009.
Primary energy production and consumption rates realized 1.39% and 4.29% per year,
respectively. In other words, increase in consumption is three times bigger than the increase in
production. While the ratio that production meets consumption was 77 % in 1970, this ratio
reduced and reacted to 29 % in 2009. In other words, Turkey has been a country that depends
on other countries in energy fields, especially in terms of oil and natural gas. (Fig. 1). (Yılmaz,
et al, 2005; Yılmaz, 2003; Yılmaz and Arıoğlu 2003; Yılmaz and Uslu, 2007; Yılmaz 2006; Yılmaz
2009; Yılmaz 2011; Arıoğlu 1994; Arıoğlu 1996).
Distribution of total electricity generation by energy resources during the period 1940–2009 is
shown in Fig 2. As seen in the figure, renewable, oil-natural gas and coal accounted for 8%,
6%, 86 of electricity production in 1940. The share of the coal reduced continuously in the
following years and reached as 55% in 1960, 25% in 1980 and again increased to 29%(imported
coal included) in 2009. The increase rate of use of renewable energy sources was accelerated
especially from 1960s, as seen in the electricity production capacity, and use rate of renewable
energy sources was recorded as 8 % in 1940, 37% in 1960, 52% in 1980 and decreased to 19% in
2009. Because, after the year 2000, a sharply increase in share of imported natural gas in
electricity production, lowered the use of domestic lignite and hard coal. Turkey is dependent
on foreign countries especially in terms of oil and natural gas. In 1960, imported oil made up
8% of electricity production and this rate abruptly increased in the after years and it’s had been
reached 30% in 1970. During period 2000s years, imported of the natural gas sharply increased
and reacted to 50% in 2009. Natural gas has been fast-growing fuel of energy market in
Turkey. The tremendous growth and increased trend in gas demand during the period 1990-
2009 showed that Turkey will need much more gas in the following years. Especially the share
of the natural gas consumed in electricity generation has sharply increased and is considered
to increase also in the future (Yılmaz 2008; Yılmaz 2011).
Turkey became more dependent on imports year to year. It still supplies about 71% of its
primary energy consumption from imported energy sources. This percentage is 59% for
electricity production. These rates are exactly seen in Fig 3. and Fig. 4 during of the period
1970-2009. In Fig 3 show that Turkey’s primary energy consumption was 77% share of the
domestic energy sources in 1970. While 54% of the consumed energy in 1980 was by the
domestic energy sources, this percentage decreased to 33% and 29% in 2000 and 2009
respectively. On the other hand, share of the imported energy sources was increased from
23% in 1970 to 71% in 2009. In Figure 4 distribution of electricity production by domestic
and imported energy sources are given in historical order. As seen in Figure, while domestic
energy sources had a share of 68% in electricity production in 1970, imported energy sources
had a share of 42% in electricity generation. After the 1970s years, oil crisis started. Turkey
gave importance on lignite, coal and own renewable energy potential sources. So the rate of
electricity production using Turkey’s domestic sources was increased. But in 1990s use of
imported natural gas in electricity production has sharply increased to 45% and 59% in 2000
and 2009 respectively. It is now vital for Turkey to attach importance to coal and renewable
energy sources, which are the largest domestic energy sources of Turkey, in order to meet
this increasing energy deficit. Especially, it is possible to produce electricity using the said
domestic sources (Yılmaz 2006; Yılmaz 2011, Yılmaz and Arıoğlu 1997b).
Renewable Energy and Coal Use in Turkey
65
(8,6,86)
(11,10,79)
(37,8,55)
(37,30,33)
(52,24,25)
(40,25,35)
(25,44,30)
(37,46,17)
(19,52,29)
0 20406080100
RENEWABLE [%]
100
80
60
40
20
0
O
I
L-
N
A
T
U
R
A
L
G
A
S
[
%
]
100
80
60
40
20
0
C
O
A
L
[
%
]
(Renewable,Oil,Coal)
Proportions
1940
1956
1960
1970
1980
1990
2000
2004
2009
C
O
A
L
R
E
N
E
W
A
B
L
E
OIL- NATURAL GAS
Year
Fig. 2. Distribution of primary energy sources in electricity production by years (data from
TEIAS, 2009)
23
28
32
36
36
40
45
48
45
44
46
43
44
46
46
44
45
46
49
49
52
53
52
56
54
58
60
61
60
62
67
67
68
71
72
72
73
74
72
71
77
72
68
64
64
60
55
52
55
56
54
57
56
54
54
56
55
54
51
51
48
47
48
44
46
42
40
39
40
38
33
33
32
29
28
28
27
26
28
29
0
10
20
30
40
50
60
70
80
90
100
1970
1971
1972
1973
1974
1975
1976
1977
1978
1979
1980
1981
1982
1983
1984
1985
1986
1987
1988
1989
1990
1991
1992
1993
1994
1995
1996
1997
1998
1999
2000
2001
2002
2003
2004
2005
2006
2007
2008
2009
% of total Consumption
INDIGENOUS ENERGY SOURCES
IMPORTED ENERGY SOURCES
Fig. 3. During the period 1970 and 2009, primary energy consumption with domestic and
imported energy sources (data from MENR, 1970-2009)
Sustainable Growth and Applications in Renewable Energy Sources
66
32
43
46
53
46
36
31
35
31
26
26
24
22
27
23
21
21
18
14
26
25
26
24
22
25
26
25
29
30
38
50 50
56
53
55
55
59
68
57
54
47
54
64
69
65
69
74
74
76
78
73
77
79
79
82
86
74
75
74
76
78
75
74
75
71
70
62
55
50
50
44
47
45
45
41
40
41
0
10
20
30
40
50
60
70
80
90
100
1970
1971
1972
1973
1974
1975
1976
1977
1978
1979
1980
1981
1982
1983
1984
1985
1986
1987
1988
1989
1990
1991
1992
1993
1994
1995
1996
1997
1998
1999
2000
2001
2002
2003
2004
2005
2006
2007
2008
2009
% of total production
INDIGENOUS ENERGY SOURCES
IMPORTED ENERGY SOURCES
Fig. 4. During the period 1970 and 2009, in electricity generation imported and indigenous
energy sources (data from TEIAS, 1970-2009)
3. Renewable energy use in Turkey
Totally energy demand of Turkey was making up about 29% of domestic resources and
about 71% import resources. Turkey’s primary energy production is 30.3 Mtoe
(Table 1, Fig 1.). Turkey got a great share coal which is consisted of 57%. The primary
energy that follows the coal and their shares are as follows; oil 8%, natural gas 2% and
renewable energy 33%. Distribution of the share on the renewable energy are hydraulic,
geothermal, wood, animal and vegetable waste and other 10%, 6%,12%,1% and 1%,
respectively in primary energy production (Fig 5.). On the other hand, primary energy
consumption of Turkey is 104.1 Mtoe in 2009. The biggest energy consumption resource
is natural gas with 32% and followed of this gas; oil 29%, coal 30%, and renewable energy
9% in consumption (Fig5). Distribution of the share on the renewable energy are
hydraulic, geothermal, wood, animal and vegetable waste and other 3%, 1%, 3%, 1% and
1%, respectively in primary energy consumption (MENR, 2010; TKI, 2004,2009). Turkey is
dependent on the import of foreign primary energy sources especially; oil, natural gas
and hard coal. Recently, according to research estimates, this trend is likely to continue in
the near future.
Turkey has two main energy resources with large capacities. These are coal and
renewable energy resources. Both energy resources constitute 90% of the primary energy
production. The total primary energy production was 31% in 1970 and increased to 50%
and 57% in 1989 and in 2009 respectively and this rate was met by coal. The share of the
renewable energy resources was 43% in 1970 and decreased to 33% in 2009 (Fig. 6)
(Yılmaz 2006; Yılmaz 2011).
Renewable Energy and Coal Use in Turkey
67
PRIMARY ENERGY PRODUCTION-2009 PRIMARY ENERGY CONSUMPTION-2009
Coal
57%
Oil
8%
Natural Gas
2%
Hydraulic
10%
Geothermal
6%
Wood
12%
Animal and wegetable
wast 4%
Other 1%
Renewable
33%
Coal
30%
Oil
29%
Natural Gas
32%
Hydraulic
3%
Geothermal
1%
Wood
3%
Animal and wege table
wast 1%
Other 1%
Renewable
9%
Fig. 5. Total primary energy production and consumption by energy sources in 2009 (data
from MENR, 2009)
31
33
34
34
35
36
37
36
38
34
36
38
39
41
43
48
48
49
45
50
46
43
45
44
46
45
45
47
48
48
48
50
47
45
43
46
49
54
57
57
43
42
43
43
43
45
47
47
46
49
50
48
48
47
46
41
39
39
44
38
38
38
37
40
39
40
41
40
39
38
39
38
41
42
44
41
39
35
32
33
74
75
77
76
79
80
83
83
84
83
86
86
87
88
89
90
88
88
89
88
84
81
83
84
85
86
86
86
87
86
87
88
88
87
88
87
88
89
89
90
0
10
20
30
40
50
60
70
80
90
100
1970
1971
1972
1973
1974
1975
1976
1977
1978
1979
1980
1981
1982
1983
1984
1985
1986
1987
1988
1989
1990
1991
1992
1993
1994
1995
1996
1997
1998
1999
2000
2001
2002
2003
2004
2005
2006
2007
2008
2009
OTHER: Natural gas, petroleum
(Coal+Renewable) in total production
RENEWABLE
COAL
% of total production
Fig. 6. During of the period 1970-2009, total primary energy production with rates of
renewable energy and coal (data from MENR 1970-2009)
The distribution of renewable energy sources in primary energy production in Turkey is
illustrated in Fig. 7 for the term 1970 and 2009. The energy sources used for the primary
energy production are hydraulic energy, geothermal energy, wood, animal and vegetable
waste. On average 43% of the primary energy production was met by the renewable energy
in 1970. This percentage increased to 50% in 1980 and due to the imported natural gas, this
rate was decreased to 33% in 2009. The shares of the energy sources in this production rate
Sustainable Growth and Applications in Renewable Energy Sources
68
were as follows: 10% hydraulic, 6% geothermal, 12% wood and 4% animal and vegetable
waste in 2009. According to this data, the largest energy source used in primary energy
production was wood and hydraulic. While the share of the wood and waste and drung has
decreased, the share of the hydraulic, geothermal has increased (Yılmaz 2008; MENR,1970-
2009; SIS, 2003–2004; TEIAS, 2004,2009).
2
2
2
1
2
3
4
4
5
5
6
6
6
5
6
5
4
7
10
6
8
8
9
11
10
12
13
12
13
11
10
9
12
13
17
14
15
12
10
10
0
1
1
2
2
2
2
2
2
2
2
3
3
3
3
4
3
3
4
6
26
25
27
27
27
27
27
27
26
27
27
26
26
27
25
24
22
21
22
21
21
21
20
21
21
21
20
20
19
19
20
20
19
19
18
17
15
14
13
12
15
15
14
14
14
15
15
15
15
16
17
16
15
15
14
12
11
10
10
10
7
7
7
6
6
6
6
5
5
5
5
5
5
5
5
5
4
4
4
4
43
42
43
43
43
45
47
47
46
49
50
48
48
47
46
41
39
39
44
38
38
38
37
40
39
40
41
40
39
38
39
38
41
42
44
41
39
35
32
33
0
5
10
15
20
25
30
35
40
45
50
1970
1971
1972
1973
1974
1975
1976
1977
1978
1979
1980
1981
1982
1983
1984
1985
1986
1987
1988
1989
1990
1991
1992
1993
1994
1995
1996
1997
1998
1999
2000
2001
2002
2003
2004
2005
2006
2007
2008
2009
WOOD
Renewable in total production
Geothermal
Hydraulic
Animal and vegetable Waste
% of total production
Fig. 7. During of the period 1970-2009, renewable energy sources and rates used in primary
energy production (data from MENR 1970-2009)
The development of the total share of renewable energy sources in primary energy
consumption in Turkey is illustrated in Fig. 8 for the term 1970 and 2009. Turkey’s main
energy production resources are hard coal, lignite and renewable energy. The total domestic
energy production was 77% (hard coal 15%, lignite 8%, renewable 33% and other oil-gas
21%) in 1970. The share of total domestic energy sources in overall primary energy
production was 48% (hard coal 4%, lignite 18%, renewable 18 and other 8%) in 1990, and it
decreased to 29% (hard coal 1%, lignite 15%, renewable 10% and other 4%) in 2009. In other
words, the share of the renewable energy resources was 33% in 1970 and decreased to 10%
in 2009. As seen in Figure 8, Turkey’s total domestic energy sources in overall production
has decreased from 1970 and 2009 term. When use of renewable domestic energy sources is
considered in terms of primary energy production, it decreased to 10% levels in the recent
years.
The primary energy consumption of Turkey has increased day by day and it will follow in
the future. The development of the total share of renewable energy sources in primary
energy consumption in Turkey is illustrated in Fig. 9 for the term 1970 and 2009. The energy
sources used for the primary energy production are hydraulic energy, geothermal energy,
wood, animal and vegetable waste. The share of total renewable energy sources in overall
consumption was 33% in 1970 (hydraulic 1% wood 20%, waste and drug 11%) and it
decreased to 23% (hydraulic 4% wood 11%, waste and drug 5%) in 1990. In 2009, the share
of renewable energy sources in total primary energy consumption decreased and reached to
9% (Yılmaz 2008; MENR, 2006-2009; SIS, 2003–2004; TEIAS, 2004-2009).
Renewable Energy and Coal Use in Turkey
69
15
14
13
12
12
11
10
8
8 8
7
8
7
6
6
6
5
5
5
4
4
3
3
3
3
2
2
2
2
1
1
2
1 1
1
1 1
1
1
1
9
9
10
10
11
11
11
11
13
11
12
14
15
16
18
21
22
22
19
21
18
17
19
17
18
17
16
16
17
17
14
15
13
12
11
11
12
13
15
15
33
30
29
27
28
27
26
24
25
27
27
28
27
26
25
23
22
21
22
19
18
18
18
18
18
17
16
16
16
15
13
13
13
12
12
11
11
9
9
10
77
72
68
64
64
60
55
52
55
56
54
57
56
54
54
56
55
54
51
51
48
47
48
44
46
42
40
39
40
38
33
33
32
29
28
28
27
26
28
29
0
10
20
30
40
50
60
70
80
90
100
1970
1971
1972
1973
1974
1975
1976
1977
1978
1979
1980
1981
1982
1983
1984
1985
1986
1987
1988
1989
1990
1991
1992
1993
1994
1995
1996
1997
1998
1999
2000
2001
2002
2003
2004
2005
2006
2007
2008
2009
% of total consumption
Hard coal
RENEWABLE
Imported energy sources:
Oil, Natural gas, Hard coal
Total Indigenous
energy sources
Fig. 8. During of the period 1970 and 2009 development of the total share of renewable
energy sources in primary energy production (data from MENR 1970-2009)
1
1
1
1
1
2
2
2
2
3
3
3
4
3
3
3
2
4
5
3
4
4
4
5
5
5
5
5
5
4
3
3
4
4
5
4
4
3
3
3
20
18
18
17
17
16
15
14
14
15
15
15 15
14
14
13
12
11
11
11
10
10
10
9
9
9
8
8
8
7
6
7
6
5
5
5
4
4
4
3
11
11
10
9
9
9
9
8
8
9
9
9
8
8
7
6
6
5
5
5
4
3
3
3
3
2
2
2
2
2
2
2
2
2
1
1
1
1
1
1
33
30
29
27
28
27
26
24
25
28
28
28
27
26
25
23
22
21
23
19
18
18
18
18
18
17
16
16
16
15
13
13
13
12
12
11
11
9
9
9
0
5
10
15
20
25
30
1970
1971
1972
1973
1974
1975
1976
1977
1978
1979
1980
1981
1982
1983
1984
1985
1986
1987
1988
1989
1990
1991
1992
1993
1994
1995
1996
1997
1998
1999
2000
2001
2002
2003
2004
2005
2006
2007
2008
2009
WOOD
Renewable in total consumption
Hydraulic
Geothermal
% of total consumption
Animal and vegetable Waste
Fig. 9. During of the period 1970 and 2009 development of the total share of renewable
energy sources in primary energy consumption (data from MENR 1970-2009)
3.1 Energy production using renewable energy sources
Distribution of installed capacity of Turkey by energy sources during the period 1940 and
2009 is illustrated in Fig. 10. The overall installed capacity was 217 MW in 1940 and the rate
of renewable energy source was 3%. The overall installed capacity increased 164 times in
2003 and reached 35587 MW. The renewable source, which was 7.8 MW at the beginning of
the term, increased 1614 times and reached 12594 MW (35%). The increase rate of use of
renewable energy sources was accelerated especially in the middle of 1950s. This rate
increased to 33%, 38%, and 35% in 1973, 1986 and in 2009 respectively. Especially, the
electricity production using natural gas caused that this rate decreased. While hard coal
Sustainable Growth and Applications in Renewable Energy Sources
70
accounted for 50% of total installed capacity and 80% of electricity production in 1950, its
share reduced continuously in the following years and realized 1.1% in installed capacity
and 1.9% in electricity production. Lignite proved its importance during the petroleum crisis
in 1973–1979. After 1973, its importance increased. The share of lignite in electricity
production increased to 45% from 20% and its share in installed capacity reached 35% in the
1980s. After the year 2000, an increase in share of natural gas, both installed capacity and in
electricity production, lowered the use of lignite. In 2009, the share of installed capacity by
resources was 1%, 19%, 35%, 4%, 26% and 11% for hard coal, lignite, renewable, crude oil,
natural gas and other, respectively (Yılmaz et al., 2005; Yılmaz, 2004,2011; Yılmaz 2008;
Yılmaz and Aydıner, 2009; Yılmaz and Uslu, 2006).
The most important and the largest energy capacities of Turkey’s are coal and renewable
energy resources. Both energy resources constitute 61% (hard coal 16%, lignite 13% and
renewable 32%) of the total installed capacity in 1970. The total installed capacity increased
and reached to 78% (hard coal 2%, lignite 29% and renewable 47%) until 1995. In this rate
just only hard coal percentage decreased, lignite and renewable increased as domestic
energy sources. But, after this time the total installed capacity decreased and reached to 54%
(hard coal 1%, lignite 18% and renewable 34%) in 2009 as illustrated in Fig 11.
In Figure 12, distribution of electricity production of Turkey by energy resources is given in
a long historical order for 1940 and 2009 term. As seen in the Figure, coal (especially hard
coal) had a share of 80% in electricity production in 1940. In the same year, the share of
electricity production by resources was 6%, 3%, 6%, 5%, for lignite, renewable, crude oil and
other, respectively. The rate of electricity production using renewable energy resources and
lignite had begun increasing in time reached to 21% and 14% respectively in 1973. The share
of hard coal sharply decreased and reached to 12% in 1973. By the middle of 1960s, use of oil
Hard coal
Lignite
İmported
coal
Renewable
Petroleum
Natural gas
Other
68
67
65
66
65
64
64
63
65
70
67
66
66
65
63
62
56
58
54
48
44
42
41
41
39
41
38
32
32 32
29
25
24
30
25
23
22
26
28
27 27
28
29
30
30
34
37
37
32
32
32
31
31
29
30
30
30
29
28
26
26
25
22
23
23
23
25
25
24
72
70
69
69
68
67
67
66
69
73
71
72
72
71
70
68
74
75
75
75
76
76
75
75
75
75
75
68
69 69
61
59
57
60
64
65
65
66
67
68 68
70
75
76
76 76
76
77
75
74
73
73
76
77
77
78
77
75
72
66
67
66
60
59
57
57
58
58
58
0
10
20
30
40
50
60
70
80
90
100
1940
1942
1944
1946
1948
1950
1952
1954
1956
1958
1960
1962
1964
1966
1968
1970
1972
1974
1976
1978
1980
1982
1984
1986
1988
1990
1992
1994
1996
1998
2000
2002
2004
2006
2008
% of total
43 %
25 %
28 %
3%
55 %
15
%
27 %
3 %
48 %
14 %
6 %
29 %
13 %
11 %
33 %
42 %
2 %
35 %
38 %
17 %
0.8 %
18 %
4 %
35
35%
3 %
11 %
Coal
Total
3 %
26 %
2 %
(Coal+Renewable)
Total
4 %
Fig. 10. During period of the 1940- 2009 distribution of installed capacity by energy sources
(data from TEIAS 2009)