Sustainable Growth and Applications in Renewable Energy Sources Part 1 ppt
Bạn đang xem bản rút gọn của tài liệu. Xem và tải ngay bản đầy đủ của tài liệu tại đây (1001.96 KB, 20 trang )
SUSTAINABLE GROWTH
AND APPLICATIONS IN
RENEWABLE ENERGY
SOURCES
Edited by Majid Nayeripour and
Mostafa Kheshti
Sustainable Growth and Applications in Renewable Energy Sources
Edited by Majid Nayeripour and Mostafa Kheshti
Published by InTech
Janeza Trdine 9, 51000 Rijeka, Croatia
Copyright © 2011 InTech
All chapters are Open Access distributed under the Creative Commons Attribution 3.0
license, which allows users to download, copy and build upon published articles even for
commercial purposes, as long as the author and publisher are properly credited, which
ensures maximum dissemination and a wider impact of our publications. After this work
has been published by InTech, authors have the right to republish it, in whole or part, in
any publication of which they are the author, and to make other personal use of the
work. Any republication, referencing or personal use of the work must explicitly identify
the original source.
As for readers, this license allows users to download, copy and build upon published
chapters even for commercial purposes, as long as the author and publisher are properly
credited, which ensures maximum dissemination and a wider impact of our publications.
Notice
Statements and opinions expressed in the chapters are these of the individual contributors
and not necessarily those of the editors or publisher. No responsibility is accepted for the
accuracy of information contained in the published chapters. The publisher assumes no
responsibility for any damage or injury to persons or property arising out of the use of any
materials, instructions, methods or ideas contained in the book.
Publishing Process Manager Ivana Zec
Technical Editor Teodora Smiljanic
Cover Designer InTech Design Team
Image Copyright Petr84, 2011. Used under license from Shutterstock.com
First published November, 2011
Printed in Croatia
A free online edition of this book is available at www.intechopen.com
Additional hard copies can be obtained from
Sustainable Growth and Applications in Renewable Energy Sources,
Edited by Majid Nayeripour and Mostafa Kheshti
p. cm.
978-953-307-408-5
free online editions of InTech
Books and Journals can be found at
www.intechopen.com
Contents
Preface IX
Part 1 Sustainable Growth 1
Chapter 1 EU Energy Policies and Sustainable Growth 3
Carlo Andrea Bollino and Silvia Micheli
Chapter 2 Sustained Renewability:
Approached by Systems Theory and Human Ecology 21
Tobias A. Knoch
Chapter 3 Renewable Energy Use and Energy Efficiency –
A Critical Tool for Sustainable Development 49
Pius Fatona
Chapter 4 Renewable Energy and Coal Use in Turkey 61
Ali Osman Yılmaz
Chapter 5 Experiences of Community Wind
Electrification Projects in Bolivia:
Evaluation and Improvements for Future Projects 85
Laia Ferrer-Martí, Bruno Domenech,
Walter Canedo, Carlos Reza, Mirtha Tellez,
Milton Dominguez, Lorenzo Perone and Jaime Salinas
Chapter 6 Taxes Incentives to Promote
Res Deployment: The Eu-27 Case 107
José M. Cansino, María del P. Pablo-Romero,
Rocío Román and Rocío Yñiguez
Part 2 Applications 123
Chapter 7 Structural Design of a Dynamic Model of
the Battery for State of Charge Estimation 125
Frédéric Coupan, Ahmed Abbas, Idris Sadli,
Isabelle Marie Joseph and Henri Clergeot
VI Contents
Chapter 8 Parameterisation of
the Four Half-Day Daylight Situations 147
Stanislav Darula and Richard Kittler
Chapter 9 Energetic Willow (Salix viminalis) –
Unconventional Applications 181
Andrzej Olejniczak, Aleksandra Cyganiuk,
Anna Kucińska and Jerzy P. Łukaszewicz
Chapter 10 Biomass Energy Conversion 209
Sergio Canzana Capareda
Chapter 11 Air Gasification of Malaysia Agricultural Waste in a Fluidized
Bed Gasifier: Hydrogen Production Performance 227
Wan Azlina Wan Ab Karim Ghani,
Reza A. Moghadam and Mohamad Amran Mohd Salleh
Chapter 12 Extraction and Optimization of Oil from
Moringa Oleifera Seed as an Alternative
Feedstock for the Production of Biodiesel 243
A.S. Abdulkareem, H. Uthman, A.S. Afolabi and O.L. Awenebe
Chapter 13 Tall Wheatgrass Cultivar Szarvasi-1 (Elymus elongatus
subsp. ponticus cv. Szarvasi-1) as a Potential Energy
Crop for Semi-Arid Lands of Eastern Europe 269
Sándor Csete, Szilvia Stranczinger, Bálint Szalontai, Ágnes Farkas,
Róbert W. Pál, Éva Salamon-Albert, Marianna Kocsis, Péter Tóvári,
Tibor Vojtela, József Dezső, Ilona Walcz, Zsolt Janowszky,
János Janowszky and Attila Borhidi
Chapter 14 Analysis of Time Dependent Valuation of
Emission Factors from the Electricity Sector 295
C. Gordon and Alan Fung
Chapter 15 Photovoltaic Conversion: Outlook at the Crossroads Between
Technological Challenges and Eco-Strategic Issues 313
Bouchra Bakhiyi and Joseph Zayed
Preface
Worldwide attention to environmental issues combined with the energy crisis force us
to reduce greenhouse emissions and increase the usage of renewable energy sources as
a solution to providing an efficient environment. This book addresses the current
issues of sustainable growth and applications in renewable energy sources. The fifteen
chapters of the book have been divided into two sections to organize the information
accessible to readers.
The book provides a variety of material, for instance on policies aiming at the
promotion of sustainable development and implementation aspects of RES. Authors
contributing to the book have tried to prepare the information in an accessible way.
We would like to extend our appreciation to all the authors for their cooperation and
the attention that they have given to this book.
During this project, it was a pleasure for us to work with InTech – Open Access
Publisher. We express our appreciation to all our colleagues in this publication,
especially Ms. Ivana Zec, the Publishing Process Manager in charge of this book
project.
Majid Nayeripour
Faculty of Electrical and Electronic Engineering, Shiraz University of Technology,
Iran
Mostafa Kheshti
Xi'an Jiaotong University,
China
Part 1
Sustainable Growth
1
EU Energy Policies and Sustainable Growth
Carlo Andrea Bollino and Silvia Micheli
Department of Economics, Finance and Statistics, University of Perugia
Italy
1. Introduction
The concentration of greenhouse gases (GHG) in the atmosphere was at 438 parts per
million (ppm) of CO
2
equivalent in 2008, that is almost twice the pre-Industrial Revolution
level (IEA, 2010). Such an increase is mainly caused by fossil fuel combustion for energy
purposes in the power, industry, building and transport sectors (Stern, 2007). In the
Reference Scenario, which gives economic and environmental assessments of a world in
which the economy continues on its current course without polluting emission reductions
policies, fossil fuel use is projected to grow, and the dirtiest fuel, i.e. coal, is expanding its
share to face rising energy demand driven by emerging countries such as China and
India.
The global response to climate change started with the so called Rio Earth Summit in 1992:
governments realized the need to work together for an environmental and sustainable
economic development. The Summit was a first move towards an environmental policy at
global level, by setting the emission reduction targets for developed countries and
establishing a framework of wider reduction for the future from a sustainable development
point of view. Its weak point was that the Summit promised a lot at little cost, since it was
an agreement without stringent measures (Helm, 2008). The Summit has been followed by
several discussions with the purpose of finding optimal shared environmental policy for
facing climate change.
Afterwards, the Kyoto Protocol, an international agreement adopted in Kyoto on
December 1997, has committed (instead of encouraging) 37 industrialized countries and
the European Union (EU) to reduce GHG emissions through national measures. The EU
has undoubtedly made a big effort in developing a progressive environmental policy, but
many of its own policies are still far from making a difference to climate change.
Following the ratification of the Kyoto Protocol in 2002, the EU committed itself to reduce
emissions to 8% below 1990 levels by 2008-2012, allowing different national emissions
target within the EU accounting for different income level, country size and
environmental attitude (Borghesi, 2010).
The current policy action toward green Europe is the so-called 20-20-20 Climate and Energy
Package. The EU aims to limit its 2020 greenhouse gas emissions to 20% below 1990 levels
and to meet a 20% renewables target of total energy supply by 2020. The Package includes a
20% energy efficiency target and a biofuel target of 10% by 2020 (Hepburn et al., 2006). To
meet these targets, governments in EU countries use a large variety of support instruments.
Sustainable Growth and Applications in Renewable Energy Sources
4
The first part of the chapter is then devoted to a critical review of the main international
agreements to reduce climate change and their implementation in the EU environmental
policy. The search for a consensus among EU governments is tricky since energy policies
advocated by EU members differ. Some of them urge on the implementation of nuclear
power, while others advocate the use of renewables instead of nuclear technologies;
anyway, all of them are convinced that the economy cannot rely on fossil fuels anymore
(Nordhaus, 2006).
The second part of the chapter evaluates the range of strategies implemented in different
EU countries to tackle climate change. The primary objective of these strategies is to
increase the use of renewable energy in order to enjoy the environmental benefits and for
energy security reasons (Held et al., 2006). The analysis reviews the EU climate-change
package and the main policy instruments contained in it. We categorize policy
instruments through the most frequently used typology, i.e. price-oriented or quantity-
oriented (Dinica, 2006). Some of them are claimed to be more market friendly than
others, while other schemes are claimed to be more efficient in promoting the
development of renewable energy (Meyer, 2003). Currently, there is no general
agreement on the effectiveness of each scheme. By analyzing the different schemes that
have been used in EU Member States in order to achieve the 20-20-20 targets, the
research takes into account the extent of financial support given by each EU member
region by considering some exogenous factors, as the availability and distribution of
renewable resources, and the institutional context. The strategies planned by
governments imply different costs that might be prohibitive if other countries are not
making comparable efforts.
Finally, the research highlights the problem of coordination among policy makers that
undermines the achievement of the 20-20-20 Climate and Energy Package targets, using a
theoretic model of Nordhaus (2009). It is well-known that EU countries should take
complementary and coordinated actions to green themselves by implementing their own
national plan (Böhringer et al., 2009). Every country would want to spur new activities, new
investment, more employment in its own territory, by using an appropriate mix of local
taxation and subsidies, in conjunction with other command and control instruments.
However, EU countries have the incentive to free-ride, or to impose as few costs as possible
on their home economy while enjoying the benefits created at the other countries’ cost
(Barrett, 1994). So, the research highlight the formidable problems of opportunistic behavior
and inefficient outcomes.
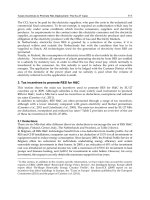
2. Energy trends
According to projections of the Reference Scenario (which gives economic and
environmental assessments of a world in which the economy continues on its current course
without polluting emission reductions policies), energy demand should increase by 1.5%
per year between 2007 and 2030 and fossil fuels remain the main sources of energy. They
represent three quarters of global energy consumption during the same projection period
and the dirtiest fuel, i.e. coal, is expanding its share to face the raising in energy
consumption mainly driven by developing countries, such as China and India. Actually,
non-OECD countries are the main drivers in the increase of energy demand as a result of
their economic and population growth.
EU Energy Policies and Sustainable Growth
5
Fig. 1. Gross Inland Consumption in 2007. Source: Eurostat (2009).
Renewable energies, including hydroelectric, geothermal, biomass, solar energy and wind
energy, grow at a fast pace relative to electricity production, but their share in energy
consumption is still low.
Country Solids Oil Gas Nuclear Hydro Biomass Other
United States 23.7 38.9 23.0 9.3 0.9 3.5 0.7
EU-27 ** 18.3 36.4 23,9 13.4 1.5 5.4 1.1
Japan 22.344.816.213.4 1.2 1.4 0.7
Russia 15.2 19.7 54.4 6.3 2.3 1.0 1.2
China * 65.6 18.2 3.1 0.8 2.1 9.9 0.2
India 40.8 23.7 5.6 0.7 1.8 27.2 0.3
Korea 25.342.514.016.8 0.1 1.2 0.0
Brazil 5.8 39.3 7.5 1.4 13.7 30.7 1.7
Canada 11.2 35.1 29.3 9.0 11.8 4.3 - 0.7
Mexico 4.9 56.9 27.4 1.5 1.3 4.5 3.5
Others 13.5 39.6 25.7 1.6 2.4 16.5 0.8
World 26.5 34.0 20.9 5.9 2.2 9.8 0.7
Table 1. Gross income consumption by country in 2007. Source: Eurostat (2009)
Almost 18% of total electricity in 2007 was generated by renewable energy and, according to
the Reference Scenario, it is supposed to rise to 22% in 2030. Actually energy production
from renewables is more expensive than fossil fuel based technologies, and the reasons for
Sustainable Growth and Applications in Renewable Energy Sources
6
such disadvantages are several. Methods used by economic engineering to evaluate cost-
accounting of energy technology projects are outdated; as a consequence, renewable
technology projects seems more expensive (Awerback, 2003). Moreover, it has to be taken
into account that production costs of energy from fossil fuels do not internalize both the
environmental and human health externalities. A higher penetration of renewable resources
in the energy mix would lead to both environmental and economic benefits, as a reduction
of polluting emissions and a mitigation of energy import dependency.
The concentration of greenhouse gases (GHG) in the atmosphere was at 438 parts per
million (ppm) of CO
2
equivalent in 2008, that is almost twice the pre-Industrial Revolution
level (IEA, 2009). Mostly of the world emissions originates from China and United States,
which together produce about 12.1 Gt CO2 that is 41% of world CO2 emissions. The
relation between GHG emissions and economic growth may be well understood through
the Kaya identity, which expresses CO
2
emissions of the energy sector in terms of GDP,
energy intensity of output, and carbon intensity of energy consumption (Stern, 2007):
Carbon Dioxide Emissions population per capita GDP energy intensity carbon intensity
From this identity it is clear that the increase in world GDP tends to increase global
emissions, unless increase in income stimulates a reduction in carbon intensity or total
energy (Nakicenovic et al., 2006).
Country
CO2 emissions
(Gt CO2)
GDP per
capita
Carbon
intensity
Energy
intensity
Population
USA 1.4 1.8 0.0 -1.5 1.2
EU 0.2 1.8 -0.7 -1.2 0.3
UK - 0.4 2.4 -1.0 -2.3 0.2
Japan 0.7 0.7 -0.5 0.2 0.3
China 3.7 8.5 1.1 -6.4 0.9
India 4.3 3.9 -0.3 -2.5 1.7
World 1.4 1.9 -0.1 -1.7 1.4
Table 2. Rate of growth of CO
2
emissions (%). Source: Stern (2007)
The contribution to global warming by countries is controversial. The United States
represent the second largest CO
2
emitter. On the one hand, the high share of CO
2
emissions
is related to the share of GDP that is the largest in the world. On the other hand, the United
States generates around 20% of global CO
2
emissions while the population is only 5% of the
total world population. China produces 22% of world polluting emissions but it accounts for
20% of the population of the world (Kawase et al., 2006).
The sectors that contribute more to CO
2
emissions are transport and electricity and heat
generation, that together account for two-thirds of global emissions in 2008 (IEA, 2010). The
former represents 22% of CO
2
emissions in 2008 worldwide, and the World Energy Outlook
2009 projections reveal that the share is estimated to grow to 45% by 2030. Actually, the level
of passengers travel is growing according to population growth, and only the EU is
encouraging fuel economy (as a response to high fuel price as well) through voluntary
EU Energy Policies and Sustainable Growth
7
agreement with manufacturers. Electricity and heat generation constitute the largest
polluting sectors in 2008, by making a 41% contribution to the world CO
2
emissions in 2008,
relying on carbon fuel, especially in developing countries such as China and India.
Fig. 2. Top 10 emitting countries in 2008 (Gt CO
2
). Source: IEA, 2010.
Fig. 3. World CO
2
emissions by sector in 2008. Source: IEA, 2010.
We deem imperative that a global response to face climate change is needed at the
European level. The EU energy portfolio relies strongly on fossil fuels, and it has
important consequences both in terms of “importing” CO
2
emissions and for energy
security reasons.
Sustainable Growth and Applications in Renewable Energy Sources
8
Origin 2000 2001 2002 2003 2004 2005 2006 2007 Share 2007(%)
Russia 112.4 136.8 154.7 170.8 188.9 188.0 189.6 185.3 33.9
Norway 115.9 108.1 103.1 106.4 108.6 97.5 89.1 84.3 15.5
Libya 45.5 43.8 39.1 45.9 49.9 50.6 53.1 55.5 10.2
Saudi Arabia 65.1 57.5 53.1 61.5 64.5 60.7 51.1 39.4 7.2
Other, Middle East 54.7 48.2 43.2 27.8 28.5 29.9 32.5 34.4 6.3
Iran 33.5 31.4 25.9 34.7 35.9 35.3 36.3 34.1 6.3
Kazahkhstan 9.9 9.1 13.4 15.9 22.2 26.4 26.8 18.3 3.4
Nigeria 22.4 25.7 18.4 23.2 14.9 18.6 20.2 15.5 2.8
Other Origin 58.2 62.3 64.2 56.6 56.6 66.2 65.9 78.1 14.4
Total Imports 519.8 522.9 515.3 542.9 570.2 573.4 564.7 545.1 100
Table 3. Crude oil imports in the EU27 (in Mt) in 2007. Source: Eurostat (2009)
Origin 2000 2001 2002 2003 2004 2005 2006 2007 Share 2007(%)
Russia 4539709 4421515 4554744 4895252 4951044 4952879 4937711 4685365 40.8
Norway 1985231 2136379 2601569 2699473 2801723 2671779 2844237 3061751 16.7
Algeria 2203075 1957181 2132477 2158803 2042137 2256826 2132236 1943976 16.9
Nigeria 172020 216120 217882 335929 410260 436319 563905 588317 5.1
Libya 33442 33216 25536 30390 47809 209499 321150 383615 3.3
Qatar 12443 27463 87952 80414 160170 195713 232721 275496 2.4
Egypt 202419 327394 221305 1.9
Trinidad and Tobago 36334 24498 19120 1365 29673 163233 104917 0.9
Other Origin 112810 199256 125425 100023 313245 409387 227147 213995 12.0
Total Imports 9095064 9015628 9764705 10301649 10726388 11364494 11749734 11478737 100
Table 4. Gas imports in the EU27 (in TJ) in 2007. Source: Eurostat (2009)
2000 2001 2002 2003 2004 2005 2006 2007 Share 2007 (%)
Total EU-27 151575 173041 171629 180360 196062 197043 213809 214358 100
Russia 14976 20875 23033 26545 40382 48304 55544 56117 26.2
South Africa 40177 49273 53961 56932 54190 51698 53080 46121 21.5
Australia 28600 29450 29337 31004 30838 27013 27147 29069 13.6
Colombia 23132 22633 21398 22908 24224 24147 26068 29018 13.5
United States 20447 20119 14082 12619 15416 15673 17370 20833 9.7
Indonesia 9097 10254 11540 13004 13980 14704 21092 17594 8.2
Other 15146 20437 18278 17348 17032 15504 13508 15606 7.3
Table 5. Coal imports in the EU27 (in kT) in 2007. Sources: Eurostat (2009)
3. Policy
The global response to climate change started with the so called Rio Earth Summit in 1992:
governments realized the need to work together for an environmental and sustainable
economic development. The Summit was a first move towards an environmental policy at
global level, by setting emission reduction targets for developed countries and establishing a
framework of wider reduction for the future from a sustainable development point of view. Its
weak point was that the Summit promised a lot at little costs, since it was an agreement without
stringent measures (Helm, 2008). The Summit has been followed by several discussions with the
purpose of finding optimal shared environmental policy for facing climate change.
EU Energy Policies and Sustainable Growth
9
Afterwards, the Kyoto Protocol, an international agreement adopted in Kyoto on December
1997, has committed (instead of encouraging) 37 industrialized countries and the European
Union (EU) to reduce a basket of six greenhouse gases. The Kyoto Protocol entered into
force in February by committing contracting parties as a group to achieve an overall
reduction in polluting emissions of 5% in the period 2008-12 with respect to 1990 levels(IEA,
2010). The Protocol has helped sensitive public awareness of problems related to climate
change. Despite the Protocol has detailed commitment for each country member in terms of
GHG reductions, it is limited in its potential to climate change mitigation since not all major
emitters as United States were included in reduction commitments. In March 2001, the
United States explicitly declared their non-participation in the Kyoto Protocol, because of
the too high potential compliance costs and the domestic voters’ low willingness to pay
(Böhringer and Vogt, 2004).
The European Community has taken part in the Kyoto Protocol through positive
measures. Between 2008 and 2012, countries that were already EU members, have to cut
8% off GHG emissions. Countries that have joined EU later undertake to cut emissions for
the same amount, apart from Poland and Hungary (6%). Kyoto Protocol suggests tools of
action:
strengthening of national policies to reduce emissions, as improvement of energy
efficiency, promotion of sustainable forms of agriculture, development of renewable
energies etc.,
cooperation with other contracting parties, as exchange of experience and information,
coordination of national policies through the right to emit.
During the period 1990-2007 the European Commission has recorded emission reductions as
follows:
7% in the energy sector;
11% in the industrial process;
11% in agriculture (reduced use of mineral fertilizers);
39% in the waste sector.
The EU results should be interpreted not only in the light of Kyoto and all following
agreements. The emission reductions are likely to be attributed to two factors as well: the
global economic and financial crisis that has reduced industrial production, and the new
member States entered in the European Union that have decreased on average the EU level
of emissions because of their less productive economies.
3.1 The European climate and energy package
Actually, the European environmental and energy policy is represented by the so-called “20-
20-20 Climate and Energy Package”, through which the EU is showing to be ready to
assume the global leadership to face climate change, tackle the challenges of energy security,
making Europe a model of sustainable development for the 21st Century. The EU aims to
achieve by 2020:
a commitment to reduce by at least 20% greenhouse gas emissions compared to 1990
levels by 2020, and the goal of reducing emissions by 30% by 2020 if other developed
countries make comparable efforts;
a binding target for the EU of 20% of energy from renewable sources by 2020, including
a target for biofuels.
Sustainable Growth and Applications in Renewable Energy Sources
10
1990 2008
% change
90-08
Kyoto
Target
Kyoto Parties with targets 8 858.3 7 980.1 -9.2% -4.7%
North America
432.3 550.9 27.4%
Canada 432.3 550.9 27.4% -6%
Europe
3 153.6 3 222.9 2.2%
Austria 56.5 69.3 22.7% -13%
Belgium 107.9 111.0 2.8% -7.5%
Denmark 50.4 48.4 -4.0% -21%
Finland 54.4 56.6 4.0% 0%
France 352.3 368.2 4.5% 0%
Germany 950.4 803.9 -15.4% -21%
Greece 70.1 93.4 33.2% +25%
Iceland 1.9 2.2 17.0% +10%
Ireland 29.8 43.8 46.7% +13%
Italy 397.4 430.1 8.2% -6.5%
Luxembourg 10.5 10.4 -0.6% -28%
Netherlands 155.8 177.9 14.1% -6%
Norway 28.3 37.6 33.0% +1%
Portugal 39.3 52.4 33.5% +27%
Spain 205.8 317.6 54.3% +15%
Sweden 52.8 45.9 -13.0% +4%
Switzerland 40.7 43.7 7.4% -8%
United Kingdom 549.3 510.6 -7.0% -12.5%
Pacific
1 346.6 1 582.0 17.5%
Australia 260.1 397.5 52.9% +8%
Japan 1 064.4 1 151.1 8.2% -6%
New Zealand 22.0 33.3 51.5% 0%
Economic in Transition
3 852.9 2 624.3 -31.9% -6%
Other Countries (non-
participating)
11 566.6 20 368.2 76.1%
United States 4 868.7 5 595.9 14.9% -7%
China 2 244.4 6 550.5 191.9%
Latin America 869.5 1 476.5 69.8% none
Africa 545.6 889.9 63.1% none
Middle East 592.5 1 492.3 151.8% none
Non-OECD Europe 106.1 92.2 -13.1% none
Asia (excl. China) 1 510.1 3 521.1 133.4% none
WORLD 20 964.8 29 381.4 40.1%
Table 6. World CO
2
emissions from fuel combustion (in Mt) and Kyoto targets. Source: IEA,
2010