Sustainable Growth and Applications in Renewable Energy Sources Part 5 doc
Bạn đang xem bản rút gọn của tài liệu. Xem và tải ngay bản đầy đủ của tài liệu tại đây (1.12 MB, 20 trang )
Renewable Energy and Coal Use in Turkey
71
16
14
13
11
9
8
8
7
7
6 6
6
5
4
3
2
2
1
1
2
2 2
2
2 2
2 2
2
1
1
1 1
1
1
1 1
1 1 1 1
13
11
11
19
16
14
14
19
22
20 20
22
24
26
28
31
35
35
31
30
30
29
29
28
28
29
28
28
27
24
24
23
20
18
18
18
20
20
20
18
32
34
33
31
39
43
43
40
39
42 42
43
46
47
46
43
39
40
43
42
42
41
45
48
47
47
47
46
44
40
41
41
39
35
34
33
32
33
34
34
61
59
57
60
64
65
65
66
67
68 68
70
75
76
76 76
76
77
75
74
73
73
76
77
77
78
77
75
72
66
66
65
60
54
53
53
53
54
54
54
0
10
20
30
40
50
60
70
80
90
100
1970
1971
1972
1973
1974
1975
1976
1977
1978
1979
1980
1981
1982
1983
1984
1985
1986
1987
1988
1989
1990
1991
1992
1993
1994
1995
1996
1997
1998
1999
2000
2001
2002
2003
2004
2005
2006
2007
2008
2009
% of total installed capacity
LIGNITE
RENEWABLE
Hard coal
Total Indigenous
energy sources
Imported energy sources:
Oil, Natural gas, Hard coal
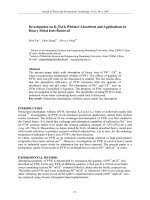
Fig. 11. During of the period 1970 and 2009 development of the share of renewable energy
and coal by the total installed capacity (data from TEIAS, 2009)
in electricity production increased, since it is a cheaper than other resources, and this was
quickly renounced after the oil crisis in 1973. After the crisis, Turkey gave importance on lignite,
one of its own energy resources, and the share of coal in electricity production began increasing
and reached 50%. After 2000s, use of natural gas began using in electricity production as in all
other areas and its share in electricity production reached 45% in a very short time until 2003.
Also imported hard coal began to use in electricity production with 6% in 2003. The share of
natural gas has increased and reached to 49% in electricity generation in 2009. At the same year,
distribution by resources was as follows natural gas: coal (hard coal %2 + lignite %20)
renewable %19, oil %3, and imported hard coal 7% (Yılmaz 2008; Yılmaz, and Aydıner, 2009).
Hard coal
Lignite
İmporte d
coal
Renewable
Natural gas
Petroleum
Other
86
86
88
87
87
88
88
88
88
87
86
84
81
82
81
82
79
75
61
63
55
49
60
38
54
45
47
34
32
31
33
30
26
26
29
26
24
24
26
29
26
25
24
31
33
44
49
40
26
39
35
36
36
32
36
33
32
33
32
32
31
31
25
23
23
27
26
28
29
29
89
91
93
92
92
93
93
92
92
91
90
89
87
87
87
87 87
90
89
90
90
91
91
91
91
89
89
73
78
75
68
57
54
47
54
64
69
65
69
74
74
76
78
73
77
79
79
82
86
74
75
74
76
78
75
74
75
71
70
62
55
51 51
48
54
51
52
47
46
48
0
10
20
30
40
50
60
70
80
90
100
1940
1942
1944
1946
1948
1950
1952
1954
1956
1958
1960
1962
1964
1966
1968
1970
1972
1974
1976
1978
1980
1982
1984
1986
1988
1990
1992
1994
1996
1998
2000
2002
2004
2006
2008
% of total
27 %
61 %
21 %
6 %
12 %
11 %
21 %
51 %
2 %
47 %
30 %
17 %
1.9 %
20 %
19 %
2.5 %
Coal
Total
3 %
(Coal+Renewable)
Total
45 %
49 %
25 %
7 %
17 %
14 %
10 %
2.5 %
1.9 %
6 %
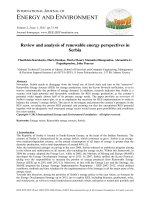
Fig. 12. During period of the 1940- 2009 electricity production by energy sources (data from
TEIAS 2009)
Sustainable Growth and Applications in Renewable Energy Sources
72
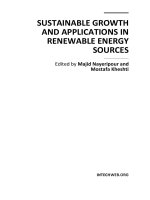
The first of the areas where coal and renewable energy can be used most intensively is
electricity production. In Figure 13, distribution of the total electricity production by renewable
energy and coal sources are given in a historical order. As seen in the Figure, coal (especially
hard coal) and renewable energy had a share of 68% (hard coal 16%, lignite 17% and renewable
18%) in electricity production in 1970. The rate of electricity production using renewable energy
resources and lignite had begun increasing in time and the share of the hard coal decreased to
1% until beginning of 1988 and the share of renewable energy resources and lignite increased to
42% and 38% respectively. But, after that time the total electricity generation by renewable
energy and coal resources decreased and reached to 41 % (hard coal 2%, lignite 20 % and
renewable 19%) in 2009. Turkey has become a country, which imports 70% of its energy
resources, during this term. Because after the crisis in 1973, Turkey gave importance on lignite,
one of its own energy resources, and the share of coal in electricity production began increasing.
However, after 2000s, use of natural gas began prevailing in electricity production as in all other
areas and its share in electricity production reached 45% in a very short time.
16
15
13
12
11
9
7
6
6
5
4
4
3
3
2
2
2
1
1
1
1
2
3
2
3
3
3
3
3 3
3
2
2
2
2
2
2 2
2
2
17
16
13
14
17
17
16
18
20
24
22
21
21
28
31
42
47
38
25
38
34
34
34
30
34
30
29
30
29
29
28
28
22
17
15
18
18
20
21
20
35
27
29
21
25
38
46
42
43
46
49
51
53
41
44
35
30
42
60
35
40
38
40
46
39
41
43
39
38
30
25
20
26
25
31
25
25
19
17
19
68
57
54
47
54
64
69
65
69
74
74
76
78
73
77
79
79
82
86
74
75
74
76
78
75
74
75
71
70
62
55
50 50
44
47
45
45
41
40
41
0
10
20
30
40
50
60
70
80
90
100
1970
1971
1972
1973
1974
1975
1976
1977
1978
1979
1980
1981
1982
1983
1984
1985
1986
1987
1988
1989
1990
1991
1992
1993
1994
1995
1996
1997
1998
1999
2000
2001
2002
2003
2004
2005
2006
2007
2008
2009
% of total electricity production
LIGNITE
RENEWABLE
Hard coal
Total Indigenous
energy sources
Imported energy sources:
Oil, Natural gas, Hard coal
Fig. 13. During of the period 1970 and 2009 development of the share of renewable energy
and coal in the total electricity production (data from TEIAS 2009)
3.2 Renewable energy potential of Turkey
The potentials of the main renewable energy sources of Turkey are collectively given in
Table 2. The economical potential given in the Table equals the usable potential. The mostly
used renewable energy sources in Turkey are biomass energy and hydraulic energy. While
geothermal is the third source in the listing, its use is very limited. Use of solar energy is at
an emblematic level and use of wind energy is being commenced recently. The overall
economical and/or usable potential of the listed renewable energy sources is at a level of 68
Mtoe/year (TUSIAD,1998).
The overall annual electricity production potential of renewable energy sources is 486.3
billon kWh economically. Solar energy, geothermal energy and wind energy potentials are
not used or used scarcely. The most used renewable energy source in Turkey is hydraulic
energy. Today, the economical hydroelectric potential of Turkey is 129.9 billion kWh and
35% (45.930 GWh) of it is operative, 8% (10.518 GWh) of it is under construction and 57%
(73.459 GWh) of it is at project level Table 2.
Renewable Energy and Coal Use in Turkey
73
Renewable Energy Source Gross Technical Economic available
Hydropower
(MW)
(billion kWh/year)
107 500
430
53 730
215
36652
129.9
Geothermal
Heat (MW)
(Mtoe/year)
Electricity (MW)
(billion kWh/year)
31 500
-
4 500
-
7 500
5.4
500
-
2 843
1.8
350
1.4
Solar
Heat + electricity (MW)
(billion kWh/year)
(Mtoe/year)
111 500 x 10
3
977 000
80 000
1 400 000
6 105
500
116 000
305
25
Wind
Electricity (MW)
(billion kWh/year)
220 000
400
115 000
290
20 000
50
Classic Biomass
Fuel (Mtoe/year)
Modern Biomass
Fuel (Mtoe/year)
30
90
10
40
7
25
Table 2. Potential of Renewable Energy Sources (MENR,2009)
4. Coal and energy
4.1 Energy production based on coal
The coal production culture in Turkey was introduced with the exploration of hard coal by
Uzun Mehmet in Köseağzı quarter of Kestaneci village in Zonguldak province on 8
th
November 1829. Up to date, hard coal has been produced in Turkey. There is no definite
information about the first use of lignite. It is known that lignite was being produced in
many locations in Turkey, especially in Soma -Kütahya (Yılmaz, 2008).
Hard coal is used intensively in industry and heating and especially in electricity production.
Lignite coals are used mostly for electricity production since its calorific value is low. The
share of coal in overall primary energy production was 31% (lignite 12%, hard coal 19%) in
1970, and it increased to 46% (lignite 38%, hard coal 8%) in 1990 with an increase rate of 48%.
In 2009, the share of coal in total primary energy sources has increased and reached to 57%
(lignite 53%, hard coal 4%) as shown in Fig 14. The primary energy production of Turkey has
been limited and the largest share in this increase belonged to lignite. It is hope that this rate of
percentage increase will continue in the following years. On the other hand, the share of coal
in overall consumption was 24% (lignite 9%, hard coal 15%) in 1970, and it increased to 31%
Sustainable Growth and Applications in Renewable Energy Sources
74
(lignite 19%, hard coal 12%) in 1990 with an increase rate of 16%. In 2009, the share of coal in
total primary energy sources decreased and reached to 29% (lignite15%, hard coal 14%) (Fig.
15). Turkey’s primary energy consumption is higher than energy production. In other words,
the increase rate of primary energy consumption is about 6 times of that of the production.
And Turkey consumes 6 times of its production. If this rate increased in the following years,
Turkey would become an import dependent country in terms of energy in the following years
(Arıoğlu, Yılmaz, 2002a, 2002b,2002c; MENR, 2009; Yılmaz 2008).
19
20
19
18
19
18
17
16
15
14
13
13
13
11
11
10
9
8
9
8
8
7
6
7
6
5
5
5
4
4
4
5
4
5
4
5
5
4
4
4
12
13
15
16
17
18
19
20
23
20
23
25
26
30
32
38
39
40
36
42
38
36
39
37
39
40
40
42
44
44
44
45
42
41
39
41
44
50
53
53
31
33
34
34
35
36
37
36
38
34
36
38
39
41
43
48
48
49
45
50
46
43
45
44
46
45
45
47
48
48
48
50
47
45
43
46
49
54
57
57
0
5
10
15
20
25
30
35
40
45
50
55
60
65
1970
1971
1972
1973
1974
1975
1976
1977
1978
1979
1980
1981
1982
1983
1984
1985
1986
1987
1988
1989
1990
1991
1992
1993
1994
1995
1996
1997
1998
1999
2000
2001
2002
2003
2004
2005
2006
2007
2008
2009
% of total production
LIGNITE
HARD COAL
Coal in total production
Fig. 14. During of the period 1970 and 2009, development of the share of coal energy sources
in primary energy production (data from MENR, 1970-2009)
15
14
13
12
12
11
10
8
88
7
8
7
6
6
6
5
5
5
4
4
3
3
3
3
2
2
2
2
1
1
2
11
1
1
1
1
1
1
0
0
0
0
0
0
1
1
1
2
2
1
2
3
3 4
4
5
6
5
8
9
8
7
7
7
9
10
11
9
11
8
10
12
13
12
13
14
12
13
9
10
10
11
11
13
14
17
22
17
20
19
20
19
17
18
17
16
17
17
17
16
15
14
12
11
11
12
13
15
15
24
24
23
21
22
22
21
20
20
22
22
22
23
25
27
30
31
30
28
30
30
32
30
27
27
26
27
29
29
28
28
25
25
25
26
24
26
28
28
30
0
5
10
15
20
25
30
35
1970
1971
1972
1973
1974
1975
1976
1977
1978
1979
1980
1981
1982
1983
1984
1985
1986
1987
1988
1989
1990
1991
1992
1993
1994
1995
1996
1997
1998
1999
2000
2001
2002
2003
2004
2005
2006
2007
2008
2009
% of total consumption
LIGNITE (indigenous)
HARD COAL (indigenous)
HARD COAL (iimported)
Fig. 15. During the period of 1970 -2009 development of share of coal in primary energy
consumption (data from MENR, 1970-2009)
Renewable Energy and Coal Use in Turkey
75
4.2 Coal potential, production and consumption
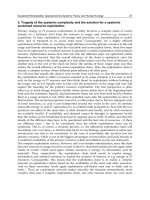
Turkey has an important potential from the point of view of coal reserves (Fig. 16). Apart
from the hard coal and lignite reserves, asphaltite, bituminous shale and peat reserves are
also present in the country. Turkey’s significant hard coal basin exists in Zonguldak
province which is on the Western Back Sea Region. The total reserve (ready + proven +
probable + possible) is about 1.3 billion ton (Table 3). Hard coal reserves are distributed into
five districts. Distributions of total reserves among these five districts are: Ereğli 34 million
tons; Zonguldak 884 million tons; Amasra 408 million tons; Kurucaşile 1 million tons;
Azdavay 5 million tons. The calorific value of the hard coal differs from 6.500 to 6.650
kcal/kg (Table 3) (TTK, 2004,2009; TKI, 2004,2009).
BİNGÖL
KAHRAMANMARAŞ
SİVAS
ÇORUM
MUĞLA
DENİZLİ
KÜTAHYA
ESKİŞEHİR
ANKARA
BOLU
KONYA
BURSA
ÇANAKKALE
BALIKESİR
MANİSA
AYD IN
MARMARA
DENİZ İ
iSTANBUL
TEKİRDAĞ
BLACK SEA
MEDITERRANEAN S E A
4.9
Billion ton
1.4
Billion ton
666
Million ton
438
Million ton
386
Million ton
80
Million ton
254
Million ton
275
Million t on
30
Million ton
29
Million ton
82
Million ton
100
Millio n ton
38
Million ton
104
Million ton
6
Million ton
3
Million ton
340
Million ton
323
Million ton
435
Million ton
ADANA
1.3
Billion ton
HARD COAL
LIGNITE
Fig. 16. Distribution of hard coal and lignite reserves of Turkey
Location RESERVES (1000 TON)
Calorific
value, kCal/kg
Province Dictrict Proven Probable Possible Total
Zonguldak Ereğli 11.241 15.86 7.883 34.984 6650
Zonguldak Center 351.272 294.043 239.029 884.345 6650
Bartın Amasra 172.107 115.052 121.535 408.694 6000
Bartın Kurucaşile 1 1 6500
Kastamonu Azdavay 5.593 5.593 6500
TOPLAM 534.62 431.548 368.447 1.334.615 -
Table 3. Distribution of hard coal reserves of Turkey (MENR 2010)
Hard coal Production is maintained under very difficult geological conditions. The production
depth reached 600-1000 m in some regions. Such difficult working conditions caused that the
unit costs increased and this affected the competitive power of the country in world's markets.
In addition, the expected increase in production could not be achieved and contrary to
expectations the production was decreased to 3 million tons from 9 million tons (Table 4). This
Sustainable Growth and Applications in Renewable Energy Sources
76
production level can meet only 10%-12%of the overall consumption of Turkey, which are 22-23
million tons. While, especially in the recent years, a significant part of the produced hard coal
is used for electricity production, the remaining coal is consumed for other purposes, such as
iron and steel industry, household fuel etc as illustrated in Fig.17 and Table 4. In 2009, the
share of hard coal consumption by sectoral were 70%, 27% and 4% for industry, power station
and house hold, respectively (Yılmaz 2011; TTK 2009; MENR 2010).
Years
Hard coal
production/consumption
(x1000 ton/year)
[production
/
consumption]
x100], %
Consumption
[x1000 ton/year]
Distribution of total
consumption, %
Production Consumption
Industry
Power
station
House
hold
Industry
Power
station
House
hold
2000
2,392 15,525 15.41 12,777
2,034
714 82.3 13.1 4.6
2001
2,494 11,176 22.32 8,106 2,274
796 72.5 20.3 7.1
2002
2,319 13,830 16.77 10,920
2,051
859 79.0 14.8 6.2
2003
2,059 17,535 11.74 12,845
3,706
984 73.3 21.1 5.6
2004
1,946 18,904 10.29 13,435
4,565
904 71.1 24.1 4.8
2005
2,170 19,421 11.17 13,227
5,259
935 68.1 27.1 4.8
2006
2,319 22,798 10.17 16,315
5,618
865 71.6 24.6 3.8
2007
2,462 25,388 9.70 18,611
5,912
865 73.3 23.3 3.4
2008
2,601 22,720 11.45 15,658
6,197
865 68.9 27.3 3.8
2009
2,863 23,698 12.08 16,472
6,361
865 69.5 26.8 3.7
Table 4. Hardcoal production, consumption and using areas
82
73
79
73
71
68
72
73
69
70
13
20
15
21
24 27
25
23
27
27
5
7
6
6
5
5
4
3
4
4
0%
10%
20%
30%
40%
50%
60%
70%
80%
90%
100%
2000 2001 2002 2003 200
4
2005 2006 2007 2008 2009
Power station
industry
House hold
Hard coal consumption areas [%]
Fig. 17. Distribution of hard coal consumptions by sectoral (data from MENR 2000-2010)
Renewable Energy and Coal Use in Turkey
77
Lignite reserves constitute the large portion of total coal reserves. Lignite deposits
dispersed all over the country (Yılmaz, 2006). The most important known lignite deposits
reserves are located in Afşin Elbistan, Muğla Soma, Tunçbilik, Seyitömer, Beypazarı and
Sivas regions (Fig. 16). About 40% (4.9 billion tons) lignite reserve is located around Afsin-
Elbistan which is in the southeast of the Turkey (Yılmaz and Uslu 2007). Although total
lignite reserves were about 8.07 billion tons (TKI 2009; TKI, 2010), Turkey’s new total
lignite reserves including proven, probable and possible reserves have reached about 11.4
billion tons after recent exploration activities. Turkey has a share of 2.5% in the world
reserves and 8.2% in the world production (Yılmaz , 2011). Distribution of the lignite
reserves in the Turkey is shown in Table 5 (TKI, 2004; 2010). Turkey’s coal deposits are
operated by companies which are Turkish Hard Coal Enterprise (TTK), Turkish Coal
Enterprises (TKI) and the Electricity Generation Company (EUAS) and Private sectors.
TTK is authorized for hard coal production, processing and distribution. More than half
of lignite reserves are produced by TKI. Production of remains are belongs to private
companies and EUAS for we in power plants. The distribution of reserves is as follows:
TKI 21.5 %, EUAŞ 42 %, MTA 23% and Private sector 13.5% (Table 5.) (Yılmaz 2008, EUAS
2004,2009; Anaç 2003).
LIGNITE
Coal field
Reserves (1000 TON)
Ration in
total, %
Calorific
value,
Kcal/kg
Proven Probable Possible Total
EÜAŞ 4.718 104 - 4.822 42.0
1031-4900
TKİ 2.239 218 1 2.458 21.5
MTA 1.803 685 123 2.611 23.0
Private
sector
1.077 337 138 1.554 13.5
TOPLAM 9837 1344 262 11.445 100
ASPHALTITE
Location Reserves (1000 TON) Calorific
value,
Kcal/kg
Province Dictrict Proven Probable Possible Total
Şırnak Silopi 31.812 16.21 1 49.022 5310
Şırnak Merkez 7.724 13.26 6.3 27.284 5330
TOPLAM 39.536 29.47 7.3 76.306 -
Table 5. Distribution of Lignite and Asphaltite Reserves of Turkey (Data from, TTK, 2004;
TKI, 2010).
The lignite mined from most lignite deposits is low calorific value lignite and the calorific
value of 90% of them is between 1000 and 3000 Kcal/kg (Fig.18). In this context, a
significant part of the lignite production is used for electricity production (Fig 19.). Lignite
production depends on electricity production. Lignite production reached to 76 million
ton/year especially in 1970 and 2009 term, when the lignite production is very effective in
electricity production. Its production decreased to 45 million ton/year after 2000, since its
use in electricity production repressed after 2000. The overall lignite consumption can be
met by the domestic production (Fig.19.)
Sustainable Growth and Applications in Renewable Energy Sources
78
Lignite production depends on electricity production While 1% of produced lignite in 1970
was used in power stations, 5% was used as house hold and industry. In 2000, the share of
lignite consumption by sectoral were 82% and 18% power station and house hold and
industry, respectively. In 2009, the share of the power station in lignite consumption
increased and reached to 83% (Fig. 19).
<1000 Kcal/kg
%3.2
1000-2000Kcal/kg
%65.6
2000-3000 Kcal/kg
%24.3
3000-4000
Kcal/kg
%5.1
>4000 Kcal/kg
%1.8
Fig. 18. Lignite by calorific value
1
2
6
20
30
40
53
48
51
61
66
63
5
7
9
15
16
13
11
8
10
12
13
6
9
15
35
46
52
64
57
60
72
75
76
6
9
15
36
44
53
61
58
61
72
76
76
0.0
10.0
20.0
30.0
40.0
50.0
60.0
70.0
80.0
1970 1975 1980 1985 1990 1995 2000 2005 2006 2007 2008 2009
Lignite production/consumption [Million ton/year]
Lignite production Lignite consumption
Power station
House hold+industry
Fig. 19. Lignite production/consumption and consumption areas (data from TKI, 1970-2009)
Renewable Energy and Coal Use in Turkey
79
5. Future projection
The primary energy production–consumption of Turkey and distribution of electricity
production of Turkey by sources projected for the years 2015 and 2020 are given in Figs.
20–21. No major change is seen or foreseen in the development of share of domestic
energy sources in primary energy production. It is planned that this rate will be 32% in
2015 and 30% in 2020. In other words, 70% of the primary energy production of Turkey
will be dependent on imports. On the other hand, renewable energy sources and hard coal
constitute 90% of the primary energy consumption; 5–10 points increase is foreseen in the
share of coal in primary energy production 2015 and 2020. It is planned that this share
will be 54% and 61%, respectively, for the years. The dependence on imported energy
sources for electricity production projected for the years 2015 and 2020 are 47% and 50%,
respectively (Fig.22). It is projected that the share of coal in electricity production will
increase to 28% in 2020 and no significant change is planned in electricity production
using renewable sources and it is projected that this share will decrease to 23% in 2020. In
other words, Turkey does not plan to introduce any expansion in energy production until
2020 when compared with today’s conditions according to its energy projections
(Yılmaz,2008; TPAO 2006).
13
14
16
17
17
18
11
9
9
10
9
9
73
74
72
71
68
70
27
26
28
29
32
30
0
10
20
30
40
50
60
70
80
90
100
2006 2007 2008 2009 2015 2020
% of total consumption
FUTURE
Total Indigenous
energy sources
Imported energy sources:
Oil, Natural gas, Hard coal
COAL
RENEWABLE
Fig. 20. Projection of development of the share of domestic energy sources in overall
primary energy consumption (data from MENR, 2006,2010).
Sustainable Growth and Applications in Renewable Energy Sources
80
49
54
57
57
54
61
39
35
32
33
28
30
12
11
11
10
18
9
0%
20%
40%
60%
80%
100%
2006 2007 2008 2009 2015 2020
Coal (Hard coal+lignite)
% of total
Renewable
Other
FUTURE
Fig. 21. Projection of distribution of domestic energy sources in overall primary energy
production (data from MENR, 2006,2010).
20
22
23
22
24
28
25
19
17
19
23
23
55
59
60
59
53
50
45
41
40
41
47
50
0
10
20
30
40
50
60
70
80
90
100
2006 2007 2008 2009 2015 2020
% of total consumption
FUTURE
Total Indigenous
energy sources
Imported energy sources:
Oil, Natural gas, Hard coal
COAL=Hard coal+Lignite
RENEWABLE
Fig. 22. Projection of development of domestic energy sources in electricity production (data
from MENR, 2006,2010).
6. Discussion and conclusion
Turkey imports about 70% of the energy sources it uses in primary energy consumption.
This percentage is 59% for electricity production. The imported energy sources are oil,
natural gas and hard coal. The load of imports on Turkey’s economy as of 2000-2009 is
illustrated in Fig. 23. Turkey spent 29 billion dollars overall for energy imports in 2009. This
amount constitutes 29% of the overall exports in 2009 and 21% of the overall imports. In
other words, Turkey spends approximately one-third of the income it obtains from overall
exports for energy imports. Oil and natural gas are the most imported energy sources with a
Renewable Energy and Coal Use in Turkey
81
percentage of 89% (26 billion dollars) of the overall energy source imports and it is followed
by hard coal with a percentage of 11% (3 billion dollars). The incredible increase rate of
natural gas consumption in the recent years constitutes an important expense item in the
imports items of Turkey. More importantly, use of natural gas in industry and electricity
production makes Turkey completely dependent on the foreign countries in terms of energy
security. Especially Turkey’s supplying over 50% of its electricity production from natural
gas causes very severe security problems and Turkey should question this issue very
seriously. On the other hand, although Turkey has sufficient hard coal reserves, it
increasingly imports hard coal in order to consume it in industry and electricity production
due to some reasons such as production difficulties and insufficient investments. Turkey
should immediately take action in order to meet such requirements from its own sources. It
should not be expected that the domestic production covers the consumption within a very
short time, but it should be aimed at meeting or minimizing the deficit between the
production and import within a long time. On the other hand, although Turkey has
sufficient lignite reserves for electricity production, importing hard coal for this purpose is a
completely strategic mistake (Yılmaz,2008).
200
0
2001 2002 2003 2004 2005 2006 2007 2008 2009
Import
55 41 52 69 98 117 140 170 202 141
Export
28 31 36 47 63 73 86 107 132 102
Energy imp/import. [ %]
17 2
0
18 17 15 18 21 20 24 21
55
41
52
69
98
117
140
170
202
141
28
31
36
47
63
73
86
107
132
102
17
20
18
17
15
18
21
20
24
21
0
50
100
150
200
250
Import-Export, [Billion $]
Fig. 23. Load of energy source imports on Turkey’s economy
Sustainable Growth and Applications in Renewable Energy Sources
82
The largest energy sources of Turkey are coal and renewable energy. Turkey should use
these energy sources in areas where it can substitute them for oil and natural gas. The
first of these areas is electricity production. In projections of Turkey (Fig. 22), it is
proposed that 50% of the electricity production will be imported. It is planned that the
overall demand for electricity will be 500 billion kWh in 2020. However, there is a
potential for producing reliable electricity from renewable energy sources (480 billion
kWh) and lignite thermal power plants (100 billion kWh), which are operative and of
which the projects are completed, economically (Table 2.). In other words, Turkey has a
potential for producing electricity it demands by using only its own sources. It is
obligatory to comply with the environmental pollution and emission limits in use and
production of coal. The required measures in this regard has been taken in most of the
operative power plants and the studies for taking such measures continue rapidly in the
other power plants. It is vital for Turkey to take operating the coal reserves by using
environment-friendly technologies and utilizing its sources at the highest level among its
priorities (Yılmaz, 2008).
7. References
Anaç, S. (2003). The Place of Coal in Energy Policies in Turkey, Turkish Coal Enterprise,
Available from .
Arıoğlu E. (ed).(1994). General Outlook to Turkish Lignite Sector, Privatisation in the World
and Turkey, Turkish Mine Workers Union Publication, Ankara.
Arıoğlu, E.(1996) General Outlook For Worldwide Hard Coal Mining and The
Evaluation of The Zonguldak Coal Enterprise/TURKEY, Privatization in The
UK and Turkey With Particular Reference to The Coal Sector
(Ed.M.Dartan), Marmara University European Community Institute, Istanbul,
May
Arıoğlu, E., & Yılmaz, A.O. (1997a). A Short Statistical Evaluation of Turkish Lignite Sector
During 1983–1993. Istanbul Branch of Mining Engineers Chamber of Turkey, Working
Report No. 2, Istanbul.
Arıoğlu, E; Yılmaz, A.O. (1997b). Turkish Economy With Macro Economic
Indications and Statistical Evaluation of Turkish Mining Sector, Istanbul
Branch of Mining Engineers Chamber of Turkey, Working Report No :5,
Istanbul
Arıoğlu, E., & Yılmaz, A.O. (2002a). General Outlook for Worldwide Hard Coal Mining
and the Evaluation of the Zonguldak Coal Enterprise. Proceedings of the 13th coal
congress of Turkey, Zonguldak Branch of Mining Engineers Chambers of Turkey,
Zonguldak,
Arıoğlu, E, & Yılmaz, A.O. (2002b). Realities in Zonguldak coal basin. Zonguldak Branch of
Mining Engineers Chamber of Turkey, Zonguldak,
Arıoğlu, E; & Yılmaz, A.O. (2002c). Evaluation of Turkish Lignite Mining, Tunçbilek
Municipality 2
nd
Lignite Festival, Tunçbilek, Kütahya.
BP ( 2009, 2010 ). Statistical Review of World energy, Annual Report. Available from
Renewable Energy and Coal Use in Turkey
83
EUAS.(2004,2009). Statistic Data, Electricity Generation Co. Inc. Available from
.
MENR. (1970,2000,2002, 2006, 2009, 2010). Ministry of Energy and Natural Resources
(MENR), Energy report of Turkey, Ankara. Available from
.
SIS. (2003,2004). State Institute of Statistics yearbook of Turkey, Prime Ministry, Available
from http:// www.tuik.gov.tr / [in Turkish and English]. Republic of Turkey,
Ankara.
TEIAS. (1970, 2004, 2009). Electricity Generation-Transmission Statistics of Turkey,
Turkish Electricity Transmission Co. General Management Rpc
Department, Ankara. Available from: [in Turkish
and English].
TKI. (2004,2009, 2010). Turkish Coal Enterprises. Coal (lignite) Annual Sector Report.
Available from:
TPAO(2006) Primary Energy Production–Consumption in Turkey. Available from
rprte/ energytr2.htmS.
TTK, (2004, 2009). Turkish Hard Coal Enterprises, Annual Reports, Zonguldak. Available
from:
TUSIAD. 1998. The Evaluation of Turkey’s Energy Strategies Toward to 21st Century.
Publication Number TUSIAD-T/98-12/239, İstanbul.
Yılmaz, A.O, & Arıoğlu E.(2003). The Importance of Lignite in Energy Production and
Turkish Coal Enterprise. In: Proceedings of the 18th International Mining Congress
and Fair of Turkey. Mining Engineers Chamber of Turkey. Antalya.
Yılmaz, A. O, & Aydıner, K. (2009). The Place of Hard Coal in Energy Supply Pattern of
Turkey, Energy Sources, part B, 4, 179-189.
Yılmaz, A. O., & Uslu, T.(2006). The Role of Coal in Energy Production—Consumption and
Sustainable Development of Turkey. Energy Policy, 35, 1117–1128.
Yılmaz, A. O.& Uslu, T.(2007). Energy policies of Turkey During the Period 1923–2003.
Energy Policy, 35, 258–264.
Yılmaz, A.O. &Uslu, T. & Savaş M.(2005). The Role of Coal in Sustainable Development of
Turkey, Turkish 5th Energy Symposium, Electricity Engineers Chamber of Turkey,
Ankara.
Yılmaz, A.O.(2003). General Outlook to Turkish Energy Sector and the Importance of Coal
in Energy Production. In: Turkish Fourth Energy Symposium, Electricity Engineers
Chamber of Turkey, Ankara.
Yılmaz, A.O., (2004,2011) . Energy Statistics of Turkey, Unpublished Documents,
Trabzon.
Yılmaz, A. O.(2006). Coal potential of Turkey: Coal and Energy, Energy Exploration
Exploitation ,Volume 24, Number 6, 371–390
Yılmaz, A.O.(2008). Renewable Energy and Coal Use in Turkey,
Renewable Energy, 33, 950–
959.
Yılmaz, A.O.(2009). Present Coal Potential of Turkey and Coal Usage in Electricity
Generation, Energy Sources, part B, 4, 135-144.
Sustainable Growth and Applications in Renewable Energy Sources
84
Yılmaz, A.O.(2011), Evaluation of Turkish Lignite Mining, Tunçbilek Municipality 8
rd
Lignite
Festival, Tunçbilek, Kütahya.
5
Experiences of Community Wind Electrification
Projects in Bolivia: Evaluation and
Improvements for Future Projects
Laia Ferrer-Martí et al.
*
Universitat Politècnica de Catalunya - Barcelona Tech,
Spain
1. Introduction
Currently, early in the XXI century, an estimated 2400 million people depend on traditional
biomass for heating and cooking and 1500 million people lack access to electricity (IEA,
2009). Lack of electricity particularly affects rural areas of developing countries (Kanagawa
and Nakata, 2008), exacerbating the urban-rural gap. In Bolivia, 35% of the population, more
than 3.5 million people do not have access to electricity.
Electrification systems based on renewable energy have proved being adequate to provide
decentralized electricity to isolated rural communities around the world (Chaureya et al.,
2004). These autonomous systems are often much cheaper than the interconnected grid
extension and use local resources, avoiding external dependencies which, in turn, promotes
long-term sustainability of projects. In particular, micro-wind systems are an alternative
with great potential to generate power in rural areas (Lew, 2000), although their use has
been limited to date. In South America, a significant institutional effort was made in
Argentina to develop rural electrification projects using wind energy in the province of
Chubut (Seitz, 2006). In Peru, there are some demonstrative projects of the use of wind
power to electrify isolated communities, the first one in El Alumbre (Ferrer-Martí et al.,
2010).
In Bolivia, the government's policies on rural electrification are governed by the Rural
Electrification Regulation, which states that the Department of Energy is responsible for
promoting sustainable development, seeking expanded coverage of electricity services
throughout the country. Therefore it has the responsibility to update and develop the rural
energy strategy, including the Indicative Rural Electrification Plan to facilitate the work of
agents in the development of rural electrification. The basic principles that are taken into
account are:
*
Bruno Domenech
1
, Walter Canedo
2
, Carlos Reza
2
, Mirtha Tellez
3
, Milton Dominguez
3
,
Lorenzo Perone
4
and Jaime Salinas
1
Universitat Politècnica de Catalunya - Barcelona Tech, Spain
2
CINER, Bolivia
3
Mosoj Causay, Bolivia
4
Engineering Without Borders, Spain
Sustainable Growth and Applications in Renewable Energy Sources
86
Legitimacy of demand, which is to prioritize energy projects according to the law of
popular participation and decentralization of administrative management.
Accessibility, facilitating access to potential consumers to energy services in market
conditions.
Adaptation of technology, using energy resources in accordance with the conditions of
each region and the lowest cost alternative.
Co-financing, which is to encourage public and private funding for energy projects.
Sustainability, through the application of the principles of environmental conservation.
Despite commitments made by Bolivia at the international level to reverse the rates of
coverage in basic services until 2015, the millennium goals are far from being met.
In this context, the NGOs CINER (Bolivia), Mosoj Causay (Bolivia) and Engineers Without
Borders (Spain) promoted the "Andean Program for Rural Electrification and Access to
Renewable Energy” in Bolivia. This program was initiated by Engineers Without Borders
(Spain) in different countries of the Andean Community of Nations (CAN) that present a
common and problematic context. The program pursued Universal Access to sustainable
energy services, through capacity development and validation of appropriate technologies
for Andean environment. In 2005 the program began in Peru and Ecuador; next the program
was extended to the Andean region of Bolivia, which presents very similar geographical and
socioeconomical characteristics to the Andean areas of Peru and Ecuador. In this framework,
in 2007 CINER, Mosoj Causay and Engineers Without Borders developed actions related to
access to renewable energy in rural communities, extending the program to Bolivia to
implement the knowledge acquired in both countries, and to adapt it to the special
characteristics of Bolivia. The overall objective in Bolivia is to develop and disseminate
knowledge, as well as human and technological capabilities to initiate demonstration
projects, working with different stakeholders from the perspective of utilization of
renewable energy sources, and promoting and participating in the selection and
management of technology solutions.
Within the overall program, the project "Improving Access to Renewable Energy in Rural
Communities in Bolivia" aims to improve the quality of life of rural population by having
access to energy in remote areas through renewable energy. The specific objectives of this
project were:
1. To improve technical and management capabilities of the Bolivian plateau for access to
the energy in the population, local governmental bodies and other stakeholders.
2. To increase access to efficient and sustainable energy through improved use of biomass
and the production of electricity through renewable energy sources.
The actions were carried out with specialists in social and technological issues to promote
that users, through processes of participation and training, learn to manage, to maintain and
to make sustainable their energy systems. These actions will contribute improving their
level of human development, life expectancy, increasing opportunities for women, and
access to education for children and adults, protecting natural environment through more
friendly family economies. All the actions were performed jointly with the efforts of the
beneficiaries - in coordination with the municipal government.
Specifically, this paper examines the interventions in the municipalities of Turco and
Challapata led by Engineers Without Borders, CINER and Mosoj Causay, with the
collaboration of both municipal governments, the financing of the Spanish Agency for
International Development (AECID) and the Government of Navarra (Spain). Within the
Experiences of Community Wind Electrification
Projects in Bolivia: Evaluation and Improvements for Future Projects
87
municipalities of Turco and Challapata, two communities were selected with 13 and 9
households, respectively, that were electrified with individual wind systems. The
electrification with renewable energy corresponded to the priorities and needs of the
beneficiary population; before running the project, beneficiaries considered the lack of
electric power as one of the main problems of both communities. The system installation
was completed in December 2009. A year later, an external evaluation was conducted to
analyze the performance and progress of the projects and it confirmed the level of
satisfaction of the beneficiaries of the renewable energy equipment.
This article aims to describe and evaluate two community projects on wind power
generation, both in technical and social aspects. These two examples provide lessons on
management models at the community level. Moreover, we analyze the alternative design
of projects that try to solve some of the drawbacks identified for the assessment of future
project designs and implementations. The experience in Bolivia has shown the interest and
willingness of rural indigenous populations to participate in electrification projects.
The remainder of this paper is organized as follows. Section 2 presents the economical
analysis of the communities. Section 3 explains the wind resource assessment and section 4
describes the electrification project. Section 5 presents the evaluation methodology and
section 6 presents the results and their analysis. Section 7 discusses alternative project
designs. Finally, Section 8 summarizes the conclusions.
2. Socioeconomical analysis of the communities
This section presents the socioeconomical characteristics of the two communities,
highlighting the differences between them. The purpose of this study was to analyze the
characteristics of communities and families: the economy, consumption and energy
demand, the level of organization, and individual and group capabilities. The instruments
used to collect the information include socioeconomical surveys to each family, interviews
with the local authorities and the representatives of the inhabitants, and a focus group with
local organizations. This study was a key first step in the design and development of the
management model with the administration.
2.1 Rural area in Bolivia
The household energy consumption in rural areas with no conventional energy supply is
dominated by the demand for cooking (89% of total energy consumption). Lighting,
communication (audiovisual, mobile, etc.) and other energy uses account for 11% of energy
demand. Although not large amounts, lighting (5%) and entertainment (2%) are key
demands to improve the quality of rural life and the integration of people through media.
Productive uses of energy in these families represent a marginal percentage of total
consumption; whenever they exist they are very specific, and must be analysed in particular
way.
The structure of economic costs of energy source in rural scattered communities is different
from population centers: batteries represent the largest amount of expenditure (34.3%),
followed by the consumption of diesel (20%), LPG (18.8%), kerosene (15.3%) and candles
(11.6%). In the highlands, average annual spending in U.S. dollars on traditional energy
sources is the lowest in the country with a total of $ 40 U.S. for the population in extreme
poverty.
Sustainable Growth and Applications in Renewable Energy Sources
88
Due to low income of people in remote rural areas, the ability to pay is weak. However the
amount of money previously used for the purchase of other energy sources (candles,
kerosene, batteries, gas, etc.) may now be used to cover the cost of the electricity service. It is
estimated that nearly all population strata might pay a US$ 2.5 monthly fee, considering that
the payment will be for more convenient energy services than those previously used. It is
noteworthy that the percentage of expenses for energy supply with respect to income is
higher when the income level is lower.
Some people have expressed their desire to obtain higher rates of public or international
cooperation funding for electrification systems; this is probably due to very welfare
practices developed by institutions in the past plans in these rural areas. However, it is
obvious the willingness of communities and families to finance their consumption in case of
having electricity. Moreover, it is worth to consider that making periodic payments for the
energy service is not a common practice; traditional energy sources were acquired on
specific occasions when families had available economic resources.
2.2 Area and population
The municipality of Turco is located in the western area of department of Oruro, in the
province of Sajama, at an altitude of 3860 m. Turco has an area of around 3873 km
2
, its
topography is flat and rugged, with a large flat surface combined with hills and low hills with
slopes of 5 to 15% and mountain slopes up to 60%. Most towns and villages of Turco are
located at altitudes ranging between 3738 and 4200 meters, the mountain range has peaks
reaching 5300 m. In general, the weather is cold, with annual mean minimum temperature of -
1.6 º C and maximum of 19.8 º C. Turco is characterized by two very distinct seasons: a dry
season from April to September and a rainy season between October and March.
On the other hand, the Municipality of Challapata belongs to the province of Avaroa, in the
south-eastern department of Oruro. Challapata has an area of around 3014 km
2
. The
municipality has a semi-rugged relief in the mountainous territory of the central plateau,
which stretches from north to south. Most towns and villages of Challapata are located
between 3700 and 4300 m. The municipality has a cold and dry weather with average
annual temperatures of around 4.4 º C in July and 11.6 º C in February, but sometimes can
drop to -10 º C in the cold months. The rainy season starts in October or November and runs
until March, and is characterized by heavy rains followed by periods of 10-20 days without
rain. The remaining months are dry season flows.
According to the national census of population and housing, in 2001 Turco has 3818
inhabitants, composed almost evenly of men and women and represented by young under
25 years that form nearly 50% of the population. However, the estimated population in 2009
was 3771 inhabitants, a slightly decrease is mainly explained by migration to the cities in
search of jobs and better opportunities. There are few major population centers and most
populations are small villages with few houses. The estimated density of the municipality is
0.98 inhabitants per km
2
. According to the 2001 census, the life expectancy at birth in the
municipality of Turco is 49.6 years. Challapata has a much larger population with 24370
inhabitants almost evenly distributed between men and women being 50% of the population
under 20 years. In contrast, in Challapata the population is increasing, it was estimated for
2009 a total of 27517 inhabitants. The density of the population of the municipality is 8.08
inhabitants per km
2
. According to the 2001 census, the life expectancy at birth in the
municipality of Challapata is 53.7 years.
Experiences of Community Wind Electrification
Projects in Bolivia: Evaluation and Improvements for Future Projects
89
The 2001 census data showed that the global literacy rate for the entire Turco municipality is
86.4% that is below the departmental average of 94.0%. The average years of study at the
municipality are 5.7. Women still are disadvantaged in their access to education, as an
example their illiteracy rate is 10.7%, while for men it has decreased to 4.2%. In the
municipality of Challapata the situation is even more limited, with the overall literacy rate
of 76.9% and the average years of schooling of 4.4.
The lack of permanent jobs and income security causes migration of the population of both
municipalities to larger towns and cities from the department of Oruro, other departments
of Bolivia, or even neighbouring cities of Chile. According to the Municipal Development
Program (PDM) of 2007, 7.48% of the population of Turco has emigrated temporarily or
permanently . This occurs more frequently among men (74.59%) from 10 to 50 years,
children and youth because of higher level studies and for jobs to supplement the family
income. In Challapata, according to the PDM 2002, the migration amounts to 29.21% of the
population.
2.3 Basic services
According to the laws of municipal management, basic services are under the responsibility
of municipal government. However, the municipality of Turco has not assumed
responsibility for developing municipal policies aimed to ensure the coverage of basic
services to the population, while the municipality of Challapata, has developed this task
with moderate success. It is clear that in both cases the resources are not sufficient to meet
the needs of the communities and, moreover, the operational capacity of the technical teams
of the municipalities is limited.
The attention of medical services is poor and does not cover the expectations of the
population. Firstly, the equipment they have is limited, and secondly, the treatment
provided by officials and health professionals to patients does not meet the desired quality.
In short, it is estimated that by 2007 there was approximately 1 doctor for 1909 people in the
municipality of Turco and 1 doctor to 2437 people in the municipality of Challapata. Most of
the population lives in communities of few houses that lack basic services; people must
travel long distances to reach education and health services.
According to the PDM (2007), communities, farms and other remote areas have no electricity
and rely on the use of kerosene or other methods of illumination at night. A study and
evaluation of future energy demand estimated it (to meet the needs of households) as about
180 Wh / household / day. This study assumed a rational and efficient use of the energy
and considered the power supply for each benefited the use of little appliances (radio,
television, etc.).
2.4 Economy
Given the predominantly rural characteristic of both municipalities, economic activity is
based on agriculture (99% of families according to the PDM 2007 in the case of Turco). Cattle
ranching hs two main purposes: sale and household consumption (to a lesser extent). Both
live animals and in meat as well as other products (portion of meat, fibber and leather for
processing before being marketed) are used for sale. Own consumption is complemented by
an interfamilial exchange. Marketing is carried out fortnightly and annual fairs especially in
urban centres. Agricultural activity is highly subject to climate risks, and therefore the
incomes of families are in constant insecurity, making families to diversify their economy by
Sustainable Growth and Applications in Renewable Energy Sources
90
engaging in minor or complementary activities, such as handicrafts. Agricultural production
is geared directly to consumption. Potato and quinoa are the products that are prevalent
among families in the municipality of Turco and barley in the case of Challapata.
2.5 Community organization and leadership
A community workshop in each municipality of Turco and Challapata was realized to know
the institutional actors in municipality that should be considered allies when designing in
the management model of the electricity service. These institutions are considered
depending on the area in which they operate, from the communal, municipal, provincial,
departmental, national and international levels. The participants of the workshop did not
identify all the institutions, but only those related to the Municipal Government and Ayllu,
the indigenous and original management and decision organization at community level.
Therefore, to complete the institutional landscape the PDM was used as well as observations
and findings in the towns.
3. Wind resource assessment
Since June 2010 Bolivia has a new Wind Atlas, which identifies the potential of wind
anywhere in the country, with the usable energy to generate electricity or direct use in a
mechanical way. The Atlas was commissioned by TDE (Transportadora de Energía –
nationalized by the Bolivian Government) and the World Bank to the consultancy 3 TIER
specialist on meteorological simulation models. The model was developed ased on
geological, topographic and satellite statistics over the past 30 years, and the results were
validated with records from weather stations in Bolivia.
The Atlas is based on data and maps on a platform of universal and indefinite access via the
Internet and through entities that have offered themselves as managers of the base
(www.3tier.com/firstlook). Bolivia Wind Atlas identifies areas of high potential use of wind,
as is the case of the Santa Cruz region, the provinces of North and South Lopez in Potosí, a
corridor between Santa Cruz, Cochabamba and La Paz, a northern-southern corridor
between the shores of Lake Titicaca, Oruro and west of the city of Potosí, where the project
area is.
Although the atlas gives an indication of interesting potential areas and communities, for
the study of the project it is necessary to carry out a detailed micro-scale wind resource
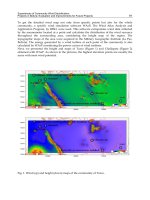
evaluation in the community. The first identification visits to Turco and Challapata and in
particular the communities of the project, confirmed that the area appears to have good
wind potential. Anemometers were installed to assess the wind resource in the communities
in 10 meters high towers. Given the dispersion of electrified homes, two anemometers were
installed in Turco (Figure 1), one in Iruni and one in Villacollo. Another anemometer was
installed in Challapata (Figure 2). Wind measurements were taken for over a year. To ensure
that generates enough electricity to meet demand throughout the year, wind resource
evaluation focused on the periods of the year with less wind resource. Thus, although the
energy generation varies along the year, the minimum generation to fulfil demand is always
met. The least windy month was March in Turco (in both anemometers) and April in
Challapata, with an average speed of about 2.5 to 3.5 m/s. This is the data considered in the
project design.