Sustainable Growth and Applications in Renewable Energy Sources Part 9 docx
Bạn đang xem bản rút gọn của tài liệu. Xem và tải ngay bản đầy đủ của tài liệu tại đây (1.26 MB, 20 trang )
Parameterisation of the Four Half-Day Daylight Situations
151
4681012
0
20
40
60
80
100
120
4681012
0
20
40
60
80
100
120
4681012
0
20
40
60
80
100
120
4681012
0
20
40
60
80
100
120
Illuminance in klx
Clock time
22
nd
September 2007
G
v
D
v
20
th
July 2006
G
v
D
v
Bratislava, clear days, 1 min data
8
th
April 2006
G
v
D
v
26
th
December 2006
G
v
D
v
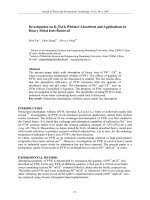
Fig. 1. Illuminance courses during clear morning situations 1
0 10203040506070
0.0
0.1
0.2
0.3
0.4
0.5
0.6
0.7
0.8
0.9
1.0
0 10203040506070
0.0
0.1
0.2
0.3
0.4
0.5
0.6
0.7
0.8
0.9
1.0
0 10203040506070
0.0
0.1
0.2
0.3
0.4
0.5
0.6
0.7
0.8
0.9
1.0
0 10203040506070
0.0
0.1
0.2
0.3
0.4
0.5
0.6
0.7
0.8
0.9
1.0
22
nd
September 2007
G
v
/ E
v
Solar altitude in deg
Bratislava, clear mornings, 1-minute data
20
th
July 2006
8
th
April 2006
26
th
December 2006
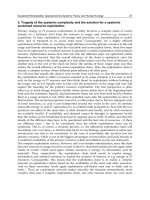
Fig. 2.
/
vv
GE courses under situation 1 after 1-minute measurements
Sustainable Growth and Applications in Renewable Energy Sources
152
0 10203040506070
0.0
0.1
0.2
0.3
0.4
0.5
0.6
0.7
0.8
0.9
1.0
0 10203040506070
0.0
0.1
0.2
0.3
0.4
0.5
0.6
0.7
0.8
0.9
1.0
0 10203040506070
0.0
0.1
0.2
0.3
0.4
0.5
0.6
0.7
0.8
0.9
1.0
0 10203040506070
0.0
0.1
0.2
0.3
0.4
0.5
0.6
0.7
0.8
0.9
1.0
Bratislava, clear mornings, hourly data
G
v
/ E
v
Solar altitude in deg
22
nd
September 2007
20
th
July 2006
8
th
April 2006
26
th
December 2006
Fig. 3.
/
vv
GE courses under situation 1:after measured hourly averages
0 10203040506070
1
10
0 10203040506070
1
10
0 10203040506070
1
10
0 10203040506070
1
10
22
nd
September 2007
T
v
Solar altitude in deg
40
20
th
July 2006
8
th
April 2006
26
th
December 2006
Bratislava, clear mornings, 1-minute data
Fig. 4.
v
T courses under situation 1: after 1-minute measurements
0 10203040506070
1
10
1
10
1
10
0 10203040506070
1
10
22
nd
September 2007
Solar altitude in deg
20
th
July 2006
Bratislava, clear mornings, hourly data
T
v
8
th
April 2006
26
th
December 2006
40
Fig. 5.
v
T
courses under situation 1: after measured hourly averages
Parameterisation of the Four Half-Day Daylight Situations
153
It has to be noted that during sunrise and early morning hours the prevailing daylight is
caused by skylight and therefore also on clear days the early
/
vv
GE values are equal or
quite close to
/
vv
DE while under higher solar altitude the /
vv
PE component is rising
while
/
vv
DE value fluently decreases after Fig. 6 from roughly 0.5 to 0.1. The average
hourly decrease is slightly distorting this range showing approximately 0.4 to 0.1
respectively (Fig. 7).
0 10203040506070
0.0
0.1
0.2
0.3
0.4
0.5
0.6
0.7
0.8
0.9
1.0
0 10203040506070
0.0
0.1
0.2
0.3
0.4
0.5
0.6
0.7
0.8
0.9
1.0
0 10203040506070
0.0
0.1
0.2
0.3
0.4
0.5
0.6
0.7
0.8
0.9
1.0
0 10203040506070
0.0
0.1
0.2
0.3
0.4
0.5
0.6
0.7
0.8
0.9
1.0
Bratislava, clear mornings, 1-minute data
22
nd
September 2007
D
v
/ E
v
Solar altitude in deg
20
th
July 2006
8
th
April 2006
26
th
December 2006
Fig. 6.
/
vv
DE courses under situation 1: after 1-minute measurements
0 10203040506070
0.0
0.1
0.2
0.3
0.4
0.5
0.6
0.7
0.8
0.9
1.0
0 10203040506070
0.0
0.1
0.2
0.3
0.4
0.5
0.6
0.7
0.8
0.9
1.0
0 10203040506070
0.0
0.1
0.2
0.3
0.4
0.5
0.6
0.7
0.8
0.9
1.0
0 10203040506070
0.0
0.1
0.2
0.3
0.4
0.5
0.6
0.7
0.8
0.9
1.0
D
v
/ E
v
22
nd
September 2007
Bratislava, clear mornings, hourly data
Solar altitude in deg
20
th
July 2006
8
th
April 2006
26
th
December 06
Fig. 7.
/
vv
DE courses under situation 1: after measured hourly averages
If simultaneous measurements of the zenith luminance is recorded under clear sky
conditions the classifying parameters
/
vz v
LD
, can identify the momentary sky type with
the fluent rising tendency dependent on the solar altitude. In Fig. 8 this tendency is shown
using 1-minute data while in Fig. 9 the same is documented after hourly mean values. Due
to rather constant and fluent trends during situation 1 besides the momentary one-minute
recordings also hourly averages and appropriate parameters are quite satisfactorily
reflecting clear half-days which might reduce the number of data considerably (Darula. &
Kittler, 2005a).
Sustainable Growth and Applications in Renewable Energy Sources
154
0 10203040506070
0.1
0.2
0.3
0.4
0.5
0.6
22
nd
September 2007
L
vz
/ D
v
Solar altitude in deg
20
th
July 2006
8
th
April 2006
26
th
December 2006
Bratislava, clear mornings, 1-minute data
Fig. 8.
/
vz v
LDcourses under situation 1: after 1-minute measurements
0 10203040506070
0.1
0.2
0.3
0.4
0.5
0.6
L
vz
/ D
v
Solar altitude in deg
8
th
April 2006
20
th
July 2006
Bratislava, clear mornings, hourly data
22
nd
September 2007
26
th
December 06
Fig. 9.
/
vz v
LDcourses under situation 1: after measured hourly averages
It is evident that the time period close to sunrise is untrustworthy due to an interval when
solar altitude is zero and average
/
vv
GE ratios are also reduced due to close to horizon
mist or high turbidities. The minute courses are intersected by the hourly level in the point
of hourly average solar altitude after Kittler & Mikler (1986)
where H
1
, H
2
are consecutive hours
12
180 12
arcsin sin sin sin sin cos cos
12 12
sH
HH
rad, (16)
Sunrise hour
sr
H
when
0
s
is for any location and date defined by
1
arccos tan tan
15
sr
H
[h], (17)
and due to symmetry around noon the hour of sunset
ss
H = 24 -
sr
H and the astronomically
possible sunshine duration
ahd
S
during a half-day is
Parameterisation of the Four Half-Day Daylight Situations
155
1
arccos tan tan
15
ahd
S
[h]. (18)
This is an normalising amount to calculate relative sunshine duration during the half-
day
hd
s
if the true measured sunshine duration in hours
hd
S
is available:
hd
hd
ahd
S
s
S
-. (19)
In the half-day system relative sunshine duration during the morning half-day is
hd m
ss
while its afternoon relative duration is
hd a
ss
either in absolute values or % respectively.
If regular minute recordings are measured, then
hd
S
can be calculated as the sum of all data
after the WMO (1983) and CIE 108 (1994) when the direct irradiance
e
P
120 W/m
2
taken
in hours or their decimals.
Situation 2: Cloudy half-days with possible foggy short periods are characterised by
scarce and lower sunlight influences under a range of relative sunshine durations
( 0.03 0.75s and 10 6Us
) and relatively higher diffuse illuminance levels. Such
situations are caused by the prevailing area of the sky covered from almost
homogeneous presence of clouds layers with different combinations of cloud type,
turbidity and cloud cover overlayed in their height positions and movement drifts.
Therefore, usually their
v
G courses are close to
v
D levels and so are also ratios /
vv
GE
and
/
vv
DE typical for situation 2.
To document cloudy half-days were chosen from the Bratislava data again seasonally
typical cases, i.e. a summer day 3
rd
June 2007, an autumn day on 5
th
September 2007, a
cloudy winter morning on 20
th
December 2006 and a spring morning on 5
th
April 2006. The
measured half-day courses of global horizontal illuminance
v
G and diffuse sky illuminance
v
D are recorded in local clock time again in Fig. 10. In early morning hours under cloudy
conditions
/
vv
GE and /
vv
DE are almost the same as is not so noticeable from the winter
course of illuminances, but evident in Fig. 11 in 1-minute or in Fig. 12 in the hourly
alternative compared with Fig. 13 and 14. In this cloudy case the
/
vv
GE and /
vv
DEvalues
is very high reaching 0.25 to 0.6 level indicating a very bright but sunless winter half-day
which is indicated also by the
v
T lower values compared with all other cloudy samples (in
Fig. 15 and 16) as well as in rather horizontal range of
/
vz v
LD parameters in Fig. 17 and
especially their averages in Fig. 18 with the data spread within the values 0.2 to 0.38 close to
overcast sky (Darula & Kittler, 2004b).
Due to cloudiness overlays and turbidity changes rather high values of
v
T factors have to be
expected usually dependent on the solar altitude as shown in Fig. 15 or 16. However, within
the half-day courses momentary unstable
v
P can occur, thus there are cases also with higher
average relative sunshine durations during the half-day in the range 0.1 to 0.5, but seldom
over 0.5 with lower sunlight intensities, which are usually indicated by smaller peaks within
the half-day course. These drab sunlight influences are documented by the small differences
between
/
vv
GE and /
vv
DE values when comparing Fig. 12 and 14 respectively.
Situation 3: Overcast half-days are absolutely without any sunlight and are caused by
either dense layers of Stratus or Altostratus cloudiness or inversion fog when the sun
Sustainable Growth and Applications in Renewable Energy Sources
156
position is uncertain as it cannot be seen or guessed behind the overall dense clouds.
Under such conditions
v
G =
v
D , 0
v
P
and average relative sunshine duration during
the half-day 0.03s
. While the
v
D illuminance levels and the ratio /
vv
DEare quite
low, usually in the range 0.02 - 0.25, the ratios
/
vz v
LD are over 0.3 and stable during
the half-day, i.e. without any dependence on the solar altitude (Darula & Kittler, 2004c).
Under overcast sky conditions when sunbeam influences are absent the sky luminance
patterns in all azimuth directions are uniform, so only gradation luminance distribution
can cause the
v
D illuminance rise from sunrise to noon.
Fig. 10. Illuminance courses during cloudy morning situations 2
0 10203040506070
0.0
0.1
0.2
0.3
0.4
0.5
0.6
0.7
0.8
0.9
1.0
0 10203040506070
0.0
0.1
0.2
0.3
0.4
0.5
0.6
0.7
0.8
0.9
1.0
0 10203040506070
0.0
0.1
0.2
0.3
0.4
0.5
0.6
0.7
0.8
0.9
1.0
0 10203040506070
0.0
0.1
0.2
0.3
0.4
0.5
0.6
0.7
0.8
0.9
1.0
Bratislava, cloudy mornings, 1-minute data
5
th
September 2007
G
v
/ E
v
Solar altitude in deg
3
rd
June 2007
5
th
April 2006
20
th
December 2006
Fig. 11.
/
vv
GE courses under situation 2: after 1-minute measurements
Parameterisation of the Four Half-Day Daylight Situations
157
0 10203040506070
0.0
0.1
0.2
0.3
0.4
0.5
0.6
0.7
0.8
0.9
1.0
0 10203040506070
0.0
0.1
0.2
0.3
0.4
0.5
0.6
0.7
0.8
0.9
1.0
0 10203040506070
0.0
0.1
0.2
0.3
0.4
0.5
0.6
0.7
0.8
0.9
1.0
0 10203040506070
0.0
0.1
0.2
0.3
0.4
0.5
0.6
0.7
0.8
0.9
1.0
Solar altitude in deg
5
th
September 2007
G
v
/ E
v
3
rd
June 2007
5
th
April 2006
Bratislava, cloudy mornings, hourly data
20
th
December 2006
Fig. 12.
/
vv
GE
courses under situation 2: after measured hourly averages
0 10203040506070
0.0
0.1
0.2
0.3
0.4
0.5
0.6
0.7
0.8
0.9
1.0
0 10203040506070
0.0
0.1
0.2
0.3
0.4
0.5
0.6
0.7
0.8
0.9
1.0
0 10203040506070
0.0
0.1
0.2
0.3
0.4
0.5
0.6
0.7
0.8
0.9
1.0
0 10203040506070
0.0
0.1
0.2
0.3
0.4
0.5
0.6
0.7
0.8
0.9
1.0
Bratislava, cloudy mornings, 1-minute data
5
th
September 2007
D
v
/ E
v
Solar altitude in deg
3
rd
June 2007 5
th
April 2006
20
th
December 2006
Fig. 13.
/
vv
DE
courses under situation 2: after 1-minute measurements
0 10203040506070
0.0
0.1
0.2
0.3
0.4
0.5
0.6
0.7
0.8
0.9
1.0
0 10203040506070
0.0
0.1
0.2
0.3
0.4
0.5
0.6
0.7
0.8
0.9
1.0
0 10203040506070
0.0
0.1
0.2
0.3
0.4
0.5
0.6
0.7
0.8
0.9
1.0
0 10203040506070
0.0
0.1
0.2
0.3
0.4
0.5
0.6
0.7
0.8
0.9
1.0
D
v
/ E
v
Solar altitude in deg
5
th
September 2007
Bratislava, cloudy mornings, hourly data
3
rd
June 2007
5
th
April 2006
20
th
December 2006
Fig. 14.
/
vv
DE courses under situation 2: after measured hourly averages
Sustainable Growth and Applications in Renewable Energy Sources
158
0 10203040506070
1
10
0 10203040506070
1
10
0 10203040506070
1
10
0 10203040506070
1
10
5
th
September 2007
Bratislava, cloudy mornings, 1-minute data
T
v
Solar altitude in deg
40
3
rd
June 2007
5
th
April 2006
20
th
December 2006
Fig. 15.
v
T courses under situation 2: after 1-minute measurements
0 10203040506070
1
10
0 10203040506070
1
10
0 10203040506070
1
10
0 10203040506070
1
10
5
th
September 2007
Bratislava, cloudy mornings, hourly data
T
v
Solar altitude in deg
40
3
rd
June 2007
5
th
April 2006
20
th
December 2006
Fig. 16.
v
T
courses under situation 2: after measured hourly averages
Fig. 17.
/
vz v
LDcourses under situation 2: after 1-minute measurements
Parameterisation of the Four Half-Day Daylight Situations
159
0 10203040506070
0.1
0.2
0.3
0.4
0.5
0.6
0 10203040506070
0.1
0.2
0.3
0.4
0.5
0.6
0 10203040506070
0.1
0.2
0.3
0.4
0.5
0.6
0 10203040506070
0.1
0.2
0.3
0.4
0.5
0.6
Solar altitude in deg
5
th
September 2007
5
th
April 2006
20
th
December 2006
Bratislava, cloudy mornings, hourly data
L
vz
/ D
v
3
rd
June 2007
Fig. 18.
/
vz v
LDcourses under situation 2:after measured hourly averages
To document overcast half-days by Bratislava recordings again four seasonal examples were
chosen, i.e. a winter morning on the 23
rd
January 2001 and a spring case on 3
rd
March 2001, an
exceptional summer half day on 4
th
June 2001 and an autumn case on 6
th
September 2007. The
half-day courses of measured global and diffuse illuminances in 1-minute intervals are in Fig.
19 with the
//
vv vv
GEDE analysis in Fig. 20 in 1-minute and in Fig. 21 in hourly
alternatives. All four cases document the low and stable efficiency of penetration in the range
0.05-0.2 without any dependence on the solar altitude. The same stable and independent trend
shows also the
/
vz v
LD courses in Fig. 22 and 23 within the average range 0.3-0.4.
Fig. 19. Illuminance courses during overcast morning situations 3
Sustainable Growth and Applications in Renewable Energy Sources
160
0 10203040506070
0.0
0.1
0.2
0.3
0.4
0.5
0.6
0.7
0.8
0.9
1.0
0 10203040506070
0.0
0.1
0.2
0.3
0.4
0.5
0.6
0.7
0.8
0.9
1.0
0 10203040506070
0.0
0.1
0.2
0.3
0.4
0.5
0.6
0.7
0.8
0.9
1.0
0 10203040506070
0.0
0.1
0.2
0.3
0.4
0.5
0.6
0.7
0.8
0.9
1.0
6
th
September 2007
Bratislava, overcast mornings, 1-min data
G
v
/ E
v
Solar altitude in deg
3
rd
March 2001
4
th
June 2001
23
rd
January 2001
Fig. 20.
/
vv
GE
courses under situation 3: after 1-minute measurements
0 10203040506070
0.0
0.2
0.4
0.6
0.8
1.0
0 10203040506070
0.0
0.2
0.4
0.6
0.8
1.0
0 10203040506070
0.0
0.2
0.4
0.6
0.8
1.0
0 10203040506070
0.0
0.2
0.4
0.6
0.8
1.0
6
th
September 2007
G
v
/ E
v
Solar altitude in deg
3
rd
March 2001
Bratislava, overcast mornings, hourly data
4
th
June 2001
23
rd
January 2001
Fig. 21.
/
vv
GEcourses under situation 3:after measured hourly averages
0 10203040506070
0.1
0.2
0.3
0.4
0.5
0.6
Bratislava, overcast mornings, 1-minute data
6
th
September 2007
L
vz
/ D
v
Solar altitude in deg
4
th
June 2001
3
rd
March 2001
23
rd
January 2001
Fig. 22.
/
vz v
LD courses under situation 3: after 1-minute measurements
Parameterisation of the Four Half-Day Daylight Situations
161
0 10203040506070
0.1
0.2
0.3
0.4
0.5
0.6
Bratislava, overcast mornings, hourly data
6
th
September 2007
L
vz
/ D
v
Solar altitude in deg
4
th
June 2001
3
rd
March 2001
23
rd
January 2001
Fig. 23. /
vz v
LD courses under situation 3: after measured hourly averages
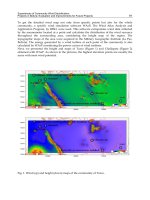
Situation 4: The dynamic courses in horizontal illuminance levels happen during those
half-days when the clear sky is covered by smaller cloud patches passing the sun
position and shade direct sunlight in many short-term intervals or moments. Thus the
overall
v
G course trends can be usually kept but with many drops of temporary loss or
reduction of
v
P components, which mean dynamic variations between
v
G and
v
D
levels. Because
v
D levels are not affected by the
v
P changes, /
vz v
LD ratios indicate
the sky patterns when the zenith luminance is not influenced by passing clouds
significantly. However, dynamic changes are reproduced also in
/
vv
GE and /
vv
PE
courses. In case of dynamic situations it is problematic to use hourly averages which are
levelling the momentarily occurring peaks and drops replacing them by an even
horizontal line. Thus is also distorted the wide range of
v
T values that have to be
expected in situation 4.
Due to the irregularity and occasional movement of the shading cloud patches there is a
multiple number of different cases, so the selection of characteristic courses is very
problematic. However, from Bratislava data were selected also four seasonal
representatives, i.e. for winter the morning on 12
th
January 2007, for spring 14
th
March 2001,
for the summer example the course on 29
th
June 2007 and for the autumn example was
chosen the dynamic morning on 26
th
November 2007. The actual global and diffuse
illuminance courses in Fig. 24 document the dynamic changes during the chosen half-days.
The same dynamic variations of
/
vv
GE parameters in minute representation are in Fig. 25
while hourly means erase the highest peaks and drops (Fig. 26) considerably. The
/
vv
DE
courses are relatively more stable and document the low borderline (Fig. 27 and 28) from
which additional sunlight influences the peaks. Similarly to G
v
/E
v
also L
vz
/D
v
courses are
very distorted in hourly averages in Fig. 30 in comparison to 1-minute fluctuating values in
Fig. 29, but the former indicate a tendency of the background spring and summer clear
skies. However, these background scene is also influenced by gradually increasing turbidity,
which is low with lower solar altitude and considerably rising when the sunheight is over 35
degrees (Fig. 31 and 32).
Sustainable Growth and Applications in Renewable Energy Sources
162
4681012
0
20
40
60
80
100
120
4681012
0
20
40
60
80
100
120
4681012
0
20
40
60
80
100
120
4681012
0
20
40
60
80
100
120
Bratislava, dynamics day
1 min data
Illuminance in klx
Clock time
26
th
November 2007
G
v
D
v
12
th
January 2007
G
v
D
v
14
th
March 2001
G
v
D
v
29
th
June 2007
G
v
D
v
Fig. 24. Illuminance courses during overcast morning situations 4
0 10203040506070
0.0
0.1
0.2
0.3
0.4
0.5
0.6
0.7
0.8
0.9
1.0
0 10203040506070
0.0
0.1
0.2
0.3
0.4
0.5
0.6
0.7
0.8
0.9
1.0
0 10203040506070
0.0
0.1
0.2
0.3
0.4
0.5
0.6
0.7
0.8
0.9
1.0
0 10203040506070
0.0
0.1
0.2
0.3
0.4
0.5
0.6
0.7
0.8
0.9
1.0
Bratislava, dynamic mornings, 1-minute data
26
th
November 2007
G
v
/ E
v
Solar altitude in deg
29
th
June 2007
14
th
March 2001
12
th
January 2007
Fig. 25.
/
vv
GEcourses under situation 4: after 1-minute measurements
Parameterisation of the Four Half-Day Daylight Situations
163
0 10203040506070
0.0
0.1
0.2
0.3
0.4
0.5
0.6
0.7
0.8
0.9
1.0
0 10203040506070
0.0
0.1
0.2
0.3
0.4
0.5
0.6
0.7
0.8
0.9
1.0
0 10203040506070
0.0
0.1
0.2
0.3
0.4
0.5
0.6
0.7
0.8
0.9
1.0
0 10203040506070
0.0
0.1
0.2
0.3
0.4
0.5
0.6
0.7
0.8
0.9
1.0
26
th
November 2007
G
v
/ E
v
Solar altitude in deg
29
th
June 2007
14
th
March 2001
Bratislava, dynamic mornings, hourly data
12
th
January 2007
Fig. 26.
/
vv
GEcourses under situation 4: after measured hourly averages
0 10203040506070
0.0
0.1
0.2
0.3
0.4
0.5
0.6
0.7
0.8
0.9
1.0
0 10203040506070
0.0
0.1
0.2
0.3
0.4
0.5
0.6
0.7
0.8
0.9
1.0
0 10203040506070
0.0
0.1
0.2
0.3
0.4
0.5
0.6
0.7
0.8
0.9
1.0
0 10203040506070
0.0
0.1
0.2
0.3
0.4
0.5
0.6
0.7
0.8
0.9
1.0
26
th
November 2007
Bratislava, dynamic mornings, 1-minute data
D
v
/ E
v
Solar altitude in deg
29
th
June 2007
14
th
March 2001
12
th
January 2007
Fig. 27.
/
vv
DEcourses under situation 4: after 1-minute measurements
0 10203040506070
0.0
0.1
0.2
0.3
0.4
0.5
0.6
0.7
0.8
0.9
1.0
0 10203040506070
0.0
0.1
0.2
0.3
0.4
0.5
0.6
0.7
0.8
0.9
1.0
0 10203040506070
0.0
0.1
0.2
0.3
0.4
0.5
0.6
0.7
0.8
0.9
1.0
0 10203040506070
0.0
0.1
0.2
0.3
0.4
0.5
0.6
0.7
0.8
0.9
1.0
26
th
November 2007
D
v
/ E
v
Solar altitude in deg
29
th
June 2007
Bratislava, dynamic mornings, hourly data
14
th
March 2001 12
th
January 2007
Fig. 28.
/
vv
DEcourses under situation 4:after measured hourly averages
Sustainable Growth and Applications in Renewable Energy Sources
164
0 10203040506070
0.1
0.2
0.3
0.4
0.5
0.6
0 10203040506070
0.1
0.2
0.3
0.4
0.5
0.6
0 10203040506070
0.1
0.2
0.3
0.4
0.5
0.6
0 10203040506070
0.1
0.2
0.3
0.4
0.5
0.6
Bratislava, dynamic mornings, 1-minute data
26
th
November 2007
Solar altitude in deg
29
th
June 2007 14
th
March 2001
12
th
January 2007
L
vz
/ D
v
Fig. 29.
/
vz v
LDcourses under situation 4: after 1-minute measurements
Fig. 30.
/
vz v
LDcourses under situation 4: after measured hourly averages
0 10203040506070
1
10
0 10203040506070
1
10
0 10203040506070
1
10
0 10203040506070
1
10
26
th
November 2007
Bratislava, dynamic mornings
1-minute data
T
v
Solar altitude in deg
40
29
th
June 2007
40
14
th
March 2001
12
th
January 2007
Fig. 31.
v
T courses under situation 4: after 1-minute measurements
Parameterisation of the Four Half-Day Daylight Situations
165
0 10203040506070
1
10
0 10203040506070
1
10
0 10203040506070
1
10
0 10203040506070
1
10
26
th
November 2007
Bratislava, dynamic mornings
hourly data
T
v
Solar altitude in deg
40
29
th
Jun 2007
14
th
March 2001
12
th
January 2007
Fig. 32.
v
T
courses under situation 4:after measured hourly averages
4. Approximate dependence of the four daylight situations on relative
sunshine duration
In the paper by Kittler & Darula (2002) a P-D-G diagram was published to show Bratislava
5-minute data covering the whole July 1996. From 5315 cases were 3113 with sunshine while
2202 measured cases were without sunshine according to the WMO (1983) classification. The
monthly relative sunshine duration after 1-minute recordings was in July 1996 on the
average
s 0.52 with daily changes within the range 0.022 – 0.946 which indicates the
possibility of half-day situations in all four categories. Due to the averaging distortion it
would seem that the prevailing sunny 5-minute intervals 3113/5315 indicate the sunshine
duration roughly 0.586.
The review of daily measured illuminance courses representing July 1996 by 62 half- days
can be classified into:
-
situation 1 approximately 9 morning courses and 7 in the afternoon half-day,
-
situation 2 only 2 morning courses and 2 in the afternoon half-day,
-
situation 3 only 2 morning courses and 1 in the afternoon half-day,
-
situation 4 the prevailing 18 morning and 21 afternoon half-days.
It is evident that neither the number of sunshine or sunless cases within a month in a P-D-G
diagram nor
/
vz v
LD and /
vv
GE time-averaged ratios are capable to differentiate the half-
day situations when data are summarised during a day, a week or month in these mixed
groups. Therefore the first step to identify, select or classify the half-day situations is to
check the overall courses of
v
G and
v
D illuminance trends and levels and their relative
efficiencies compared to the momentary extraterrestrial availability levels expressed in
/
vv
GE and /
vv
DE ratios. Of course the stable or discontinuous sunshine duration follows
the changes in
/
vv
GE and the momentary presence of /
vv
PE ratios indicating the
penetration of available extraterrestrial sunshine intensity. These half-day courses roughly
characterise also the range of prevailing sky luminance patterns that can be expected and
principally belong to the particular half-day situation. While situation 1 and 3 and
sometimes even 2 are approximately homogeneous with evenly distributed turbidities and
cloudiness cover over the whole sky vault, the situation 4 is characteristic for its unstable
dynamic illuminance changes caused by complex layers of different cloud types and
Sustainable Growth and Applications in Renewable Energy Sources
166
distribution as well as patch movements. Thus under situation 4 can happen locally many
accidental variations between quite low turbidity pockets with white-blue sky background
through which direct sunshine temporarily can reach the ground while in other intervals the
cloud patches cover and shade the sun beam penetration considerably.
Under homogeneous atmospheric conditions the
/
vz v
LDratio is quite a safe indicator of the
sky luminance pattern, but during the dynamic half-day the zenith luminance as well as the
sun position are influenced by passing clouds or cloud patches in several following
sequence intervals.
However, for general practice and local characterisation of daylight conditions year-round long-
term data are needed and should be locally available. Daylight data are also measured at the
CIE IDMP stations or can be taken from the satellite database. In this respect besides global
irradiation recorded in short-term variability or hourly averages at ground meteorological
stations or recalculated from satellite measurements, only relative sunshine duration in daily or
monthly averages have a very long tradition and are evaluated in many stations world-wide.
When inspecting monthly graphs of daily illuminance courses it becomes obvious that
especially during winter and summer seasons typical weather patterns last for several days
with changes either during night-time or noon. Even during perfectly clear days the
symmetry around noon seems to be broken by higher turbidity in afternoon hours caused
by water vapour evaporated due to rising air temperature and sunshine. Furthermore, in
equatorial climate have to be expected changes in cloud cover at around noon, i.e. frequent
mostly clear mornings and hours before noon but rather cloudy afternoons. During the
Slovak-Greek cooperation simultaneously collected data at the CIE IDMP stations in
Bratislava and Athens could serve to compare four half-day situations occurring in the
temperate climate of Central Europe to those in the Mediterranean region (Darula et al.,
2004). Available data was gathered during relatively long period 1994-1999.
The whole set of measured data was used to analyse the relation between sunshine duration
and daily courses of illuminance. Relative sunshine duration with standard deviation SD
for four typical situations were investigated in number with respect to their sequence of
occurrence and results are documented in Table 1. Symbol
s is relative sunshine duration
calculated for the whole day while
sm is for the morning period when local clock time was
less than 12 o´clock and
sa for the afternoon relative sunshine duration when local clock
time was from 12 hours to sunset.
Except for the rapid change from overcast to clear all possible changes from morning to
afternoon situations were found during the long-term of six years, i.e. 2182 days or 4364
half-days. The average relative sunshine duration corresponds perfectly with the change
from the morning situation to the afternoon one respecting the tendency of the following
situation change.
Although the half-day characteristics and their sequences in one or few days can form a typical
year simulation, within this span any time subdivision can be utilised, i.e. Bratislava 1-minute
data or Bratislava and Athens 5-minute average data can serve for analysis and comparison
studies of several descriptor interrelations. However, to reach an absolute symmetry in half-
days due to perfect noon time all measured momentary or average values are to be recalculated
from local clock time in which these were recorded to true solar time. Of course, it has to be
realised that because the daytime span between sunrise and sunset is changing during the year
as well as with the local latitude the relative time of a half-day element is not constant.
Parameterisation of the Four Half-Day Daylight Situations
167
Situation sequence
Number
of cases
s
sm sa
Morning Afternoon
Average
SD Average
SD Average SD
Clear Clear 175 0,917 0,034 0,967 0,031 0,849 0,034
Clear Cloudy 87 0,796 0,091 0,944 0,054 0,586 0,131
Clear Overcast
4 0,506 0,027 0,868 0,032 0,003 0,004
Clear Dynamic
70 0,818 0,094 0,941 0,037 0,655 0,165
Cloudy Clear 9 0,649 0,148 0,512 0,185 0,839 0,038
Cloudy Cloudy 128 0,261 0,224 0,265 0,220 0,254 0,208
Cloudy Overcast
201 0,049 0,074 0,082 0,080 0,000 0,001
Cloudy Dynamic
38 0,200 0,122 0,109 0,097 0,324 0,153
Overcast Clear 0 - - - - - -
Overcast Cloudy 53 0,056 0,055 0,003 0,003 0,134 0,108
Overcast Overcast
311 0,002 0,002 0,003 0,003 0,000 0,000
Overcast Dynamic
34 0,096 0,065 0,004 0,003 0,219 0,128
Dynamic Clear 90 0,753 0,154 0,690 0,220 0,841 0,035
Dynamic Cloudy 160 0,383 0,208 0,467 0,227 0,267 0,210
Dynamic Overcast
72 0,149 0,140 0,257 0,201 0,001 0,002
Dynamic Dynamic
750 0,504 0,219 0,536 0,252 0,462 0,205
Sum of cases 2182
Table 1. Statistical parameters of typical courses in Bratislava, 1994 -1999
Anyhow it can be assumed that in simulation programs of a daylight reference year the half-
day sequences or changes will allow to model in series of about sixty cases during a specific
month either the fluent and gradual or sudden changes in weather or sky types corresponding
to the probability of occurrence with its proportionality to monthly averages of relative
sunshine duration. At least the mentioned four half-day daylight situations have to be foreseen
for modelling the complex sun-sky coexistence with cloudiness patterns in any daylight
climate, although typical cases were selected only from measurements collected in Athens and
Bratislava. A research report (Darula et al., 2004) contains the detail analysis with proposals of
several parameters to identify the four relevant situations from measured half-day illuminance
courses and the daily average relative sunshine duration. It is evident that the stable and
homogeneous
situation 1 and situation 3 can be defined by the s instead of sm and sa. However,
the dynamically changing illuminance courses had to be identified and classified or selected to
situation 1, situation 2 or situation 4 by introducing an additional U parameter. Thus
situation =
10.75<7,
2 <0.75 <7,
3 <0.01,
40.017,
if s and U
if s and U
if s
if s and U
, (20)
where
U
=
1
1
1
ln
1
ii
i
xx
n
, (21)
and
i
x and
1i
x
are consecutive illuminance values in the half-day course.
Sustainable Growth and Applications in Renewable Energy Sources
168
Using these classification parameters all four daylight types are interrelated by a fluent course
of half-day average
/
vv
GE and /
vv
DE dependent on the half-day sunshine duration as
documented in Fig. 33 and 34 containing all 1994 morning and afternoon data recorded in
Bratislava and in Athens first. In the second step a more detail separation of half-day situations
dependent on half-day relative sunshine duration was made for morning 1994 data (Fig. 35)
and afternoon (Fig. 36) in relation to
/
vv
GE parameter repeated for also /
vv
DEand
/
vv
PE
with the best fit simulation of their dependence on the half-day relative sunshine duration.
However, as most frequently are available only monthly relative sunshine durations in
meteorological station reports the probability of occurrence of the morning and afternoon half-
day situations was sought first for 1994 data (example in Fig. 37 for situation 1) and checked for
1991-2001 data. Thus best fit probability for the monthly redistribution simulation of morning
and afternoon situations 1 to 4 were predetermined solely dependent on the monthly relative
sunshine duration using curves in Fig. 38 for morning half-days or in Fig. 39 for afternoons
(Darula et al., 2004 and Darula & Kittler, 2005b).
0.00.10.20.30.40.50.60.70.80.91.0
0.0
0.1
0.2
0.3
0.4
0.5
0.6
0.7
0.8
0.9
Best fit with R = 0,955:
G
v
/ E
v
= 0,182+1,038 s - 1,385 s
2
+ 0,883 s
3
Morning and afternoon 1994 data
Half-day average G
v
/ E
v
Half-day sunshine duration
Fig. 33. Morning and afternoon
/
vv
GE data after Bratislava and Athens measurements
during 1994
0.00.10.20.30.40.50.60.70.80.91.0
0.0
0.1
0.2
0.3
0.4
0.5
0.6
0.7
0.8
0.9
1.0
Best fit with R = 0.72:
D
v
/ E
v
= 0.182+0.693 s - 0.759 s
2
+ 0.126 s
3
Morning and afternoon 1994 data
Half-day average D
v
/ E
v
Half-day sunshine duration
Fig. 34. Morning and afternoon
/
vv
DE data after Bratislava and Athens measurements
during 1994
Parameterisation of the Four Half-Day Daylight Situations
169
0.00.10.20.30.40.50.60.70.80.91.0
0.0
0.1
0.2
0.3
0.4
0.5
0.6
0.7
0.8
0.9
1.0
Athens 1994 data for clear mornings
G
v
/ E
v
= 0.182 + 1.038s - 1.385s
2
+ 0.883s
3
Dynamic
Overcast
Morning Bratislava data 1994 in half-days:
Cloudy
Clear
Half-day average G
v
/ E
v
Half-day sunshine duration
Fig. 35. Morning data for four half-day situations
0.0 0.1 0.2 0.3 0.4 0.5 0.6 0.7 0.8 0.9 1.0
0.0
0.1
0.2
0.3
0.4
0.5
0.6
0.7
0.8
0.9
1.0
Dynamic
Half-day average G
v
/ E
v
Half-day sunshine duration
Afternoon Bratislava data 1994 in half-days:
Overcast
Cloudy
G
v
/ E
v
= 0.182 + 1.038s - 1.385s
2
+ 0.883s
3
Clear
Athens 1994 data for clear afternoons
Fig. 36. Afternoon data for four half-day situations
The probability of occurrence of each of the four daylight situations in each month can be
approximately estimated
-
for morning half-days by:
23
1 100 0.55 0.95 1.65Pm s s s %, (22)
except if s 0.93, then 1Pm = 100
if s = 0 - 0.5, then
2 100 1.5 1.85Pm s s %, (23)
if s = 0.5 - 0.93, then
2 66.86 0.93Pm s
%, (24)
if s 0.93 2 0Pm
%, (25)
2.47
31001Pm s %, (26)
Sustainable Growth and Applications in Renewable Energy Sources
170
4 100 1 2 3Pm Pm Pm Pm
%, (27)
-
for the afternoon half-days by:
23
1 100 0.62 0.77 1.26Pa s s s %, (28)
except if s 0.97, then 1Pa = 100
if s = 0 - 0.5, then
2 100 1.2 1.6Pa s s %, (29)
if s = 0.5 - 0.93, then
2 46.51 0.93Pa s
%, (30)
if s 0.93 2 0Pa
%, (31)
2.7
3 100 1Pa s %, (32)
4 100 1 2 3Pa Pa Pa Pa %. (33)
0.0 0.1 0.2 0.3 0.4 0.5 0.6 0.7 0.8 0.9 1.0
0.0
0.1
0.2
0.3
0.4
0.5
0.6
0.7
0.8
0.9
1.0
afternoon
Clear sky conditions - Type 1
during half-days
Bratislava 5-mi data, 1994
morning
Probability of occurrence in %
Monthly relative sunshine duration s
Athens 5-mi data, 1994
morning
Pm1 = 0.55s - 0.95s
2
+ 1.65s
3
Pa1 = 0.62s - 0.77s
2
+ 1.26s
3
afternoon
Fig. 37. Relation of clear situation to monthly relative sunshine duration in Bratislava and
Athens