Sustainable Growth and Applications in Renewable Energy Sources Part 17 pptx
Bạn đang xem bản rút gọn của tài liệu. Xem và tải ngay bản đầy đủ của tài liệu tại đây (508.79 KB, 20 trang )
Analysis of Time Dependent Valuation of Emission Factors from the Electricity Sector
311
Se
p
tember
October
TDV NGHGIF
A
(
g
of CO2/kWh)
TDV NGHGIF
A
(
g
of CO2/kWh)
Hour 2004
2005
2006
Hour
2004
2005
2006
1
137.1
195.8
138.8
1
207.5
159.8
144.3
2
125.9
190.5
127.7
2
192.9
149.6
136.0
3 116.4
184.4
118.3
3
182.2
142.8
127.4
4 117.4
182.9
120.8
4
185.0
143.9
131.5
5 129.8
191.0
138.8
5
205.8
165.5
154.0
6 162.9
202.9
164.1
6
241.3
187.5
175.2
7 199.0
212.5
183.0
7
274.1
203.7
189.4
8 221.9
224.8
201.7
8
290.1
216.6
203.0
9 229.7
232.4
215.0
9
290.6
223.7
210.3
10 243.3
234.8
220.1
10
295.2
228.1
217.1
11
250.6
238.4
222.1
11
298.7
232.1
221.7
12
255.9
243.5
222.5
12
300.3
235.1
223.1
13 257.0
245.6
222.0
13
303.1
234.4
222.5
14 257.5
244.6
216.8
14
300.9
234.1
222.2
15 255.8
245.0
212.9
15
296.7
233.6
220.3
16 259.2
240.4
213.7
16
295.3
235.0
220.9
17 260.5
239.0
214.2
17
294.9
233.9
219.1
18 255.1
237.1
211.0
18
291.3
228.6
215.3
19 248.3
231.7
209.0
19
294.0
228.9
219.0
20 261.5
238.1
217.9
20
293.6
228.3
217.4
21
251.5
235.1
209.2
21
286.7
224.2
209.9
22
221.1
222.8
191.9
22
271.9
213.5
199.9
23 187.7
212.2
172.8
23
244.6
189.7
185.0
24 157.7
203.8
148.7
24
222.8
170.9
161.4
November
December
TDV NGHGIF
A
(
g
of CO2/kWh)
TDV NGHGIF
A
(
g
of CO2/kWh)
Hour 2004
2005
2006
Hour
2004
2005
2006
1 232.7
175.2
176.0
1
192.7
218.3
141.8
2
218.2
166.8
159.5
2
180.7
214.3
130.9
3
205.8
160.7
148.2
3
171.5
210.8
122.6
4 197.8
153.9
144.6
4
163.7
208.8
116.8
5 200.6
156.0
148.3
5
164.8
213.3
118.3
6 210.4
159.0
164.2
6
170.8
206.7
127.0
7 223.4
172.8
173.6
7
180.8
199.6
134.5
8 238.6
191.3
192.1
8
192.4
200.4
147.1
9 248.8
197.9
201.4
9
201.9
207.1
156.3
10 252.4
207.0
204.8
10
208.0
211.3
159.1
11 254.8
213.3
207.8
11
211.7
215.8
163.8
12
256.8
213.3
209.3
12
213.7
218.4
170.2
13
258.7
214.5
211.9
13
214.8
219.7
171.9
14 254.7
211.9
211.4
14
214.5
217.7
170.6
15 257.0
206.6
205.6
15
209.7
213.7
164.5
16 250.2
196.6
200.8
16
199.6
207.3
160.3
17 246.3
197.0
199.9
17
197.7
206.4
164.8
18 260.6
212.3
211.2
18
215.9
224.2
183.6
19 266.6
219.4
213.0
19
222.8
227.2
185.3
20 264.3
213.1
209.3
20
219.7
221.3
179.5
21 262.9
212.8
207.3
21
220.4
222.5
176.9
22
261.6
207.6
204.4
22
219.5
223.0
174.9
23
255.0
191.3
195.4
23
213.2
218.2
161.8
24 239.7
179.4
187.5
24
197.0
216.9
148.0
Table A-4. (Continued)
Sustainable Growth and Applications in Renewable Energy Sources
312
10. References
Environment Canada. (2006). Canada’s National Greenhouse Gas Inventory, Retrieved
from<
Gordon, C., Fung, A.S. (2009). Hourly Emission Factors from the Electricity Generation Sector – A
Tool for Analyzing the Impact of Renewable Technologies in Ontario.
Canadian Society
of Mechanical Engineers (CSME)
, Vol. 33, No. 1, (March, 2009), pp.105-118.
Guler, B., Ugursal, V.I., Fung, A.S, and Aydinalp, M. (2008). Technoeconomic Evaluation of
Energy Efficiency Upgrade Retrofits on the Energy Consumption and Greenhouse
Gas Emissions in the Canadian Housing Stock.
International Journal of Environmental
Technology and Management (IJETM)
, Vol. 9, No. 4, (2008), pp.434-444.
Intergovernmental Panel on Climate Change (IPCC). (1997). National Greenhouse Gas
Inventory, Retrieved from
< shtml >
MacCracken, M. (2006). California’s Title 24 & Cool Storage.
ASHRAE Journal Vol. 48, (2006).
Ontario Power Generation. (2006). Sustainable Development Report (2004, 2005, 2006),
Retrieved from< >
Tse H., Fung A., Siddiqui O., Rad F. (2008). Simulation and Analysis of a Net-Zero Energy
Townhome in Toronto,
Proceedings of 3rd SBRN and SESCI 33rd Joint Conference,
Fredericton, August and 2008.
15
Photovoltaic Conversion: Outlook at the
Crossroads Between Technological Challenges
and Eco-Strategic Issues
Bouchra Bakhiyi
1
and Joseph Zayed
1,2
1
Department of Environmental and Occupational Health,
Faculty of Medicine, University of Montreal
2
Institut de Recherche Robert-Sauvé en Santé et en Sécurité du Travail (IRSST),
Canada
1. Introduction
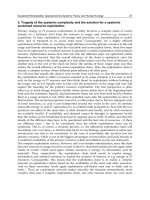
Photovoltaic (PV) conversion or the production of electricity directly through the use of
solar energy (Fig. 1) is undoubtedly a promising source of renewable energy despite the
negligible position it still holds in the global energy landscape, namely barely 0.2% of the
global electricity produced in 2010 (European Photovoltaic Industry Association [EPIA],
2011a; British petroleum Global [BPG], 2011).
In fact, it is difficult not to take its breathtaking growth into consideration since the
production of PV electricity increased from 1 TWh in 1999 to 50 TWh (40 GW) in 2010, for an
annual increase of 36% with a spectacular leap of 50% between 2009 and 2010 (Observ’ER,
2010; EPIA, 2011; BPG, 2011). Various hypotheses predict a global capacity between 131 GW
and 196 GW in 2015 (EPIA, 2011). In comparison, from 1999 to 2009, wind energy increased
29% whereas fossil energy only grew 3.7% (Observ’ER, 2010).
Therefore, it is not surprising that the term “solar revolution” was already in use in the
field of renewable energy as of 2006 (Bradford, 2006). However, although PV conversion
is a credible and preferred candidate as a safe source of energy in the highly probable
context of mixed energy and sustainable development, it remains marginal and there are
legitimate questions concerning its development, which is still in the very early stages,
particularly with respect to performance, production costs and competitiveness. It should
be noted that fossil energies still satisfy 80% of the global demand for electricity
(Observ’ER, 2010).
The purpose of this chapter is to assess both the performance of PV conversion, in economic
and energetic terms, in a favourable global market and the intense research into the use of
innovative technologies to improve performance. These assessments require an excursion
into the life cycle of PV systems from the synthesis of semi-conductors to the use of the
electricity generated, the storage of the energy and finally on to the dismantling and
recycling of facilities.
The development of PV systems, from the design to the end of their life, is accompanied by
environmental, health and safety concerns related to the expansive use of potentially toxic
Sustainable Growth and Applications in Renewable Energy Sources
314
materials. Logically, the assessment of the life cycle of PV systems will raise concerns about
their compatibility with the global approach of sustainable development in terms of
ecological footprint, economic profitability and social acceptability. Social acceptability is
even more fundamental in terms of the sustainability since the user should adopt a less
traditional energy approach. Will solar energy, which is perceived as the future of
renewable energies, be able to challenge of meeting the essential concepts of clean and green
energy?
Fig. 1. Diagram of Photovoltaic Conversion and Practical applications
Photovoltaic Conversion: Outlook at the Crossroads
Between Technological Challenges and Eco-Strategic Issues
315
2. Genesis and context of solar energy use
Although the history of solar energy dates back to the earliest days of humanity, its
evolution has been extremely slow and laborious, swinging between euphoria, aborted
attempts, total disinterest and re-birth. The first time this resource was used in prehistoric
times, namely when the rays of the sun were captured and used to kindle flames, apparently
took place in Mesopotamia, in the Arabic desert.
The ancient Greeks were the first to describe the famous “burning mirrors” or solar
reflectors, the ancestors of parabolic mirrors, created with silver, copper or brass, which
were used to light the Olympic flame (Butti & Perlin, 1980). In addition, solar energy was
used by the ancient Greeks in a passive form which had a major impact on the architecture
of homes since, even in that distant time, deforestation was an issue, resulting in a shortage
of charcoal as a result of the unchecked use of this fuel for heating and cooking.
The Roman Empire quickly adopted similar architectural habits since the Romans were also
suffering from an over-consumption of charcoal. Outrageous taxes were even imposed for
the domestic use of wood (Butti & Perlin, 1980). In 1515, Leonardo da Vinci attempted to
build a giant mirror, a primitive solar concentrator, intended to transform the rays of the
sun into heat for commercial purposes (Butti & Perlin, 1980; Lhomme, 2004). It would only
be during the Industrial Revolution of the 19th century that the solar energy pioneers would
emerge in a universe suddenly filled with scientific and technological effervescence in order
to improve energy performance and eliminate dependency on wood and charcoal.
However, these efforts, while praiseworthy and ingenious, were only partially successful.
One of the most brilliant and prolific of these pioneers was Augustin Mouchot, the French
inventor of the first solar engine in 1880. Despite his scientific fervour and his obvious
desire to demonstrate the potential of solar energy, he failed to draw France into the Solar
Age (Butti & Perlin, 1980). William Adams improved on Mouchot’s prototype by installing a
group of mirrors to boil the water to a faster way and doing his utmost to demonstrate the
great potential of solar energy for the British Empire (Bradford, 2006). John Ericsson,
invented the “caloric” engine in 1833, which used hot air as the operating fluid; this air was
provided by a solar engine, thereby limiting energy losses (Butti & Perlin, 1980; Bradford,
2006). These pioneers provided the basis of thermodynamic solar energy, by transforming
the rays of the sun into energy.
In 1839, Edmond Becquerel first observed the PV reaction, which involves the creation of a
spontaneous electrical current when a chain of conductive elements was lit. The first solar
batteries, ancestors of modern solar cells, used selenium and were developed in 1883 by
Charles Fritts. At that time, they had an efficiency of 0.2% (Lhomne, 2004). In 1921, Albert
Einstein explained the PV effect that earned him the Nobel Prize in physics. According to
history, Einstein considered the description of the PV effect of greater value than the theory
of relativity (Bradford, 2006).
Between 1900 and 1915, the first efforts were made to market thermodynamic solar energy.
Aubrey Eneas built and sold two immense machines to be used as boilers; they were
equipped with more than 1700 individual mirrors generating 2.5 steam horsepower.
Unfortunately, a major storm and hailstorm overpowered his inventions and forced him to
abandon any idea of pursuing this line of research as he concluded that his projects were not
economically viable (Butti & Perlin, 1980; Bradford, 2006). In 1912, Frank Shuman, one of the
greatest visionaries in matters of solar energy, built a plant in Egypt that was strangely
similar to modern solar power plants. Unfortunately, it was destroyed during the battles
Sustainable Growth and Applications in Renewable Energy Sources
316
that took place in Northern Africa during World War I. Moreover, the advent of fossil fuels,
with more affordable costs and better performances, ruined all efforts for the economic
existence of solar energy for close to 50 years.
In 1954, the idea of solar energy was revitalized as a result of the efforts of Gerald
Pearson, Calvin Fuller and Daryl Chapin, three researchers who developed the first
silicon solar cells with an initial efficiency of 6% which soon increased to 14% (Singh,
1998). The first commercial applications started in 1958 but these cells were essentially
used for space applications. Even though the terrestrial use of solar energy was slow, the
scientists and the public were enthusiastic (Goetzberger & Hoffman, 2005; Bradford, 2006;
Krauter, 2006).
The development of solar PV systems was strongly influenced at the outset by the price of
fossil fuels. Thus, the oil crisis of the 1970s and the sudden increase in the price of oil
revealed the precariousness of fossil energy resources and encouraged the solar industry.
As a result, the Solar Energies Research Institute was created in the USA and the first
subsidies were granted, injecting three billion dollars. In 1979, solar panels were installed
on the roofs of the White House, a gesture considered highly symbolic (Bradford, 2006).
Thermodynamic solar energy, however, declined in the 1970s and 1980s, for the benefit of
by PV energy (Vaille, 2009). At that time, the USA accounted for 80% of the solar market.
However, when the price of oil once again declined in the 1980s and the early 1990s, the
enthusiasm for solar energy dropped and the solar panels were removed from the White
House. Nevertheless, research into PV technologies continued, but was less sustained
(Bradford, 2006).
During the 1990s, the world became aware of the need to revise energy policies based on
sustainable development and concerns about climate change. Obviously, these issues
involved the consideration of the level of energy consumption as well as the
environmental consequences (such as greenhouse gas emissions, GHG) and the
precariousness of fossil resources (Bradford, 2006). Thus, more attention was paid to PV
solar resources.
This time, Europe took the lead in this industry which was predestined to flourish. Thus, of
the 40 GW of solar electricity generated in 2010, 30 GW were generated by the European
Union, of which 17 GW were produced by Germany. For the same year, Japan and the
United States trailed behind with 3.6 GW and 2.5 GW respectively (EPIA, 2011).
The applications of PV are incredibly diverse at present, ranging from small to large,
including solar calculators, irrigation pumps, the heating of single-family homes, and solar
facilities (roofs, facades, etc.) connected to the power grid (Labouret & Villoz, 2009;
Bradford, 2006). PV systems are interesting because they can also be installed in zones that
are completely devoid of electrical networks or energy infrastructures, particularly in certain
developing countries where the isolated segments intended for rural electrification are
experiencing a veritable boom (Singh, 1998). Current applications and future projections
differ by region since socio-economic concerns are dissimilar. Thus, in the developed
countries, future visions focus on the large-scale integration of PV energy in the urban
environment. The idea of a city as a gigantic PV power plant is germinating in peoples’
minds as they wait for a large-scale study on the potential environmental and social impacts
(Gaidon et al., 2009). In the developing countries, PV energy provides added value and is
becoming a symbol of progress and openness to the world, outside the outlying rural zones
that could enjoy the benefits (Singh, 1998).
Photovoltaic Conversion: Outlook at the Crossroads
Between Technological Challenges and Eco-Strategic Issues
317
3. Solar radiation: Geophysical considerations and energy potential
Located nearly 150 million km from Earth, the Sun is a huge nuclear power plant—the
oldest in the history of mankind—and has a capacity of 25 million kW/h per gram of
hydrogen, its main component. The nuclear fusion of one kg of hydrogen releases an
energy value of 8.3 million tons oil equivalent (Lhomme, 2004). Since the sun accounts
for some two billion tons of material, over 90% being hydrogen of which it uses
600 million tons per second, the energy produced is unimaginable. In fact, it produces 4 x
10
17
GW, or the equivalent of 400 million billion nuclear power plants! The Earth receives
only a tiny fraction of this energy (Centre National de Recherche Scientifique, n.d.;
Lhomme, 2004).
The major characteristics of sun energy, despite a certain ubiquity, are a large regional
disparity and more or less marked by seasonal imbalance. For instance, the average energy
received by Europe is 1,200 kWh/m
2
/y vs 1,800 to 2,300 kWh/m
2
/y in the Middle East
(EPIA/Greenpeace, 2011). Latitude, exposure and altitude are parameters that influence the
overall daily and seasonal radiation. Tropical regions corresponding to 25–30 degrees
latitude are sunnier compared to European countries above the 45-degree parallel.
Climatologists have long endeavoured to assess the solar energy of a given area as
thoroughly as possible and even be able to predict the evolution. Statistics on solar radiation
were therefore compiled from data collected to input into valuable databases
(EPIA/Greenpeace, 2011). Assembling data of a given region based on different criteria is
strategic for the design and dimensioning of PV systems, especially their orientations and
inclinations (Labouret & Villoz, 2009).
Characterization of increasingly sophisticated global solar energy resources is a sign of PVs’
promising potential. Thus the calculations by the International Energy Agency (US IEA)
lead to surprising conclusions. Installing PV systems on only 4% of the area of the world’s
driest deserts would likely be able to provide all of humanity’s primary energy needs
(EPIA/Greenpeace, 2011).
4. Technological aspects from solar energy to photovoltaic electricity
The PV effect consists in the direct conversion of solar energy into electricity (Fig.1). Three
interdependent and successive physical phenomena are involved: a) the optical absorption
of light rays, b) the transfer of the energy from the photons to the electrons in the form of
potential energy; c) the collection of the electrons excited in this manner so that they recover
their initial energy. The ideal converter is still the semi-conductor, since both the
conductivity and the collection method are both sufficient and efficient. However, there are
two major obstacles with respect to PV conversion. The first one is related to the photons
and electrons. In fact, not all the photons are absorbed and not all of the excited electrons are
collected. This impacts the energy performance of a semi-conductor, one of the key
parameters for the PV industry. In practical terms, the performance of a solar cell is the
maximum power produced, expressed in Watts-peak (Wp) and the higher the Wp is, the
better the performance of the cell is (Goetzberger & Hoffman, 2005 ; Labouret & Villoz,
2009). The other major obstacle is the price of the solar module. Development of the
technologies and the PV materials is continuing while the two goals are to increase energy
performance and reduce the cost of the Wp beneath the symbolic threshold of $1 US/Wp
(Krauter, 2006; Xakalashe & Tangstad, 2011).
Sustainable Growth and Applications in Renewable Energy Sources
318
The material currently used preponderantly in the design of PV cells is silicon, which is
abundant in nature, accounting for 90% of the global market for the production of the
modules. More than 80% of the silicon used is in crystalline form with an energy
performance between 14% and 22% for a solar cell, compared to 12%-19% once assembled in
modules (Labouret & Villoz, 2009; EPIA/Greenpeace, 2011; Xakalashe & Tangstad, 2011).
There are currently three generations of photovoltaic cells. Those referred to as the first
generation are made of crystalline silicon. The cells are provided in plates or wafers and
have to be made from very pure silicon, using a manufacturing process that is still very
onerous (Goetzberger & Hoffman, 2005; Labouret & Villoz, 2009; Jaeger-Waldau, 2010). The
price of the solar module based on first generation cells is estimated at close to $2 US/Wp
(Xakalashe & Tangstad, 2011; SolarServer, 2011).
The second-generation solar cells, so-called thin layer cells, require less material and should
cost less to design. Their development is more and more promising since their market share
grew from 5% in 2005 to 16%-20% in 2009. Their production capacity, estimated at about 10
GW in 2010, could grow to 20 GW in 2012 and 70GW in 2015 (Jaeger-Waldau, 2010). The
thin-layer solar cells include, first and foremost, amorphous silicon, with a very
uncompetitive performance of between 4% and 8% although the price per Wp is
advantageous, approximately $1.3 US in 2011 (EPIA/Greenpeace, 2011; SolarServer, June
2011). The second generation also includes other polycrystalline thin-layer films,
particularly those based on cadmium telluride (CdTe), copper indium selenide (CIS) and its
alloy copper indium gallium selenide (CIGS). The average performance of the CdTe cells is
between 8% and 10%. The price per Wp was $0.81 US in the first quarter of 2010 and at the
end of the same year, CdTe modules contributed to the production of almost 14% of the PV
solar electricity generated by thin-layer cells (Jaeger-Waldau, 2010).
In theory, the CIS and CIGs cells have the highest performance for thin-layer cells, which is
estimated at 20% in laboratory tests. However, the modules installed yield only 7% to 12%.
Nevertheless, this technology is in the early stages of development and the manufacturing
process is still complex, particularly since indium is a material that is in high demand in the
flat screen (LCD) industry, which makes its use in PV systems problematic (Labouret &
Villoz, 2009; EPIA/Greenpeace, 2011).
The objective set for the third generation cells is in the vicinity of 30% and these cells rely
on innovative technologies. This group includes primarily: a) multi-junction cells with a
thin layer of silicon or gallium arsenide combined with a solar concentrator, b) organic
polymer cells or poly-electrochemical cells, also called Grätzel cells; c)
thermophotovoltaic cells, primarily with an indium arsenide base (EPIA/Greenpeace,
2011). The multi-junctions, equipped with solar concentrators with a factor of up to 1000,
are by far the most performing, with a record performance of 35.8% announced in 2009.
However, the applications remain limited since they are confined to the space and
military fields (Chataing, 2009; Guillemoles, 2010). While the performances of the organic
cells are lower, from 8% to 12%, interest in such cells and particularly the Grätzel cells is
growing since the production costs are constantly declining with an interesting price
outlook estimated at $0.73 dollars US (0.5 Euros) per Wc in 2020 (Chabreuil, 2010;
EPIA/Greenpeace, 2011).
One of the emerging technologies in the field of PVs is nanotechnology, which uses
nanocrystalline particles or quantum dots, which would significantly increase the efficiency
of the conversion compared to conventional semi-conductors (Nozik et al., 2010). Current
Photovoltaic Conversion: Outlook at the Crossroads
Between Technological Challenges and Eco-Strategic Issues
319
research is focussing on the use of hybrid organic-inorganic cells with a great deal of load
mobility that uses cadmium selenide as the inorganic material (Freitas et al., 2010).
5. Practical applications
The solar modules consist of cells assembled in series, encapsulated between supports made
of tempered glass, a special Tedlar® type plastic or “solar” resin, and then framed. In order
to amplify their power, the modules may be grouped in voltaic panels or even voltaic fields
with power output ranging from 1 kWp (kilowatt peak) to more than 100 kWp (Antony et
al., 2010).
The two types of PV systems in use are autonomous (off-grid system) systems and those
connected to the public electrical network (on-grid system); they differ in terms of their finality
and the nature of their components. The electricity produced by the autonomous systems is
consumed on site whereas that generated by facilities connected to the network is intended to
fully or partially supply that network (Labouret & Villoz, 2009; Antony et al., 2010).
Moreover, there is a hybrid system, an intermediary and emerging form of the PV market
that allows connection to another source of energy. Efforts to combine sources of energy are
continuing particularly as a complementary source of energy although this type of system
remains complex, laborious and onerous (Goetzberger & Hoffman, 2005; Labouret & Villoz,
2009).
There are many applications for autonomous systems such as internal market for solar
gadgets (calculators, clocks, etc.), solar home systems and water pumps. These systems are
still a preferred solution for developing countries where more than two billion people are
not connected to an electrical network and have no hope of being connected to one someday
(Goetzberger & Hoffman, 2005; Labouret & Villoz, 2009). Nevertheless, despite their appeal
as sources of energy and their potential for development, these systems are still the source of
major concerns requiring intense consideration so as to ensure both their sustainability and
their wide-scale generalization in developing countries.
In this case, it would be possible to enhance their tangible added value in the global energy
landscape. First, apart from the internal market and “sun-related” applications such as
pumping or ventilation, the autonomous systems would have to include judicious storage
batteries in order to accumulate excess electricity, but these batteries are problematic. The
financing for the autonomous generators is the first negative element since, even if only
20%-30% of the initial investments are for storage, the reduced lifespan of the batteries
(batteries have to be replaced every 2, 5 or 10 years) results in a final cost that could amount
to 70% of the total costs (Labouret & Villoz, 2009).
It is a fact that the positive development of individual solar systems in the developing
countries is having pernicious effects since that easier access to electricity could lead to an
increase in the acquisition of electrical appliances and, consequently, to the overuse of
batteries, thereby reducing their lifespan (Goetzberger & Hoffman, 2005). Moreover, the
scarcity of training on autonomous systems, aggravated by the high rate of illiteracy in the
developing countries, could result in difficulties in maintaining the batteries which,
obviously, influences their durability. Thus, the integration of batteries, although essential
for autonomous systems, will have an impact on their costs, already high ($500 to $1500 US),
thereby handicapping, to a certain extent, their generalization in terms of rural
electrification in developing countries (Goetzberger & Hoffman, 2005; Labouret & Villoz,
2009).
Sustainable Growth and Applications in Renewable Energy Sources
320
The other issue with respect to autonomous systems concerns the nature of the batteries,
which are essentially lead-based. The lead battery has two disadvantages: the most
particular concern is the potential effect on public health and safety and its impact on the
environment, mainly resulting from the presence of lead, a toxic heavy metal. Concerns are
not only to the manufacture and handling of this type of battery but also to end-of-life
recycling (Vest, 2002).
6. Energy and economic performances
It is possible to evaluate the competitiveness of PV systems in terms of economic and energy
performances. The prominent economic parameters are the global cost of the PV systems
and the price of the solar energy generated while energy profitability is estimated in terms
of the Energy Pay-Back Time [EPBT] as well as the Energy Return Factor [ERF].
Two realities affect the photovoltaic market: a) growth has been spectacular in just a few
years and b) the price of the energy produced remains the most expensive (Aladjidi &
Rolland, 2010). Thus, when a price per Wp is announced, it only reflects the price of the
solar unit when it leaves the plant. The overall cost of the PV solar energy includes an entire
series of parameters, such as the cost of the initial investment, the operating lifespan of the
system, the energy performance during operation, the cost of maintenance and whether or
not storage batteries are integrated (Goetzberger & Hoffman; PVResources, 2011).
The crucial parameter that will condition price fluctuations is certainly the maturity of the
market, even more than the type of application for which the photovoltaic system is used.
Thus, countries such as Germany and Spain are considered, as a result of their precocious
commitment to the development of solar energy, the driving forces behind the growth of the
PV market (Labouret & Villoz, 2009).
The cost of the initial investment, depending on the power desired, includes several
elements, in particular the retail price of the unit and the various components of the
system, the feasibility study, planning, and the cost of installing the equipment. The
various components vary according to the type of system. Those connected to the
network, in residential segments on rooftops or facades or in solar fields, require more
assembly structures, a cabling system and eventually grounding work (EPIA/Greenpeace,
2011). On the other hand, in addition to storage batteries, autonomous systems include
load controllers which, although they represent only 5% of the initial investment, are
essential for protecting the systems against solar overloads and discharges (Labouret &
Villoz, 2009).
In 2009, the price of PV installations varied from 3.5 to 5 Euros/Wp for 1 Kw of power with
projections of 0.7-0.9 Euro/Wp in 2030 and even 0.56 Euro/Wp in 2050 (PVResources, 2011;
EPIA/Greenpeace, 2011). The price of the photovoltaic unit is the most important factor in
determining the cost of the initial investment. It is still rather high and is currently estimated
at between 40% and 60% of the total cost, depending on the technology used, although it has
decreased significantly over the past five years (EPIA/Greenpeace, 2011).
Since silicon dominates the PV market, the retail price of the units made using crystalline
silicon reflects fluctuations in the price of the raw material, which is closely related with the
production capacities of the industry. The spectacular overproduction of silicon noted in
2009, particularly as a result of the opening of an Asian PV market, although it destabilized
the supply and demand through the multiplication of the number of independent
producers, helped to remove the spectre of a silicon shortage (EPIA, 2011).
Photovoltaic Conversion: Outlook at the Crossroads
Between Technological Challenges and Eco-Strategic Issues
321
In addition to readjusting the silicon market as a condition for stability requiring the
consolidation of firms, the real issue with respect to reducing the price of the units involves
improving the manufacturing process through automation. Thus, major efforts should be
made to improve refining capacity, reduce the thickness of silicon wafers and increase
conversion performances through an equitable manufacturing process that respects specific
standards (Aladjidi & Rolland, 2010; EPIA/Greenpeace, 2011).
Although there are still good days ahead for silicon, the development of various
emerging technologies in the field of photovoltaics would necessarily have a most
beneficial effect since they would either use less silicon, as in the case of amorphous or
micro-crystalline cells, or they would use innovative materials other than silicon
(Aladjidi & Rolland, 2010).
The lifespan of the PV systems is a key parameter not only for the assessment of the overall
cost of the systems but also for estimating the EPBT and ERF. Most of the manufacturers of
PV units provide performance guarantees, namely a life span between 20 and 25 years at
80% of the minimum nominal power for both crystalline and cadmium telluride units, while
stating that this average would be a minimum estimate and not a definitive value since it
would be estimated at 40 years in 2020 (Labouret & Villoz, 2009; EPIA/Greenpeace, 2011).
The improvement in lifespan is both technological and technical in nature since it is closely
related to the stability of the PV systems in use elsewhere, which are negatively impacted by
a deterioration process that affects both the solar units, despite the encapsulation of the cells,
and the support frame. This degradation can result from the aging of the semiconductors,
the delamination or loss of adhesiveness between the solar cells and from the intrusion of
humidity. The fragility of the systems has a major impact on the energy performance during
operation. However, only few studies were done on the estimation of losses, while a
decrease in performance of 1%-2% per year was observed for some systems (Goetzberger &
Hoffman, 2005).
The cost of maintenance, including the ongoing control of the performance and the
appearance of the systems as well as their cleaning, remains low and is estimated to be
between 0.01 and 0.1 Euro/kWh (PVResources, 2011). However, integrating storage
batteries in the autonomous systems, which are characterized by a decrease in lifespan of a
factor of 2 for every 10 degrees Celsius as a result of corrosion, leads to a long-term increase
in the cost of the investment as seen earlier (Labouret & Villoz, 2009).
The average price of the solar electricity generated depends, among other things, on the
initial installation costs and the rate of sunshine and is estimated at 0.22 Euro/kWh in
Europe and remains, despite a significant decrease of 40% between 2007 and 2009, less
competitive than the electricity generated using fossil fuels, which is evaluated between 0.09
and 0.27 Euro/kWh (EPIA/Greenpeace, 2011). However, there is no shortage of programs
intended to make PV systems profitable, such as investment contributions (subsidy, green
loan), tax benefits (reduction, exoneration) and direct pricing support, including the
compensatory redemption rate systems in place in several European Union countries,
particularly Germany and Italy (Goetzberger & Hoffman, 2005).
Germany was the first country to implement a law giving priority to renewable energy and
has been a powerful driving force behind the development of PV programs. This law, and
others which have been based on it, establishes the right to inject solar energy into the public
network and to be reimbursed per PV kWh (EPIA/GREENPEACE, 2011; PVResources,
2011).
Sustainable Growth and Applications in Renewable Energy Sources
322
Photovoltaics consume necessarily energy throughout a system’s life cycle, i.e. during the
manufacturing of modules, their installation and, at the end of their useful life, disassembly
and recycling. The energy balance is defined by two common parameters: the EPBT,
meaning the time required for PV energy to repay its energy debt, and the ERF or how
many times the consumed energy is reproduced. These two parameters are determined by
the rate off sunshine, the purpose and design of the PV system, and the type of technology
(International Energy Agency-Photovoltaic Power Systems Program [IEA-PVPS], 2006;
EPIA/Greenpeace, 2011).
The energy balance is closely related to the lifespan of the systems. A 2006 study gives an
EPBT of between 1.6 and 3.3 years for systems installed on roofs and 2.7 to 4.7 years for
those integrated into facades. The ERF, estimated for a business life of 30 years, is between 8
and 18 for roofs and from 5.4 to 10 for facades (IEA-PVPS, 2006). Data collected in 2009 for
systems integrated into roofs in southern Europe indicate an EPBT of nearly 1.75 years for
systems that use silicon cells, except for silicon ribbon, which is estimated at just over one
year. Thin film technologies remain effective with nearly 0.7 years for cadmium telluride
systems (EPIA/Greenpeace, 2011), which was adjusted to 0.7 to 1.1 years by the Held team
from Germany (Held & Ilg, 2011).
Preliminary results related to commercial applications for solar concentrators present an
EPBT of 0.8 to 1.9 years (Wild-Scholten et al., 2010). It appears that the silicon wafer industry
is highly energy intensive and that the development of thin-film technologies, which require
few materials, would be more compatible with an energy gain reducing the EPBT,
maximizing the ERF and consequently optimizing the energy efficiency (Wild-Scholten et
al., 2010; EPIA/Greenpeace, 2011).
However, a low EPBT does not always equate low energy efficiency and this finding makes
perfect sense when applied to autonomous systems, which are of great use in developing
countries. These systems are somewhat not considered in these calculations since few
studies reinforce this reality, except one with an EPBT of 3.5 to 6 years due to the presence of
storage batteries that must be regularly renewed and excess energy during periods of strong
sunlight (Kaldellis et al., 2010).
These energy assessment calculations include the end-of-life recycling of systems. Although
the first large-scale PV applications were installed in the 1990s, increasing growth of the
market will require that more systems be disassembled and recycled. Once disassembled, in
terms of waste to be treated, PV modules represent about 2,300 t in 2007, over 7,500 t in 2011
and a forecast of 132,000 t in 2030 considering average annual growth of 17%. Silicon
modules currently represent over 80% of this waste. But if trends in thin film and emerging
technologies continue, by 2030 they could account for over 65% of waste generated (Sander
et al., 2007).
The era of waste collection and recycling PVs is still in its infancy despite voluntary
measures in the PV industry (PVCycle, 2011) and the ongoing search for more efficient
recycling techniques, both energy and economic, for all types of modules (Radziemskai et
al., 2010). The recent integration of PV in the Waste Electrical and Electronic Equipment
(WEEE) directive (Council of European Commission, 2011a) is only a first step and a strong
legislative framework underpinned by sustained efforts is required in order to structure PV
waste management, generalize the most competitive recycling processes for all system
components, including batteries, and make them applicable to the extent of PV installations
worldwide (PVCycle, 2011).
Photovoltaic Conversion: Outlook at the Crossroads
Between Technological Challenges and Eco-Strategic Issues
323
7. Life cycle of photovoltaic systems and ecological footprint
As a result of the accelerated growth of the PV industry, a rigorous assessment of the
environmental impacts of the systems has become necessary, conducted through a life cycle
assessment (LCA) integrating all of the manufacturing, operating, collection and waste
recycles. The LCA is an orderly process that analyzes the input/output impact of the PV
industry from the “cradle to grave”, with the inputs referring to the materials and energy
consumed and the outputs illustrated by greenhouse gas (GHG) type emissions and solid
and liquid waste.
A form of environmental management that is as exhaustive as possible, the LCA is a series
of tools and techniques for which the ultimate objective, beyond the descriptive and
quantitative aspect of the environmental profile, is to reinforce the sustained effort to limit
the environmental impacts in a context of sustainable development (Fthenakis et al., 2005a;
IEA-PVPS, 2011). The key factor that will determine the pertinence and the credibility of the
LCA will be the voluntary and transparent cooperation of the manufacturers with respect to
the accurate and full disclosure of the various inputs/outputs (Fthenakis et al., 2005a;
Stoppato, 2008; IEA-PVPS, 2009; Ecoinvent , 2010; IEA-PVPS, 2011).
In addition to the energy considerations previously illustrated by the calculation of the
EPBT and the ERF, the parameter most frequently estimated for the LCA assessment is the
ecological footprint describing and quantifying the entire greenhouse gases (GHG) released
during the lifespan of the PV system and expressed in carbon dioxide equivalents per kWh.
The environmental gain expected by the reduction of GHG related to the operation of PV
electricity has also to be taking into account. These two assessments are always determined
in comparison with the emissions attributed to fossil energies (Fthenakis et al., 2005a; IEA-
PVPS, 2011).
The estimate of the GHG attributed to PV systems is an increasingly complex exercise since
it includes criteria that are as diversified as the technology used, the choice of
manufacturing processes and the type of energies consumed, the techniques for assembling
the cells and units, the power generated, the transportation of raw materials and the
finished product, the components required for the installation of the units (Balance Of
System/BOS) as well as the recycling processes. The BOS will, in turn, depend on the
applications, the dimensions, the orientations and, above all, the location selected (Krauter
& Rüther, 2004; Stoppato, 2008; Fthenakis & Kim, 2011; Reich et al., 2011).
A major distinction is acknowledged between indirect emissions, which concern the overall
energy, electricity included, needed to manufacture the units, and the direct emissions,
which concern all of the chemical compounds, raw materials included, that are involved in
the manufacturing process and are a potential source of GHG (Reich et al., 2011). It is
essential to point out that the GHG emission estimates for PV systems are not absolute since
they are subject to a certain number of constraints, particularly the quality of the
information provided by the manufacturers involved throughout the life cycle. Thus, the
estimates are subject to future revisions as are the EPBT and ERF calculations (Reich et al.,
2011; Held & Ilg, 2011).
With respect to the direct emissions of the silicon industry, three critical phases are
identified: the development of metallurgical-grade silicon from silica, its transformation into
solar-grade silicon and the development of a structure and framework in the form of panels.
While the production of metallurgical-grade silicon requires the consumption of roughly 14
kWh per kg of metallurgical-grade silicon whole releasing 3 tons of CO
2
equivalents for one
Sustainable Growth and Applications in Renewable Energy Sources
324
ton of metallurgical-grade silicon, the solar-grade silicon stage is by far the most energy
consuming, with 150 kWh per kg obtained (Miquel, 2009) or 1190 MJ/panel (0.65 m
2
)
(Stoppato, 2008).
Assembling the panels with an aluminum frame also consumes energy, ranging between 53
and 245 kWh with emissions varying between 15 and 19 kg CO
2
-eq, all per kg of aluminum
consumed (Krauter & Rüther, 2004). Overall, the estimation of GHG emissions for silicon
panel manufacturing is variable as shown in table 1.
The silicon technologies release also GHG directly, with the primary sources being the raw
material itself, the various fluoride compounds involved in the manufacturing process as
well as the incineration of the plastic used to encapsulate the solar cells, one of the common
processes in the recycling of plastic materials. According to the estimates, the emission is
virtually negligible, about 0.16 g CO
2
-eq/kWh for the raw material, whereas the incineration
of plastic would be a source of 1.1 g (Reich et al., 2011).
Emission estimates
(g CO
2
-eq/kWh)
Reference
15-25
EPIA/Greenpeace, 2011
30-45
Fthenakis & Alsema, 2006; Fthenakis et al., 2008
43-73
Weisser, 2007; Miquel, 2009
148-187
Stoppato, 2008
Table 1. GHG emissions for silicon panel according to different authors
The fluoride compounds remain the Achilles heel of silicon cells since they have an even
higher Global Warming Potential (GWP). CO
2
, methane and the nitrogen oxides have GWPs
of 1, 23 and 296. There are also issues with respect to CF
4
(carbon tetrafluoride), SF
6
(sulphur
hexafluoride), C
2
F
6
(hexafluoroethane) and above all NF
3
(nitrogen trifluoride) for which the
GWPs range from 7,400 to more than 17,000 (Fthenakis et al., 2010; Miquel, 2009). Despite
this fact, these fluoride compounds, excluding SF
6
, are not included in the Kyoto protocol
whereas NF
3
is considered to be the gas with a significant environmental impact (Prather &
Hsu, 2008).
Concerning the thin layer technology and, more specifically, the cadmium telluride
(CdTe) technology, the small amount of data available relies on a certain number of
parameters such as the geographic location of the facility, the conditions at the site of the
installation and, certainly, the type of databases used. The information about the recycling
procedures has a particular impact on the calculation, as for all of the technologies, but
the recycling process is in the experimental stage since the CdTe market is still relatively
young (Held & Ilg, 2011). From 18 to 20 g CO
2
-eq/kWh (Fthenakis & Kim, 2005;
Fthenakis, 2009) the estimates are currently being revised slightly upwards (Held & Ilg,
2011).
The autonomous PV systems include, in their calculations, the emissions generated by the
storage batteries and eventually those caused by the diesel generators integrated in most of
the hybrid systems. Taking into account the 1.26 kg CO
2
-eq released per kg of batteries
produced, the cost of transportation and maintenance, and based on an operating life of
more than 20 years, the individual systems, namely solar home systems (SHS), with a power
of 15 Wp release an average of 160 kg CO
2
-eq whereas SHS with a power of 50 Wp release
650 kg (Posorski et al., 2003).
Photovoltaic Conversion: Outlook at the Crossroads
Between Technological Challenges and Eco-Strategic Issues
325
Notwithstanding this disparate data, the GHG emissions of PV systems are well below those
of fossil energies as summarised in table 2. The overall production of electricity, all energy
sources combined, generates an average of 600 g CO
2
-eq/kWh, although this varies between
countries (Stoppato, 2008; EPIA/Greenpeace, 2011).
Energy system Average emission Reference
PV Systems 15-187 See references in Table 1
Coal 800 – 1280
Dones et al., 2003 ; Weisser,
2007; Evans; 2010
Oil 519-1200
Dones et al., 2003; Weisser,
2007; Evans; 2010
Natural Gas 360-991
Dones et al., 2003;
Jaramillo et al., 2007;
Weisser, 2007; Evans; 2010
Table 2. GHG emissions (g CO
2
-eq/kWh) resulting from different energy systems
Moreover, the ecological footprint may be evaluated in terms of environmental gains
resulting from the expected reduction in GHG caused by the use of PV systems. Based on
the principle that, once installed, the systems (with the exception of the diesel generators
and the transportation of maintenance services) do not emit GHG, it is possible to calculate
how many CO
2
-eq will be saved throughout their lifespan. Scenarios have been developed
to extrapolate this reduction with a forecast of 0.6 kg CO
2
-eq/kWh on average saved by the
extension of the systems connected to the network and taking into account emissions
(optimistic) of 12-25 g CO
2
-eq/kWh. Almost 4 billion tons of CO
2
-eq could be saved by 2050
(EPIA/Greenpeace, 2011).
As for the autonomous systems, 70% would experience a reduction of more than 200 kg of
CO
2
-eq per year, namely 6 tons of CO
2
-eq and 8.9 tons of CO
2
-eq for 15 and 50 Wp
systems respectively with a lifespan of more than 20 years (Posorski et al., 2003). The
projections go even further, considering that the implementation of PV plants in
developing countries, combined with a generalization of systems connected to the
network in order to supplement the hybrid systems and reduce emissions related to the
transfer of technology from the supplier country to the consumer country would be even
more beneficial in ecological terms with more than 26 tons of CO
2
-eq/kWh saved per site
implemented (Krauter, 2006).
8. Potential health effects
The photovoltaic industry, with its ambitious goal to provide clean electricity, paradoxically
uses materials and/or manufacturing processes that are not free from inherent potential
health and safety effects. The sector is therefore facing a dual objective: increase energy
efficiency and reduce or even abandon processes that use potentially toxic compounds.
Sustainable Growth and Applications in Renewable Energy Sources
326
Health concerns date back to the 1960s (Neff, 1979) and many frameworks have been
developed since. The integration of PV panels into the European Waste Electrical and
Electronic Equipment directive also shows awareness of PV systems potential toxic waste,
which is classified as electronic waste (Silicon Valley Toxics Coalition [SVTC], 2009; Council
of the European Union, 2011a). Legal frameworks such as the European REACH directive
(Registration, Evaluation, Authorisation and Restriction of Chemicals) have lent support to
the trend. As a whole and regardless of the technology, potential risks are a reality that must
be addressed thoroughly, without invoking the environmental benefits to delay the risk
assessments and possible adoption of mitigation measures.
The solar-grade silicon industry involves potential risks primarily during the manufacturing
phase. However, mining of quartz or sand, precursors of metallurgical-grade silicon, also
presents various risks mainly due to chronic exposure to crystalline silica dust, causing
diseases of respiratory and urinary systems, arthritis, scleroderma and even lung cancer
(International Agency for Research on Cancer [IARC], 1998; Yassin et al., 2005).
Developing solar-grade silicon from metallurgical-grade silicon through the Siemens
process, which is still the most common in the sector despite the existence of other non-
standardized techniques (Miquel, 2009), releases chlorosilanes especially silane gas and
silane tetrachloride (SiCl
4
). Silane gas is extremely explosive, which is potentially dangerous
both for workers and the community surrounding manufacturing sites. Fatal explosions
have been reported in Germany (1976), Taiwan (2005) and India (2007) (Ngai, 2010).
As for SiCl
4
, it is a potent eye and lung irritant that can also affect the central nervous
system. It reacts with water and can lead to skin burns and no carcinogenicity or
reproductive toxicity studies have been performed so far (Right To Know, 2010). This same
gas is the cause of various irritative symptoms observed in the residents of a Chinese village
in the Henan province, some 50 meters from a polycrystalline silicon cell plant (Cha, 2008).
Cutting solar-grade silicon ingots into plates exposes workers to silica dust (kurf) that can
induce breathing problems due to overexposure despite the use of protective masks (Yassin
et al., 2005). Other non specific chemicals are also involved in the manufacturing process
including sodium hydroxide, sulphuric acid or hydrofluoric acid, and pose potential risks to
workers.
It is therefore important for the following two priorities to be applied in order to adjust
the accelerated development of the market: a) review the manufacturing processes for
emission-reducing technology (abatement technologies), b) carry out or complete the
appropriate risk analyses of all potentially toxic compounds with great transparency from
manufacturers.
In terms of potential risks to public health, thin film technologies are no exception. The risks
are still poorly documented for copper indium selenide and its alloy copper indium gallium
selenide but two compounds that are particularly irritating to eyes and lungs are still being
handled, namely hydrogen selenide and selenium dioxide (Agency for Toxic Substances and
Diseases Registry [ATSDR], 2003). Indium is also problematic as it can induce various
diseases including lung cancer and reprotoxic and embryotoxic effects and remains without
a standard toxicological reference value (Nakano, 2009).
Technologies using cadmium telluride (CdTe) generate some controversy for two main
reasons: a) the presence of cadmium (Cd), a metal classified as a group 1 carcinogen by the
International Agency for Research on Cancer (IARC, 1997) and b) little documentation exists
about the extent of their particularly chronic potential toxicity (Norwegian Geotechnical
Photovoltaic Conversion: Outlook at the Crossroads
Between Technological Challenges and Eco-Strategic Issues
327
Institute [NGI], 2010). These concerns also include emerging CdTe and CdSe-based solar
nanotechnologies (Peyrot et al., 2009; Werlin et al., 2011).
The other element worth considering is the limited number of manufacturers using CdTe,
which limits the scope of studies based mainly on data supplied by the manufacturers. The
sector handling cadmium salts suffers from a confusion of nomenclature (Classification &
Labelling [C&L]) since the physical and chemical properties of Cd salts are quite different
from Cd just as the nanoparticles of cadmium salts differ from Cd salts in a thin layer
(Fraunhofer Institute, 2010; NGI, 2010).
However, this controversy does not seem to have influenced the Council of the European
Union, which will maintain exception concerning Cd use in PV modules in RoHS
(Restriction of Hazardous Substances) so that the ambitious targets set by the EU for
renewable energy and energy efficiency can be achieved (Council of the European Union,
2011b).
Nevertheless, current data attribute a lower acute toxicity to CdTe than to elemental Cd
(Zayed & Philippe, 2009). Toxicity studies of CdTe nanoparticles are contradictory and
inconclusive at this time although the nanocrystals’ small size would be a priori more
damaging thus high cytotoxicity is suspected (Su et al., 2010).
During the operation of CdTe solar panels, the risk of emission in case of breakage or fire
would be considered negligible (Steinberger, 1997, as cited in Nieuwlaar & Aselma, 1997;
Fthenakis, 2003; Fthenakis et al., 2005b, Raugei & Fthenakis, 2010). Optimistic findings
concerning the risk of CdTe emission in case of fire should be reviewed since, although
established according to standard procedures, they were provided on the basis of flame
temperatures between 750 and 900°C.
However, in building fires where temperatures in the thermal plume are between 600 and
1,000°C, those in the flame can reach 2,000°C (Fraunhofer Institute, 2010; Gay & Wizenne,
2010). Since the risk of emission in case of accident is not clearly defined, better protection of
workers responsible for installation and maintenance of PV systems is required.
The dismantling and recycling of PV systems can be problematic because of the potential
risks associated with handling hazardous toxic compounds, especially polybrominated
diphenyl ethers (PBDEs) used as flame retardants including inverters incorporated into
photovoltaic systems (SVTC, 2009). The potential toxicity of PBDEs such as the carcinogenic
risk due to bioaccumulation in the body is not yet clarified (ATSDR, 2004).
Other major health concerns inherent in the PV industry are to be considered in the tally of
potential risks to human health. These are the risks associated with manufacturing and
recycling processes for lead batteries, which involve handling a number of hazardous
compounds such as, in addition to lead, heavy metals harmful to the central nervous,
endocrine and cardiovascular systems, sodium nitrite, sulphur dioxide, arsenic and
sulphuric acid (Vest, 2002).
9. Environmental impacts
Throughout the life cycle, the PV industry can generate potentially toxic compounds, either
during normal production or during accidental situations that could be released into the
atmosphere, in solid or liquid effluents. The possible consequences would include
alterations in the quality of the air, the soil and the water, with potential impacts on biota
(Electric Power Research Institute, 2003; SVTC, 2009).
Sustainable Growth and Applications in Renewable Energy Sources
328
The vast majority of the studies on ecotoxicity and potential environmental impacts
essentially pertain to the plant manufacturing phases, whereas little data is available with
respect to the possible direct emissions or releases during operation as well as during the
dismantling, the processing of waste and the recycling of the solar panels.
In terms of atmospheric emissions, the principal pollutants are essentially sulphur oxides
(SOx), nitrogen oxides (NOx) and certain heavy metals such as arsenic, cadmium or
mercury (Fthenakis, 2009; SVTC, 2009). Table 3 compares the average SOx and NOx
atmospheric emissions from PV systems to those from various fossil fuels used to produce
electricity. The results provide eloquent evidence that PV systems are clearly
advantageous comparing to various fossil fuels. The data concerning PV systems varies
according to the technologies used, the energy performances of the solar cells, the
capacities of the systems, the impact assessment methods used and, therefore, the
databases used.
Energy system
SOx
(g/kWh)
NOx
(g/kWh)
References
Photovoltaic 0.05 to 0.36 0.025 to 0.34
Pehnt, 2006; Fthenakis et al., 2008;
Hatice & Theis, 2011.
Coal 5.2 to 12.0 1.3 to 4.5
Gagnon et al, 2002; Fthenakis et al.,
2008; Jaramillo et al., 2007; Hatice &
Theis, 2011.
Heavy fuel 1.1 to 8.0 0.5 to 1.5
Gagnon et al., 2002; Hatice & Theis,
2011.
Diesel generator 0.2 to 1.3 0.3 to 12
Gagnon et al., 2010; Hatice and
Theis, 2011.
Liquid or solid
natural gas
0.14 to 1.8 0.3 to 4.5 Jaramillo et al., 2007
Table 3. Average SOx and NOx atmospheric emissions associated with energy systems
The PV industry also produces ammonia emissions (NH
3
) and volatile organic compounds
(VOCs) (Pehnt, 2006; Fthenakis et al., 2010), but the existing data cannot be used to provide a
rigorous comparative assessment. If there is a stage that could be crucial for the PV industry,
it would be the end of the systems’ lifecycle. Indeed, this could be the source of
environmental and ecotoxicity concerns. In fact, the potentially toxic materials involved
throughout the life cycle could be found, as a result of a routine or accidental release, in the
solid and/or liquid effluents that could contaminate the soil and aquatic environments
(Electric Power Research Institute, 2003; SVTC, 2009).
The emerging technologies require just as much vigilance as a result of the shortage of
current ecotoxicological data, which would invite more refined investigations in the future
in order to keep up with the growing dynamics of the market. The cadmium-based PV
industry is specifically concerned since the current data seems to indicate that CdTe
nanoparticles have the potential of bioaccumulation in aquatic organisms (Peyrot et al.,
Photovoltaic Conversion: Outlook at the Crossroads
Between Technological Challenges and Eco-Strategic Issues
329
2009) and there is a possible bioamplification of CdSe nanoparticles (Werlin et al., 2011).
Overall, there is a consensus that the evaluations performed to date seem to give the PV
industry much more credit than fossil fuels, but the fragmentary nature of the results
indicate that more in-depth investigation is required.
10. Sustainable development: Issues and prospects
The current vitality of the photovoltaic sector is taking place in a context marked by the
need to review energy policies given both the increasing spectre and the growing number of
the obvious consequences of climate change. In fact, the current policies serve only to draw
sombre and unfavourable prognoses, resulting in particular from a lack of balance between
a high rate of energy consumption and a problematic supply of conventional fossil energies
associated with highly volatile prices and market instability (Bradford, 2006; Labouret &
Villoz, 2009).
The current concept of sustainable development is positioned as an enlightened response to
major concerns, based on the fact that it reconciles, inasmuch as possible, three parameters
which have been completely divergent to date: the economic efficiency, the social equity and
the socio-economic development and, finally, the preservation of the ecosystems. The
compromises sought through sustainable development require the implementation of
several complex actions focussed on a fundamental objective: to ensure a balance between
the energy offer and demand for current generations while respecting the resilience of the
biosphere. It is, therefore, a response to real, current concerns that could compromise the
wellbeing of future generations (International Union for Conservation of Nature, 2006).
Applied to the energy sector, such actions involve the implementation of strategies that are
essentially corrective in nature and are part of a dynamic process based on the guiding
principal of using renewable natural resources. Given this more functional vision and, based
on the economic, health, safety and environmental profiles of PVs, as assessed and
presented throughout the chapter, it is possible to provide an overall appreciation of the
extent to which the photovoltaic industry respects different principles of sustainable
development, inspired by those defined by the Ministry of the Environment of the Province
of Québec, Canada (MDDEP, n.d.). This assessment is based on the current state of
knowledge for an industrial sector extremely fertile in terms of technical and technological
developments.
Table 4 aligns the PV industry with several principles of sustainable development. It can be
considered as a barometer of human and equitable sustainable development. It also
summarizes the extent to which different principles of sustainable development are
respected. Although the results may be considered favourable, recommendations are issued
in order to enhance the respect for the various principles.
Despite the universality of the sun as a resource and the fact that it is inexhaustible and safe,
there are still many issues. Whether they are technical or technological, they will require a
solid political focussing on subsidy systems and financial accessibility, strong programs to
integrate photovoltaic systems in buildings, and administrative flexibility to ensure that the
sector is dynamic (Bradford, 2006; EPIA/Greenpeace, 2011).
Moreover, a major issue concerns the social acceptability of PV systems, not only as a source
of reliable energy but also as a system that can easily accompany daily life at a reasonable
cost, while being integrated into local architecture without major visual impacts.
Sustainable Growth and Applications in Renewable Energy Sources
330
Several
principles
Level of adherence Recommendations
Economic
efficiency
Average
Price of solar electricity
still not competitive.
To increase efforts in research and
development, standardization of
manufacturing procedures, more encouraging
redemption policies, better penetration of PV
systems, development of smart grids, long-
lasting batteries.
Health
and safety
Average to good
Possible accidents,
reduction of GHG, toxic
substances.
To increase occupational health and safety,
technological innovations, reduction even
elimination of potentially toxic compounds,
policy to reduce emissions and spills, emission
control, performance of exhaustive risk
analyses.
Quality
of life
Good to very good
No eco-visibility, good
integration in space.
To reduce hybrid systems using diesel
generators.
Precaution
Prevention
Average
Use of potentially toxic
components.
To refine the assessment of the life cycle.
Organization of the waste management and
recycling sector.
Subsidiarity/
delegation
Average
Administrative
processes still difficult.
To implement a one-stop-shop system to
facilitate administrative procedures.
Equity and
social solidarity
Average to good
Solar resource
ubiquitous; onerous
systems.
To generalize rural electrification in
developing countries.
Environmental
protection
Average to good
There is little
documentation about
certain emissions.
Technological innovation to limit the use of
fossil energy and raw materials, increased
contribution of manufacturers and better
organization of the photovoltaic sector.
Preservation of
biodiversity and
respect the
ecosystems
Average
Clearly advantageous
compared to fossil
energies, lack of data
about emissions, waste
and recycling.
Reduction of potentially toxic compounds,
more elaborate analyses of toxicological and
ecotoxicological risks.
Table 4. Aligning the photovoltaic industry with the principles of sustainable development
The informed acceptance of the public, including the public authorities, would have a
definitive impact on the decision-making powers (Hirschl, 2005). Information, awareness
raising and education would serve to optimize the understanding, reception and adaption
of PV systems.