Báo cáo hóa học: " Simultaneous measurements of kinematics and fMRI: compatibility assessment and case report on recovery evaluation of one stroke patient" potx
Bạn đang xem bản rút gọn của tài liệu. Xem và tải ngay bản đầy đủ của tài liệu tại đây (1.12 MB, 17 trang )
RESEARC H Open Access
Simultaneous measurements of kinematics and
fMRI: compatibility assessment and case report
on recovery evaluation of one stroke patient
Claudia Casellato
1
, Simona Ferrante
1
, Marta Gandolla
1
, Nicola Volonterio
1
, Giancarlo Ferrigno
1
, Giuseppe Baselli
2
,
Tiziano Frattini
3
, Alberto Martegani
3
, Franco Molteni
4
, Alessandra Pedrocchi
1*
Abstract
Background: Correlating the features of the actual executed movement with the associated cortical activations
can enhance the reliability of the functional Magnetic Resonance Imaging (fMRI) data interpretation. This is crucial
for longitudinal evaluation of motor recovery in neurological patients and for investigating detailed mutual
interactions between activation maps and movement parameters.
Therefore, we have explored a new set-up combining fMRI with an optoelectronic motion capture system, which
provides a multi-parameter quantification of the performed motor task.
Methods: The cameras of the motion system were mounted inside the MR room and passive markers were placed
on the subject skin, without any risk or encumbrance. The versatile set-up allows 3-dimensional multi-segment
acquisitions including recording of possible mirror movements, and it guarantees a high inter-sessions repeatability.
We demonstrated the integrated set-up reliability through compatibility tests. Then, an fMRI block-design protocol
combined with kinematic recordings was tested on a healthy volunteer performing finger tapping and ankle dor-
sal- plant ar-flexion. A preliminary assessment of clinical applicability and perspectives was carried out by pre- and
post rehab ilitation acquisitions on a hemiparetic patient performing ankle dorsal- plantar-flexion. For all sessions,
the proposed method integrating kinematic data into the model design was compared with the standard analysis.
Results: Phantom acquisitions demonstrated the not-compromised image quality. Healthy subject sessions showed
the protocols feasibility and the model reliability with the kinematic regressor. The patient results showed that
brain activation maps were more consistent when the images analysis included in the regression model, besides
the stimuli, the kinematic regressor quantifying the actual executed movement (movement timing and amplitude),
proving a significant model improvement. Moreove r, concerning motor recovery evaluation, after one rehabilitation
month, a greater cortical area was activated during exercise, in contrast to the usual focalization associated with
functional recovery. Indeed, the availability of kinematics data allows to correlate this wider area with a higher
frequency and a larger amplitude of movement.
Conclusions: The kinematic acquisitions resulted to be reliable and versatile to enrich the fMRI images information
and therefore the evaluation of motor recovery in neurological patients where large differences between required
and performed motion can be expected.
* Correspondence:
1
Politecnico di Milano, Bioengineering Dept., NearLab, piazza L. Da Vinci 32,
20133, Milano, Italy
Full list of author information is available at the end of the article
Casellato et al. Journal of NeuroEngineering and Rehabilitation 2010, 7:49
/>JNER
JOURNAL OF NEUROENGINEERING
AND REHABILITATION
© 2010 Casellato et al; licensee BioMed Central Ltd. This is an Open Access article distributed under the terms of the Creative
Commons Attribution License (http:/ /creativecommons.or g/license s/by/2.0), which permits unrestricted use, distribution, and
reproduction in any medium, provided the original work is properly cited.
Background
Functional magnetic resonance imaging (fMRI) is one of
the main tools to investigate brain functional responses
and follow-up their evolution. Its non-invasiveness, flex-
ibility, spatial resolution, and reference to MRI anatomi-
cal images allows functional standard localizations.
However, the analysis of fMRI performed during motor
tasks in neurological patients affected by movement
impairments (e.g. hemiparesis) requires an adequate
monitoring of the actual executed movement perfor-
mance and timing. Indeed, the required ta sk could be
incorrectly carried out and involuntary movements
could occur. Moreover, longitudinal studies requir e
repeatability of motor tasks performed in different ses-
sions, in order to not confuse changes in the execution
of the movements with evolutions in the brain func-
tional response. Furthermore, mirror movements, i.e.,
unintentional and simultaneous replication on the
healthy side of the intended movements performed by
the paretic side, are quite common [1] and can affect
the interpretation of obtained images.
Several studies focusing on motor protocols under
fMRI examination applied d ifferent methods to acquire
movement performance outcomes. Many fMRI studies
used visual inspection [2,3] , sometimes coupled to palpa-
tion [4], to evaluate subject’s compliance to the requested
task; obviously these methods are only qualitative. Oth er
studies used electrogoniometers [5,6] or ShapeTape™
(Measurand Inc., Fredericton, NB) [7] to measure the
angle at the ank le. Both these devices measure only in
one plane, and are cumbersome and not suitable for
multi-joint acquisitions. Horenstein et al. [8] recorded
finger tapping performance with a MR compatible glove
(Fifth Dimension Technologies, Irvine, CA); wearing a
glove could, however, generate discomfort in subjects
and limit their freedom in the execution of movements.
In some studies forces produced b y the subject were
rec orded using a pressure trans ducer built in a hydraulic
environment [ 9,10] or a load cell [11]. In case of force
measure no free moving tasks can be executed.
Electromyography (EMG) is a very complete method
to monitor the neuro-motor output [12] because even
an isometric contraction and a low c ontraction unable
to produce a visible movement can be detected. Indeed,
in most of the latest fMRI studies, EMG has been
employed [9,10].
Until a few years ago, i t was hard to get reliable EMG
signals: indeed, the EMG recordings under the high
fMRI fields are corr upted by induction artifacts, highly
correlated to the movement and thus, hardly separable
from the addressed EMG. Initially, EMG was analyzed
only during a short inter-scan interval and used as a
time trigger, avoiding any quantitative measurement.
Nowadays [12-14] new artifacts correction techniques
were validate d, leading to achieve a reliable EMG signal
recorded even during scanning periods [ 15]. Recently,
Van Duinen and colleagues [16] showed activity in t he
motor areas strongly correlated with muscle activity
during contractions at different force levels. Nonetheless
EMG could have potential risks for the subjects due to
the contact of skin with metallic parts inside time-vary-
ing magnetic field and the MR compatibility leads to a
significant rising of costs. However, inter-session repeat-
ability of EMG signal recorded in MRI environment is
very limited, mainly because it strongly depends on elec-
trodes placement.
Exploring a different approach to the same goal, this
study intended to develop a new set-up which combines
a fMRI system with an optical motion capture system.
The m otion capture system records 3-D trajectories of
passive markers with high accuracy [17]. The proposed
integrated system has different advantages with respect
to the commonly used technologies. First, it allows to
calibrate wide working volume s o to acquire multi-seg-
ment tasks. Second, the only direct contact elements
with the patient are small, light and plastic markers,
which do not limit spo ntaneous movement execution
and do not carry any potential risk for the subject.
Third, the recorded trajectories of the markers are very
reliable and highly accurate and well established data
processing permit to calculate angular ranges of
motions, velocities and accelerations in 3-D of all the
segments, enriching the fM RI activation maps with a
complete description of the kinematics of the motor
output. Fourth, markers placement is very reliable assur-
ing the intersession repeatability.
The present work aims at proving the mutual compat-
ibility of using a motion capture system inside the MRI
bore, by phantom tests and healthy subject acquisitions
before and after motion capture insertion. Secondly, it
aims at proposing a method to utilize the recorded kine-
matics parameters into the fMRI m odel design, a dding
movement output as regressor, and to demonstrate the
possible positive impact, especially in a neurological
(partly collaborative) subject at different stages of
rehabilitation.
Methods
Participants
Two acquisition sessions were performed on a healthy
subject (24 years old, male, right-handed), both to assess
compatibility between the motion capture and fMRI and
to evaluate the feasibility of different motor tasks as
clinical protocols.
One hemiparetic subject was recruited to validate the
clinical usefulness of the setup. The patient (61 years
Casellato et al. Journal of NeuroEngineering and Rehabilitation 2010, 7:49
/>Page 2 of 17
old, female, right-handed) su ffered from a n ischemic
stroke 4 weeks before the hospitalization in the rehabi li-
tation center. Lesion was located on the right hemi-
sphere and covered the insula and temporopolar cortex.
She was not claustrophobic and she had no implanted
devices incompatible with MR.
fMRI acquisitions were performed at the hospitaliza-
tion and after one month of re habilitation therapy. She
underwent standard rehabilitation treatment (passive
and active movements) a nd 20 functional electrical sti-
mulation cycling sessions [18].
Here we report some clinical scores, representative of
her motor impairment.
• At hospitalization (pre). Motricity Index on the
lower limbs = 26; quadriceps forces produced during
a maximal voluntary isometric contraction: for right
side (healthy) = 112 N, for left side (paretic) = 13N.
• After one month (post). Motricity Index on the
lower limbs = 45; quadriceps forces produced during
a maximal voluntary isometric contraction: right =
140 N, left = 52 N.
This study was undertake n with the understanding
and written consent of each subject, with the approval
of the Ethical Board of Villa Beretta Rehabilitation
Centre.
fMRI
MRI was performed on a GE Cv/I™ 1.5 T scanner. Sub-
jects anatomy was acquired with a 3D spoiled gradient
echo sequence T1-weighted; echo time (TE) = 6.9 ms;
automatic repetition time (TR) = 15.9 ms; flip angle =
15°; matrix 256×256; field of view (FOV) = 26 cm ; voxel
size = 1×1×0.8 mm.
For functional imaging sessions a gradient EPI
sequence T2-weighted was used; TE = 50 ms; TR = 3 s;
flip angle = 90°; matrix 128×128; FOV = 24 cm; voxel
size = 1.8×1.8×4 mm.
Each functional acquisition included 100 volumes of
22 images, for a total of 2200 scans.
Motion Capture System
A motion capture system, Smart μg™ (BTS, Italy), was
used to measure kinematics. Cameras have a CCD
detector sensible to infrared and a LED enlighter emit-
ting at 850 nm; the working frequency was set to 60 Hz.
The system works with passive plastic retroreflective
markers, which reflect the near-infrared light allowing
the cameras to d etect their 2D projection on the sensor
planes. From the calibration parameters of each camera
and the marker 2D coordinates coming from at least
two cameras sensors at the same time instant, the sys-
tem algor ithm is able to prov ide the absolute 3D
position of each marker, by collinearity equations [17].
Then, the tracking procedure is performed by the opera-
tor, using a system-specific software (SmartTracker®), in
order to associate the 3D reconstructed data with the
markers model, along all acquired frames.
In the present set-up three cameras were bounded
(with SuperClamp 035™ and 804RC2™ heads Manfrotto,
Italy) to the MR room ceiling, inside the Radio-Fre-
quency (RF) shield, with one camera centered above the
axis of the bore and the other two 1.0 m apart on each
side, at the maximum possible distance from the bore
(about 3 m). The working volume was about 1×1×1 m,
the accuracy reconstruction was less than 1 mm. A
fourth camera, outside the MRI room, was used to cap-
ture an active infrared LED, which was swi tched on
simultaneously with the fMRI scanning start, in order to
synchronize the fMRI protocol and the kinematics
acquisition. Also the CPU was placed o utside the
shielded room, next to the radiologist desk. Cables con-
necting the CPU and the cameras loc ated inside the MR
room passed the RF shield across a waveguide (Fig. 1,
panels c and d). The motion analyzer was calibrated
with the shielded door opened; after calibration the
door was closed and the fourth camera, used only for
synchronization and not for movement reconstruction,
was moved to capture the synchronizing LED.
Cameras, heads, clamps and cables are metallic; cam-
eras and enlighters contain printed circuits which are
sources of electromagnetic noise, as well as the cables.
For this reason the integration of the two systems could
introduce both RF noise and dishomogeneity in the
main static magnetic field. As seen in literature [19], in
order to limit the RF interference introduced into the
MR images by electronic devices, aluminium foils, c on-
nected to MR room ground, were contiguously applied
to the cables connecting cameras and CPU. Enlighters,
as well, were partially covered with grounded aluminium
foils. On the other hand, the optical components could
be affected by the static magnetic field, provoking for
instance a focalization degradation, and the electrical
components could be compromised by the magnetic
noise.
Compatibility test
In order to evaluate the interference between the two
systems, MR images of a phantom were acquired with
and w ithout the working motion capture system inside
the MR room. A standard phantom with one-compart-
ment of aqueous paramagnetic solutions was used. As
for functional subjects acquisition, the gradient EPI
sequence (with the parameters described above in fMRI)
was performed. A 30 seconds session was acquired (TR
=3s),thereby10volumesof22imageseachwere
obtained.
Casellato et al. Journal of NeuroEngineering and Rehabilitation 2010, 7:49
/>Page 3 of 17
The S ignal-to-Noise Ratio (SNR) was calculated o n
each slice for all volumes. We use the standard index for
image quality [20], that is the ratio between the mean sig-
nal amplitude on a homogeneous area and the standard
deviation of the background signal amplitude. The refore ,
the ratio between the mean value of a small ROI placed
in the most h omogeneous area of phantom (around the
barycentre) with high signal intensity and t he mean of
standard devia tions for four ROIs placed outs ide t he
object in the image background was computed.
In order to get a change only depending from the pre-
sence of motion system, the acquisition parameters
affecting the SNR were kept as in the reference acqusi-
tion: bandwidth, field of view, slice thickness, voxel
volume, number of acquisitions (NEX) and number of
scans.
ThelossofSNRpercentagewascomputedasfollow-
ing: ΔSNR = (SNR
ref
-SNR
system
)/SNR
ref
*100; where
SNR
ref
corresponds to the reference conditio n and
SNR
system
to the integrated set-up.
Moreover, we performed tests on kinematics d ata, in
order to establish possible effects of magnetic fields on
the recording accuracy of the motion captur e system. A
marker was repeatedly launched vertically during a
phantom fMRI session. The equation of uniformly accel-
erated linear motion was applied on the descen ding
tracks of the falling down marker: knowing, from
recorded kinematic data, the displacement and duration,
the mean value of acceleration was computed.
Protocol procedures
Subjects were instructed to keep eyes closed to avoid
activations of visual cortex. Head movements were mini-
mized with rubber pads and straps. To ensure minimum
transmission of movements to the head, across the
spine, knees were bent and legs lied on a pillow. Partici-
pants wor e earphone and microphone to communicate
with the operator who gave them oral commands, trig-
gering the task temporal sequence (start and stop of
each 30 s block). The fMRI paradigm consisted of 5
resting epochs alternating with 5 activating ones. Each
period lasted 30 s, thus the trial duration was 300 s.
Two different tasks, performed by the healthy subject,
were used to evaluate the compatibility between the two
systems and a preliminary clinical feasibility. The first
task was the finger tapping. It was chosen because it is a
well established task and it leads to the activation of
well defined areas [9], easy to be localized. The healthy
subject was asked to tap the t humb with the pulp of
each finger in turn, and then start over a gain; no con-
straints were imposed on t he frequency of execution.
The second task was self-paced ankle dorsal- plantar-
flexion. The subject performed the protocols alterna-
tively with both sides.
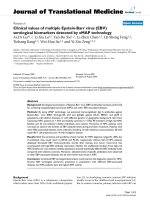
Figure 1 Set-up. a) position of the markers for ankle dorsal- plantar-flexion acquisitions; b) position of the markers for finger tapping
acquisitions; c-d) a scheme and a photo of the integrated experimental setup.
Casellato et al. Journal of NeuroEngineering and Rehabilitation 2010, 7:49
/>Page 4 of 17
For the hemiparetic patient only the ankle dorsal-
plantar-flexion on both sides was chosen as clinical pro-
tocol for evaluation, since fine hand control was not
completely recovered at the considered rehabilitation
stage. In order to get confident with the required motor
task, prior to each MRI acquisition, the patient under-
went a training that replied, out of b ore, the conditions
of the examination. During this training, along with
ankle angles of both limbs, superficial EMG signals from
the soleus, the gastrocnemius lateralis and the tibialis
anterior were acquired, in order to exclude mirror iso-
metric contractions, which th e kinematics system would
not have detected.
Kinematics acquisition and data analysis for finger
tapping
Markers were placed on the top of the index and pinkie
fingers and dorsally on the wrist (Fig. 1, panel b) of
both hands. A plastic support with two markers identi-
fied each thumb; this solution was adopted to avoid
uncorrected rec onstructions, due to the compromising
of markers visibility during the touching phases between
fingers. Three fingers for each hand were considered
sufficient for a validation acquisition on an healthy sub-
ject; indeed, desired movement parameters, as the fre-
quency and the movement a mplitude for each whole
cycle, were computable. Since the subject was healthy,
the accuracy of the task sequence (thumb sequential
touches with index, middle, ring finger and pinkie) did
not need to be verified on each of the four fingers.
The reconstructed trajectories were filtered with a
fifth-order Butterworth low-pass filter (cutoff frequency
= 5 Hz) and 3D displacements of index and pinkie fin-
gers were analyzed. For each active period, considering
all cycles, the mean Displacements of moving Index (ID)
andofmovingPinkie(PD)werecomputed.Thefre-
quency (f) of movement (number of cycles for each 30 s
block) was calculated; the same number of repetitions
for the two analyzed fingers is a proof of correct task
execution. The displacements for Index and Pinkie fin-
gers not p erforming the task during activation epochs
were estimated by Standard Deviations (ISD and PSD).
To assess if the involuntary movements were mirror
movements or not, the correlat ion coefficients (R
indexes and R pinkies) between the two-hands corre-
sponding finger displacements were computed. Move-
ments of the hand which was required to stand still
were considered significant when SDs > 0.5 cm, and
were considered mirror movements when R > 0.5.
Kinematics acquisition and data analysis for ankle dorsal-
plantar-flexion
Two m arkers, distal and proximal, were placed on the
tibia and a third one was placed on the top of the toe
(Fig. 1, panel a). Ankle angle was approximated with the
angle a defined by the line passing through the two
markers placed on the tibia and the line joining the
marker on the toe and the projection of malleolus on
the tibia-line. The values are shifted considering 0° as
the perpendicular condition. In order to reconstruct the
ankle angle, first of all, a fifth-order Butterworth low-
pass filter (cutoff f requency = 5 Hz) smoothed the
recorded trajectories and data were projected on the
plane that carried most information about the move-
ment, identified with Principal Components Analysis
[21]. For each acquisition the Mean Amplitude (MA)
and the frequency ( f) of the dorsal- plantar-flexion
movement were calc ulated during active epochs . The
angular displacement for the foot not performing the
task during activation epochs was estimated by the Stan-
dard Deviation of a (SD) in order to verify the correct
fulfillment of the task. To assess if the involuntary
movement was a mirror movement or not, the c orrela-
tion (R) between the a ngles at the two ankles was com-
puted. Relying on values found for the healthy subject,
movements o f the fo ot which was required to stand still
were considered significant w hen SD > 4°, which means
> 5% of the moving ankle range of motion, and were
considered mirror movements when R > 0.5. The train-
ing outside the bore, besides the verification of possible
isometric contractions, was used even to validate the
chosen landmarks as represe ntative of the movement
protocol.
fMRI data analysis
Functional images were converted from DICOM to
Analyze format with the MRIcro software [22]. Pre-pro-
cessing and statistical analysis were carried out with
SPM5® (Wellcome Trust Centre for Neuroimaging, Lon-
don, UK, running on
Matlab® (2007a, The MathWorks, Natick, MA).
Images were corrected for slice timing and realigned
to the first image of each respective acquisition. The
first acquired image is reliable because it is the first o ne
afterward a 30 s “preparation phase”, aiming at getting a
steady-state magnetization. The motion correction algo-
rithm, as a standard processing step from SPM5, was
run [23].
As demonstrated by Johns tone and colleagues [24], in
ablockdesign,ormoregenerallyadesigninwhich
head motion parameters are even moderately correlated
(correlation coefficient 0.2 or greater) with the model,
including the head motion parameters as covariates of
no interest has a deleterious impact reducing the sensi-
tivity for detecting true activations. However, this
approach, employed in several papers [e.g. 25], needs a
strict inspection of the estimated realignment para-
meters, assessing for excessive motion.
Casellato et al. Journal of NeuroEngineering and Rehabilitation 2010, 7:49
/>Page 5 of 17
Since our experimental design and the not negligible
correlation of head motion with the required movement
protocol, we chose to not insert the realignment para-
meters as covariates in the design matrix. In Table 1,
the maximum absolute values of translation and rotation
parameters for each entire session are reported; these
maximum values, as expected, correspond to the last
volumes of the considered session. The worst case con-
cerns the rotational parameters for patient pre-rehabili-
tation acquisition performed with the left s ide (paretic
one); she could not realize any movement and her
efforts could be the main reason of these higher move-
ment artifacts. Since this se ssion was not used for corti-
cal maps comparisons because of absence of any
performed movement, all the others absolute values of
translation indexes were less than 1.89 mm (maximum
around z-axis) and rotation angles less than 2°(maxi-
mum for the pitch angle). Even if an acceptance thresh-
old is not officially defined, these values are plentifully
under thresholds a lready reported in literature, e.g. 4
mm translation and 5° rotation [24].
Images were then normalized on the Montreal Neuro-
logical Institute (MNI) standard brain [26]. Finally, they
were spatially smoothed with a Gaussian kernel homo-
geneous in the three spatial directions, with a Full
Width Half Maximum Gaussian filter of 6 mm, to
increase the signal-to-noise ratio.
For each experimental session, a general linear model
was employed, performing each analysis with two differ-
ent types of model design. In the first design, i.e. the
standard block design, only the stimuli was modeled
with a conventional boxcar function as five rest periods
of 30 s alternating with five active periods of 30 s. In
the second one, a user defined kinematic regressor
describing the actually e xecuted movement was added
into the d esign matrix besides the stimuli. The kine-
matic regressor was the amplitude along time, computed
from recorded kinematic coordinates. This way k ine-
matic regressor comprises both different amplitude of
tasks execution as well as timing of task execution not
coherent with the request.
The effect of inserting the actual kinematics para-
meter s in the generation of cortical activati on maps was
evaluated comparing the two models.
A high-pass filter was automatically included in the
analysis by SPM5 (cutoff time constant = 128 s). Statisti-
cal analysis was accomplished using a p-value < 0.01
with Family Wise Error correction and extent threshold
of 100 voxels.
Four ROIs were defined, two of them matching the
representation of ankle in the sensorimotor cortex for
each hemisphere and two matching the hand mapping
areas. Coordinates in MNI reference system for the cen-
ter(forthefoot:×=±6mm,y=-37mm,z=70mm;
for the hand: × = ± 36 mm, y = -22 mm, z = 58 mm)
and extension of the ROIs were obtained from literature
[27]. To define such ROIs, we used the standard soft-
ware WFU PickAltas, which provides a tool for generat-
ing ROI masks b ased on the Talairach Daemon
datab ase; this method is an automated coordinate-based
system which retrieves brain labels from the 1988 Talar-
aich Atlas [28].
For each acquisition, the center o f mass of activated
areas was calculated, weighting the intensity, of each
cluster of voxels included into the areas of interest
(motor ROIs).
To estimate inter-hemispheric balance, weighted later-
ali ty index ( wLI) [29] was calculated from the sum of t-
values across all active voxels in each ROI according to
the formula:
wLI
()
()
I
I
=
−
+
∑∑
∑∑
tt
tt
C
C
where t
C
are t-values of voxels lying i n the ROI in the
contralateral hemisphere and t
I
are t-values of voxels
lying in the ROI in the ipsilateral hemisphere. wLI
ranges from -1, which stands for a totally ipsilateral acti-
vation, to 1, totally contralateral.
Results
Compatibility test
The computed SNR values were compared between the
two experimental conditions: reference one and with
three working cameras of the motion capture system
within the scanner room. In Fig 2, it is evident that t he
SNR was not compromised: the time profile inside one
volume (22 slices) and along the acquired 30 s was the
same with and without mo tion system, further sho wing
an analogous reduced SNR at the first slices for each
volume. In the table under the figure, the ΔSNR, within
each volume, averaged on slices, and the “total” mean
Table 1 Realignment parameters
Translation (mm) Rotation (rad)
Subject Session x y z Pitch Roll Yaw
Healthy right 0.3417 0.3348 1.8892 0.0182 0.0065 0.001
left 0.2733 0.418 1.5832 0.0165 0.0063 0.0061
Patient Pre-right 0.8953 0.4925 0.8524 0.0234 0.0123 0.0269
Pre-left 1.8179 1.5353 1.8285 0.0327 0.0222 0.0939
Post-right 1.0054 0.3014 0.7574 0.0043 0.0197 0.0094
Post-left 0.737 0.9508 1.0428 0.026 0.0171 0.0164
Maximum absolute values of translation and rotation parameters, within the
realignment sp atial process; they are reported for the analyzed participants,
for each performed session.
Casellato et al. Journal of NeuroEngineering and Rehabilitation 2010, 7:49
/>Page 6 of 17
ΔSNR are reported, with the relative standard devia-
tions. The relative ΔSNR, averaged among volumes, was
2.37 ± 2.9%.
Concerning the kinematic data reliability, the accelera-
tion value, averaged among four trials, was 9.92 ± 0.26
m/s
2
, as expected in standard condition.
Healthy subject acquisition
Healthy subject anatomical and functional images
showed a similar increase in broadband noise.
On the reference anatomical images, we could see
narrow zippers artifacts. As explained by Heiland in [30]
they are caused by RF signals leaking into the receiver
of the MR scanner and appear as bright lines in MR
images. Their positions within the image depend on the
frequency of the RF source that causes the artifact (not-
completely shielded equipment inside the scanner
room), as well as on readout bandwidth and field of
view. Within the functional images, these zippers are
not visible. This probably means that in functional
images, the low resolution l eaded to the RF noise alias-
ing. A basic evaluation of this the RF noise distributed
on the fMRI image is represented by the SNR reduction
on the phantom images.
1) Finger tapping
Concerning the right finger tapping task, subject cor-
rectly respected the temporal sequence and performed
the task with almost constant movement exte nt and
rhythm. The entire finger tapping cycle was performed
on average 11 times per activation period (0.36 Hz). No
significant movement could be seen for the resting
hand; indeed, ISD and PSD were both < 1% of moving
index and pinkie displa cements, respectively (index
0.28%; pin kie 0.83%). The correlation values ( R indexes
and R pinkies) were, therefore, not significant (Table 2).
As expected since the accomplishment of the required
protocol, the analysis with the d esign matrix including
the kinematic regressor (index displacement along time)
yielded analogous activation maps compared with the
standard design matrix analysis, in terms of both locali-
zation and extensions. Activated voxels were mainly
located in the sensorimotor cortex and pre-motor cor-
tex, a few lied in Brodmann’sAreas(BA)5and7too.
Activation was totally contralateral (wLI = 1) and the
activation barycentre was at [-37 -27 52] mm, consistent
with the homunculus topography for hand. Left side
provided analogous results.
2) Ankle dorsal- plantar-flexion
Concerning the dorsal-plantar-flexion of the ankle,
Table 3.A and 3.B summarizes kinematics data for the
healthy subject, right and left foot, respectively. As
explained in Methods, the planarity of movement was
verified for all the acquisitions by PCA: at least 98% of
information related to trajectories lied on the plane cho-
sen for projection. The subject correctly respected the
temporal sequence of the task. Amplitude and frequency
were repeatable across the different blocks. The foot not
involved in the task was kept still (SD < 4°).
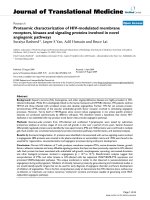
Figure 2 SNR evaluation. From gradient EPI functional acquisition on phantom, SNR along with the 220 slices, split up into 10 volumes (vertical
dashed lines). Red: reference condition; Blue: with motion capture system working within the scanner room. Under the plot: table with mean of
ΔSNR for each volume, and the total mean one.
Casellato et al. Journal of NeuroEngineering and Rehabilitation 2010, 7:49
/>Page 7 of 17
Accordingly t o the fact that the kinematic regressor
(ankle angle along time) follows the pre-defined stimuli,
the two analyses yielded to similar activation maps, for
both sides. Activated voxels were located in controlateral
sensorimotor cortex and pre-motor cortex for right ankle
plantar- dorsi-flexion (Fig. 3, panel A). When executing
the task with the left foot some active voxels were found
in controlateral BA 5, too (Fig. 3, panel B). Activations
were highly contralateral for both sides (wLI > 0.86).
For both protocols, kinematics data provided the
demonstration that healthy sub ject performed the tasks
meeting the imposed timing and using a comparable
amplitude and frequency of execution along the differ-
ent blocks, as expected.
Table 2 Kinematics of finger tapping for healthy subject
1°PERIOD
t(s): 30-60
2°PERIOD
t(s): 90-120
3°PERIOD
t(s): 150-180
4°PERIOD
t(s): 210-240
5°PERIOD
t(s): 270-300
MEAN
ID (cm) 3.5 ± 2 6.3 ± 2.8 8.2 ± 2.5 6.2 ± 1.6 3.8 ± 1.6 5.6 ± 2.1
PD (cm) 1.7 ± 0.9 3.3 ± 0.8 3.9 ± 0.9 3.1 ± 0.8 2.8 ± 0.4 3 ± 0.7
f (Hz) 0.33 0.37 0.33 0.37 0.4 0.36 ± 0.03
ISD (cm) 0.02 0.03 0.02 0.01 0.01 0.016 ± 0.007
PSD (cm) 0.04 0.01 0.02 0.03 0.02 0.025 ± 0.012
Kinematics data measured when the healthy subject was performing the finger tapping with the right hand. R coefficients are not reported because the two SDs
were lower than 1% in all the periods.
ID: Index Displacement; PD: Pinkie Displacement; f: frequency; ISD: rest Index Standard Deviation; PSD: rest Pinkie Standard Deviation.
Table 3 Kinematics of ankle plantar- dorsi-flexion, for healthy subject and patient
1°PERIOD
t(s): 30-60
2°PERIOD
t(s): 90-120
3°PERIOD
t(s): 150-180
4°PERIOD
t(s): 210-240
5°PERIOD
t(s): 270-300
MEAN
A. Healthy subject right foot
MA(°) 37.89 ± 5.61 38.53 ± 4.8 43 ± 8.6 46.32 ± 10.32 49.15 ± 11.91 42.98 ± 8.24
A SD(°) 0.81 0.3 0.43 0.46 0.2 0.45 ± 023
f(Hz) 0.57 0.47 0.47 0.53 0.5 0.51 ± 0.04
R 0.07 -0.2 0.35 -0.24 -0.33 -0.07 ± 0.28
B. Healthy subject left foot
MA(°) 46.28 ± 5.57 43.01 ± 8.16 42.39 ± 7.33 43.77 ± 7.35 44.25 ± 6.84 43.94 ± 7.05
B SD(°) 0.89 0.99 0.48 0.49 0.45 0.66 ± 0.26
f(Hz) 0.47 0.63 0.53 0.50 0.56 0.54 ± 0.06
R 0.15 -0.05 0.08 -0.01 0.14 0.06 ± 0.09
C. Patient healthy foot at hospitalization
MA(°) 27.11 ± 7.70 29.88 ± 6.25 31.29 ± 5.91 31.8 ± 7.63 31.02 ± 7.38 30.23 ± 6.99
C SD(°) 0.11 0.04 0.04 0.08 0.06 0.07 ± 0.28
f(Hz) 0.4 0.43 0.43 0.53 0.43 0.45 ± 0.05
R -0.2 0.32 0.49 -0.07 0 0.11 ± 0.29
D. Patient healthy foot after one month
MA(°) 46.47 ± 7.17 44.41 ± 9.71 54.11 ± 18.37 59.95 ± 19.47 63.36 ± 18.82 53.69 ± 14.71
D SD(°) 0.3 0.19 0.2 0.07 0.13 0.18 ± 0.33
f(Hz) 0.8 0.9 0.87 0.93 0.9 0.88 ± 0.05
R -0.18 0.13 -0.07 -0.01 0.29 0.03 ± 0.18
E. Patient paretic foot after one month
MA(°) 9.91 ± 6.05 9.64 ± 4.7 9.74 ± 3.86 10.55 ± 4.1 11.06 ± 18.82 10.18 ± 4.72
E SD(°) 7.8 7.77 4.93 5.6 5.34 6.58 ± 1.38
f(Hz) 0.13 0.16 0.13 0.3 0.13 0.17 ± 0.07
R 0.59 -0.05 0.75 0.16 0.18 0.33 ± 0.33
Ankle angle data (mean amplitud e MA, standard deviation of the resting ankle SD, frequency of repetitions f, and correlation with the resting leg motion R), for:
A) Healthy subject right foot
B) Healthy subject left foot
C) Patient healthy foot at hospitalization
D) Patient h ealthy foot after one month
E) Patient paretic foot after one month.
Casellato et al. Journal of NeuroEngineering and Rehabilitation 2010, 7:49
/>Page 8 of 17
Hemiparetic subject acquisition
1) Pre-rehabilitation acquisition
At the hospitalization the patient needed a wheelchair
and could not perform any movement with the paretic
limb: kinematics data did not show any significant angle
variation for the paretic limb. No active voxels were
found while she was trying to execute the task with the
paret ic foot, even when limits on cluster extension we re
removed and significant threshold on p-value increased
till 0.05. We could hypothesize that if imagery-related
activations were present, they were disorganized so as to
be not visible (acute phase at hospitalization). Instead,
with the healthy foot, she was able to perform the
required movement, but she did not manage to meet
time triggering imposed by the o perator. She kept mov-
ing after stop signals in third and fourth active blocks
(Fig. 4). The patie nt performed an average amplitud e of
the m ovement of 30.23° ± 6.99° and the frequency was
0.45 Hz ± 0.05 Hz (Table 3.C). She correctly kept still
the resting leg (SD < 4°). Since she did not move one of
the feet, the correlation between the two ankle angles
was low (R = 0.11). In such case, given the difference
between the stimuli and the kinematic performance
(ankle angle along time), a modified outcome due to the
kinematic regressor was expected.
Fig. 5 shows the comparison b etween the statistical
analysis using the predefined standard block design
matrix (panel A) and the matrix including the regressor
with the actual kinematics (panel B). The latter led to a
larger and more posterior activ ation (Table 4). The wLI
was accordingly different (0.64 with predefined design
matrix and 0.72 with kinematics regressor), being the
extent of activations almost doubled. The position of
activated areas barycentre was only slightly affected ([-4-
30 71] mm with predefined design matrix and [-5 -31
70] mm with kinematics regressor). Active voxels w ere
located in the primary sensorimotor cortex and BA 5
and 7. The two involved lobes are the parietal and the
frontal ones in both analyses, even if the use of kine-
matic regressor allows to almost duplicate the significant
activated voxels in both lobes. In particular, the
increased activated cortical functional BAs are within
the somatosensory cortex (BA 2,3,5,7) and the motor
cortex (BA 4, 6). The wider activation of BA6 indicates
the strong involvement of premotor cortex (PM) and
supplementary motor area (SMA).
2) Post-rehabilitation acquisition
After one month of rehabilitation, for the not impaired
limb, the patient achieved a good fulfillment of temporal
sequence; the ankle motion was quite repeatable in
Figure 3 Cortical maps for right and left ankle dorsi- flexion of healthy subject. Activations, rendering 3D, for healthy subject, right an kle
protocol (panel A) and left ankle protocol (panel B), both analyzed with the model design including the kinematic regressor.
Casellato et al. Journal of NeuroEngineering and Rehabilitation 2010, 7:49
/>Page 9 of 17
Figure 4 Kinematic regressor of patient’ s healthy foot pre-rehabilitation. Ankle angle amplitude of patient’ s healthy foot (right) at
hospitalization. It was sampled for matching with the scans number and then inserted into the design matrix as kinematic regressor.
Figure 5 Cortical maps of patient’s healthy foot pre-reh abilitation session, comparison between the two model designs. Activation for
patient’s healthy foot at hospitalization, eight transversal slices centered around z = 72 mm are shown (slice thickness = 4 mm). A) activation
found using standard design matrix for statistical analysis; B) activation found using the design matrix with the kinematic regressor. Under each
one, wLI and coordinates of the Center of Mass (CoM) of activated areas are reported.
Casellato et al. Journal of NeuroEngineering and Rehabilitation 2010, 7:49
/>Page 10 of 17
between blocks. As a consequence, the model design
with the addition of the kinematic regressor did not
modify significantly the activation maps. The amplitude
of the movement was 53.69° ± 14.71° performed at a fre-
quency of 0.88 Hz ± 0.05 Hz. The resting limb produced
a SD < 4° with no correlation with the moving side (R =
0.03, Table 3.D). Primary sensorimotor cortex and BA 7
(Fig. 6), prevalent ly in th e contralateral hemisphere (wLI
= 0.84), were activated. Compared to the pre-rehabilita-
tion session of the same foot, these findings highlighted
a globally larger activated area and a slight improving of
the controlaterality.
After one month of rehabili tation the patient was ab le
to move again the paretic side. With the paretic limb
the patient executed a movement of 10.18° ± 4.72° at
0.17 Hz ± 0.07 Hz (Table 3.E).
Nevertheless the patient did not manage either to
meet the task timing or to keep the right foot still, as
requested by the protocol; the SD of the supposed rest-
ing foot was 6.58° ± 1.38°; the correlation between the
feet was R = 0.33. The activations obtained from the
two model designs were different. In particular, the
standard design yielded to small clusters (all less than
25 voxels) and all in the ipsilater hemisphere. Instead,
inserting the actual kinematics regressor into the design
matrix yielded to more meaningful activation ma ps, i.e.
wider clusters and even in the controlateral hemisphere
(Fig. 7).
Discussion
Compatibility test
We can assess that the loss of SNR introduced by the
motion system (2.37 ± 2.9%) is negligible. Indeed, we
can use as reference the recent study of Scarff and col-
leagues [31]: in simultaneous recordings of fMRI and
EEG, they showed that MR image SNR, computed as we
did, decreased as the number of electrodes increased,
andtheyfixasdataqualityacceptableaSNRlosson
the images of 11-12%. Their v alue origina tes from com-
pletely different device components, more complex and
necessarily c loser to the MR scanner; anyway, it can be
considered a general reference (worst case) about t he
additive noise on the fMRI images due to a new device.
Other studies [32,33] using similar parameters (e.g. sig-
nal to noise fluctuation ratio) assessed the reliability o f
fMR I images finding a relative SNR loss with respect to
the standard condition of 2.75%. Mullinger and collea-
gues [34] evaluated on a phantom the effect of the con-
ducting materials in the EEG-caps with 1.5 T
acquisitions, accepting a SNR reduction of 27% with 32
electrodes.
The use of thr ee cameras allows a reliable reconstruc-
tion of 3D positions of the markers. Three cameras,
even if not positioned with the optimal mutual orienta-
tions having as major priority to put them on the ceiling
at the maximal distance from the bore, represent a good
compromise between the introduced noise and the relia-
bility of markers reconstruction. Indeed, the calibration
procedure for each session, estimating the reconstruc-
tion error on a moving bar with 3 markers at fixed
known distances, confirms the high accuracy of kine-
matics data (in our case, accepted error < 1 mm o n a
working volume of 1×1×1 m).
The computed mean gravity acceleration was as the
expected one, hence the magnetic fields did not affect
the motion capture system and camera data processing.
Feasibility of methodology was therefore
demonstrated.
Healthy subject acquisition
Both the hands and the legs were visible; thus, excluding
the part inserted into the bore, it was demonstrated the
possibility of acquiring a great number of multi-segment
motor tasks. Since the easiness and the not invasiveness
Table 4 Activated voxels for not paretic pre-
rehabilitation ankle plantar- dorsi-flexion session,
comparing the two model designs
Region # voxels
With predefined
design matrix
With re-defined
design matrix
TOTAL # VOXELS 228 451
Left cerebrum 155 336
Parietal lobe 103 227
Paracentral_Lobule_L (aal) 103 212
Postcentral gyrus 83 188
White matter 87 179
Gray matter 52 128
Frontal lobe 52 112
Precuneus_L (aal) 27 88
Paracentral lobule 35 78
Precentral gyrus 31 58
Brodmann area 4 16 43
Brodmann area 3 18 32
Brodmann area 6 426
Inter-hemispheric 11 22
Postcentral_L (aal) 14 20
Brodmann area 5 919
Medial frontal gyrus 6 15
Paracentral_Lobule_R (aal) 9 13
Brodmann area 2 56
Parietal_Sup_L (aal) 3 5
Supp_Motor_Area_R (aal) 3
Right Cerebrum 3
Brodmann area 7 2
Cortical and subcortical regions significantly activated during the movement
protocol, obtained by the two analyses: with the predefined and with the
design matrix including the kinematic regressor (FWE corrected p < 0.01).
Casellato et al. Journal of NeuroEngineering and Rehabilitation 2010, 7:49
/>Page 11 of 17
of markers positioning, the landmarks definition can be
customized depending on the patient’sspecificmove-
ment skills and the segments involvement i n the move-
ment execution. For instance, depending on the goals of
study, it could be necessary, for a finger tapping task, to
monitor each individual finger. Smaller markers and not
cumbersome rigid structu res could represent valid solu-
tions, but the working volume extent, the distance
between cameras and bore and the reconstruction error
have to be specifically evaluated.
On the healthy subject anatomi cal image two narrow-
band “zippers” appeared. Because of their position and
size, n o problem occurred for image processing. How-
ever, loss of significance could not be completely
excluded due to pixels covered by zippers.
For both the tested protocols on the healthy subject,
we implemented the proposed method including the
actual k inematics into the protocol model. As expected
for healthy subject, who correctly meet the request, the
kinematic parameter did not add new information with
Figure 6 Cortical maps for patient’s healthy foot post-rehabilitation session, using the kinematics into the model design . Activation for
patient’s healthy foot (right) after one month (obtained using standard design matrix), from analysis taking into account the actual kinematics.
Eight transversal slices centered around z = 72 mm are shown (slice thickness = 4 mm). Under the figure, wLI and coordinates of the Center of
Mass (CoM) of activated areas are reported.
Casellato et al. Journal of NeuroEngineering and Rehabilitation 2010, 7:49
/>Page 12 of 17
respect to the pre-defined stimuli and the cortical maps
did not experience any significant changes.
The activation maps areas, the position of clusters
barycentres and the level of controlaterality were in
both the tests consistent with the literature. Comparing
the obtained functional areas between t he two motor
tasks, it was highlighted an additional activation of BA 5
and 7 for finger tapping compared to ankle dorsal- plan-
tar-flexion. Indeed, these areas are involved in maintain-
ing a spatial reference system during execution of fine
and complex tasks, by coordinating movement and
proprioception, hence when the involved degrees of
freedom are numerous. The hand has a larger cortical
representation, especially in the pre- and postcentral
gyri, compared to lower limb representations [7-35], as
expected by literature.
Hemiparetic subject acquisition
The healthy foot pre-rehabilitation and the paretic foot
post-rehabilitation sessions confirmed the usefulness of
design matrix redefinition with the inclusion of the
kinematic data. In the latter, only with such model
Figure 7 Cortical maps for patient’s paretic foot post-rehabilitation session, using the kinematics into the model design. Activation for
patient’s paretic foot (left) after one month given by analysis taking into account the actual kinematics. Eight transversal slices centered around
z = 72 mm are shown (slice thickness = 4 mm Under the figure, wLI and coordinates of the Center of Mass (CoM) of activated areas are reported.
Casellato et al. Journal of NeuroEngineering and Rehabilitation 2010, 7:49
/>Page 13 of 17
optimization activation maps showed significant activa-
tion clusters, making the cortical map consistent with
the performed bilateral modest movements.
Furthermore, for healthy foot post-rehabilitation ses-
sion, we obtained a greater extension of activations, in
the same BAs, compared to the ones found at hospi tali-
zation, before the rehabilitation treatment. We have to
consider that the observed difference in the activation
areas could be linked to the greater amplitude of the
movement (30.23° ± 6.99° pre, 53.69° ± 14.7 1° post) and
the higher frequency of execution (0.45 Hz ± 0.05 Hz
pre, 0.88 Hz ± 0.05 Hz post). The quantitative measure-
ments of movement amplitude and frequency obtained
with motion capture system provide information that
could be precious to relate difference in activat ion char-
acteristics to difference in the movement parameters. A
recent study [36] evidenced that post-stroke modifica-
tions in neuronal networks controlling the paretic limb,
especially compensatory recruitment of the non-lesioned
hemisphere, m ay affect cortical areas in control of the
non-paretic limb. Moreover, non-use of both lower
extremities due to impaired walking or altered limb
kinematics and body posture due to hemiparesis may
induce neural adaptations in networks controlling the
intact limb. Hence, quantifying mirror movements and
movement extent, both for paretic and healthy sides, is
crucial to interpret what is due to b ilateral movements,
what is due to larger movements and what is an ex pres-
sion of neural plasticity: indeed, depending on lesion
location, a compensatory recruitment of bilateral cortical
regions can be part of the motor recovery.
The standard statistical analysis of fMRI images,
usually employed in clinical examinations, i s based on
the repeatability of protocol blocks, in terms of both
periods duration and execution parameters (amplitude
and frequency). This hypothesis i s actually the main
limitation of fMRI exploitation for motor recovery eva-
luation; indeed, this r epeatability is not quantitatively
verified, thus the resulting cortical maps are affected
by possible variations of the task execution. This
repeatability assumption becomes even weaker for neu-
rological patients than for healthy subjects. The possi-
ble poor matching among protocol blo cks parameters
can affect the intra-session analysis. This non-repeat-
ability increases when considering different sessions of
the patient at different stages of the rehabilitative path-
way; this element needs therefore to be monitored for
longitudinal studies aimed at the e valuat ion of rehabili-
tative process. This loss of comparability turns out to
be even more significant for inter-subjects studies,
where, for instance, a specific rehabilitation treatment
is under test.
The repeatability of the markers placement and the
comparability o f motion parameters represent the main
advantage of using motion capture system with respect
to EMG, where the level of noise of the recorded signal
and t he criticality o f electrodes posit ions strongly limit
the possibility to compare consistently muscles activa-
tion profiles between different experimental sessions.
Further, when the interest is on movement execution,
the correct single subject choice of muscles to be stu-
died can complicate because of synergism, while kine-
matics offer a simple, reliable and general picture of
motion. On the contrary, when the study is focused on
presence of isometric contractions, kinematics is not at
all suitable, or when different muscles strategies are
investigated only EMG could provide detailed analysis.
The present work demonstrates the availability of the
possible simultaneous measure of kinematics data and
fMRI, offering an innovative and extremely flexible
experimental set-up for a better understa nding of neural
correlates of motor tasks.
As initial step, here the kinematics data have b een
successfully adopted to enrich the design matrix by
including the representative parameters of the per-
formed movement during fMRI block statistical proces-
sing; it means to take into account both the movement
extent within and between blocks and the actual specific
segmentation of task-execution periods and rest periods.
The utility of design matrix re-definition for fMRI statis-
tical processing have been recently demonstrated also by
Krainak and colleagues [11]: the mechanical motor out-
put was measured in terms of force and torque, by a
MR compatible 6 degree of freedom load cell, and the
torque signal was used to identify the onset and the end
of each single trial; the set-up permitted nevertheless
only isometric protocols for upper limbs. Our combined
methodology allows, indeed, recording of multi-joint
dynamic motor tasks and there are not an y constraints
about the duration of trials, which can be defined for
both block or event-related protocols.
Moreover, t he use of motion capture allows to track a
great number of markers in the calibrated working
volume, permitting synchronized quantitative informa-
tion about movements of multiple segments. This aspect
strongly impacts on mirror moveme nts monitoring,
which allows to correctly interpret possible ipsilateral
activations, distinguishing between activations due to
movements of the limb which was asked to be still and
activations due to a cortical reorganization as form of
motor recovery. The accuracy of the motion system
allows to detect even mirror mov ements with ampl itude
smaller than 0.5 cm, i.e. angles about < 2°; therefore also
not visible movements, almost flickers, are turned out by
the system. Recently, Enzinger and colleagues [6] carried
out an fMRI ankle dorsiflexion paradigm to test for cor-
tical reorganization in patients with chronic stroke with
varying degr ees of residual gait impairment. A wooden
Casellato et al. Journal of NeuroEngineering and Rehabilitation 2010, 7:49
/>Page 14 of 17
ankle support with an electrogonio meter was used.
Since the most interesting resul ts concern the increased
cortical activation in the unlesioned hemisphere (ipsilat-
eral to paretic l imb), it could be very enriching to apply
a complete kinematic analysis, able to provide a quanti-
fication of probable mirror movements and a global 3-
dimensional multi-segment measurement of lower limbs.
Another challenging application of fMRI simultaneous
kinematic analysis could be in the investigations of func-
tional properties of brain areas associated with motor
execution and imagery [37], with the final goal to under-
stand the effectiveness of motor imagery to en hance the
recovery. The kinematics recordings could provide a
method solving the main issue concerning the feedback
of motor imagery task accuracy; inde ed, it could verify
the absence of any actual movement, even if isometric
contractions not resulting in motion could be masked
by kinematic acquisitions.
In order to systematically verify correlations between
motor output and cortical activatio ns, more complex
protocols should be e mployed, with more detailed
instructions to the subject: established frequencies and
amplitudes should be kept constant for defined sessions
or systematically changed as request. Such complexity
could be unfeasible for many neurologic patients and a
quantitative instrumentation for objective movement
monitoring is needed, able to detect even undesired or
unconscious variations in the motor task.
A complete and structured analysis of the effects of
motor execution parameters to the activation maps in
healthy and in pathological subjec ts will be ne cessary to
provide reliable information for the clinical massive use
of motor fMRI acquisitions. Whet her and in which
extent there could be a relation between kinematics
parameters and a ctivation area will be the object of fol-
lowing deeper experimental studies. In literature the
amplitude effect was studied, e.g. with a simple finger
tapping test [38], supporting the hypothesis that a larger
amplitude of the task would correspond to a larger
BOLD signal. Similar suggestions came from MachIn-
tosh’s studies on ankle dorsiflexion, measured by fiber-
optic device on one joint: large-amplitude movements
yielded to less lateralized activation compared to small-
amplitude movements, after verification of no difference
in relative head motions [7]. Multi-segment and bilateral
kinematics monitoring could add useful information to
these hypotheses. Indeed, as far as we know, no general-
ization and systematic findings about the amplitude role
on cortical activations are shown. Frequency parameter
on movement execution is more popular in literature
even if opposing results were as serted. Some studies did
not find any relationship between frequency and activa-
tion areas [39], on the contrary others [40]
demonstrated the parallel increasing of movement fre-
quency and BOLD signal; finally, Sadato et al [41]
showed the size o f activated area increased with higher
frequencies only up to 2 Hz. There is stil l great uncer-
tainty concerning these relationships, analyzing different
motor tasks.
Our p roposed combined recording of motor output
and neural correlates performs a continuous movement
monitoring, including different time-varying kinematics
parameters as regressors in the fMRI processing, so
optimizing the pro tocol model with the movement out-
put [42]. This methodology should provide a more pre-
cise reduction in the number of unc ontrolled variables,
enhancing the capability to discern the causes of differ-
ent cerebral activati ons: motor performance characteris-
tics or cortical reorganization.
Conclusions
As a general conclusion, with respect to the current
gold standard for motor output assessment during
fMRI, i.e. MR-compatible EMG acquisition, we highlight
some advantages which could promote the use of
motion capture system to enrich EMG data or to substi-
tute EMG, depending on the research goals.
Firstly, since the kinematics is well known to be much
reliable in terms of markers positioning, both intra-sub-
ject and inter-subjects, the motion analysis during fMRI
can be well applicable to different subjects and to differ-
ent experimental conditions, allowing solid comparisons.
EMG data are difficult to be repeatable even on the
same subject, as extremely affected by electrodes place-
ment. Moreover, significantly different muscular sy ner-
gies could be adopted by subjects, leading to the need of
detecting many muscles to get a complete information
about performed movement. Secondly, kinematics allows
multi-segments acquisitions, providing a bilat eral and
complete description of motor task execution, through
quantified parameters such as start and end instants of
movement, amplitude, frequency, and verification of
mirror movements.
On the other hand, there are some technical disadvan-
tages for kinematics versus EMG. The first is the lost of
isometric contractions; to overcome this issue it is possi-
ble or to verify before the fMRI protocol the existence
of isometric contractions (as in this work), or to couple
EMG and kinematics, exploiting the strength points of
each methodology, during the fMRI examination. Simi-
larly, when muscl es synergies are under investigation
only EMG is feasible. A further we ak issue concerning
kinematics is that the scientific community in neuro-
image is now acquainted to EMG, and the comparison
between EMG studies and kinematics parameters is not
immediate and requires some preliminary investigations.
Casellato et al. Journal of NeuroEngineering and Rehabilitation 2010, 7:49
/>Page 15 of 17
Acknowledgements
This work was supported by the Italian Space Agency (Disorders of Motor
and Cardiorespiratory Control program) for the motion capture system and
by the Italian Institute of Technology (IIT).
Author details
1
Politecnico di Milano, Bioengineering Dept., NearLab, piazza L. Da Vinci 32,
20133, Milano, Italy.
2
Politecnico di Milano, Bioengineering Dept., piazza L.
Da Vinci 32, 20133, Milano, Italy.
3
Valduce Hospital, Unità operativa
complessa di Radiologia, via D. Alighieri 11, 22100, Como, Italy.
4
Valduce
Hospital, Villa Beretta, Unità operativa complessa di medicina riabilitativa, via
N. Sauro 17, 23845, Costamasnaga (LC), Italy.
Authors’ contributions
CC participated to study design, data collection and analysis, and manuscript
writing; SF participated to study design, data collection and analysis, and
manuscript definition; MG participated to data analysis and methods
definition, to literature comparisons and manuscript revisions; NV
participated in literature overview, in the data collection and in the
preliminary analysis; GF participated to study design and compatibility
assessment; GB participated to fMRI images processing and statistical
analysis; TF participated to data collection and neurophysiological
interpretation; AM participated to study design and to clinical assessment;
FM participated to recruitment of stroke patients and rehabilitation
treatment evaluation; AP participated to study design, data collection and
analysis and manuscript revision.
All authors read and approved the final manuscript.
Competing interests
The authors declare that they have no competing interests.
Received: 25 January 2010 Accepted: 23 September 2010
Published: 23 September 2010
References
1. Wittenberg GF, Bastian AJ, Dromerick AW, Thach WT, Powers WJ: Mirror
Movements Complicates Interpretation of Cerebral Activation Changes
During Recovery From Subcortical Infarction. Neurorehabil. Neural Repair
2000, 14:213-221.
2. Cramer SC, Nelles G, Benson RR, Kaplan JD, Parker RA, Kwong KK,
Kennedy DN, Finklestein SP, Rosen BR: A functional MRI study of subjects
recovered from hemiparetic. Stroke 1997, 28:2518-2527.
3. Carey JR, Anderson KM, Kimberley TJ, Lewis SM, Auerbach EJ, Ugurbil K:
fMRI analysis of ankle movement tracking training in subject with
stroke. Exp. Brain Res 2004, 154:281-290.
4. Dobkin BH, Firestine A, West M, Saremi K, Woods R: Ankle dorsiflexion as
an fMRI paradigm to assay motor control for walking during
rehabilitation. NeuroImage 2004, 23:370-381.
5. Ciccarelli O, Toosy AT, Marsden JF, Wheeler-Kingshott CM, Sahyoun C,
Matthews PM, Miller DH, Thompson AJ: Identifying brain regions for
integrative sensorymotor processing with ankle movements. Exp. Brain
Res 2005, 166:31-42.
6. Enzinger C, Johansen-Berg H, Dawes H, Bogdanovic M, Collett J, Guy C,
Ropele S, Kischka U, Wade D, Fazekas F, Matthews PM: Functional MRI
correlates of lower limb function in stroke victims with gait impairment.
Stroke 2008, 39(5):1507-13.
7. MacIntosh BJ, Mraz R, Baker N, Tam F, Staines WR, Graham SJ: Optimizing
the experimental design for ankle dorsiflexion fMRI. NeuroImage 2004,
22:1619-1627.
8. Horenstein C, Lowe MJ, Koenig KA, Phillips MD: Comparison of unilateral
and bilateral complex finger tapping-related activation in premotor and
primary motor cortex. Hum. Brain Mapp 2009, 30(4):1397-412.
9. Liu JZ, Dai TH, Elster TH, Sahgal V, Brown RW, Yue GH: Simultaneous
measurement of human joint force, surface electromyograms, and
functional MRI-measured brain activation. J. Neurosci. Methods 2000,
101:49-57.
10. Dai TH, Liu JZ, Sahgal V, Brown RW, Yue GH: Relationship between muscle
output and functional MRI-measured brain activation. Exp. Brain. Res
2001, 140:290-300.
11. Krainak DM, Parrish TB, Dewald JPA: A method to capture six-degrees-of-
freedom mechanical measurements of isometric shoulder and elbow
torques during event-related fMRI. J. Neurosci. Methods 2007, 161:314-322.
12. Van Duinen H, Zijdewind I, Hoogduin JH, Maurits N: Surface EMG
measurements during fMRI at 3T: Accurate EMG recordings after artifact
correction. NeuroImage 2005, 27:240-246.
13. Moosmann M, Ritter P, Steinbrink J, Villringer A: Simultaneous multimodal
acquisition of surface-EMG, EEG and fMRI. Proc. Int. Soc. Mag. Reson. Med.
May 15th-21st 2004, 11:1045.
14. MacIntosh BJ, Baker N, Mraz R, Ives JR, Martel AL, McIlroy WE, Graham SJ:
Improving Functional Magnetic Resonance Imaging Motor Studies
Through Simultaneous Electromyography Recordings. Hum. Brain Mapp
2007, 28:835-845.
15. Van Rootselaar AF, Renken R, de Jong BM, Hoogduin JM, Tijssen MA,
Maurits NM: fMRI Analysis for Motor Paradigms Using EMG-Based
Designs: A Validation Study. Hum. Brain Mapp 2007, 28:1117-1127.
16. Van Duinen H, Renken R, Maurits NM, Zijdewind I: Relation between
muscle and brain activity during isometric contractions of the first
dorsal interosseus muscle. Hum Brain Mapp 2008, 29(3):281-99.
17. Borghese NA, Ferrigno G: An Algorithm for 3-D Automatic Movement
Detection by Means of Standard TV Cameras. IEEE Trans Biomed Eng 1990,
37(12):1221-5.
18. Ferrante S, Pedrocchi A, Ferrigno G, Molteni F: Cycling induced by
functional electrical stimulation improves the muscular strength and the
motor control of individuals with post-acute stroke. Eur. J. Phys. Rehabil.
Med 2008, 44:159-67.
19. Tang AM, Kacher DF, Lam EY, Wong KK, Jolesz FA, Yang ES: Simultaneous
Ultrasound and MRI System for Breast Biopsy: Compatibility Assessment
and Demonstration in a Dual Modality Phantom. IEEE Trans.Med.Imaging
2008, 27:247-254.
20. Kaufman L, Kramer DM, Crooks LE, Ortendahl DA: Measuring signal-to-
noise ratios in MR imaging. Radiology 1989, 173:265-267.
21. Baroni G, Pedrocchi A, Ferrigno G, Massion J, Pedotti A: Static and dinamic
postural control in long-term microgravity: evidence of a dual
adaptation. J. Appl. Physiol 2001, 90:205-215.
22. Rorden C, Brett M: Stereotaxic Display of Brain Lesion. Behav. Neurol 2000,
12:191-200.
23. Friston KJ, Williams S, Howard R, Frackowiak RS, Turner R: Movement-
related effects in fMRI time-series. Magn Reson Med 1996, 35:346-355.
24. Johnstone T, Walsh KSO, Greischar LL, Alexander AL, Fox AS, Davidson RJ,
Oakes TR: Motion correction and the use of motion covariates in
multiple-subject fMRI analysis. Hum Brain Mapp 2006, 27:779-788.
25. Ward NS, Brown MM, Thompson AJ, Frackowiak RRJ: Neural correlates of
outcome after stroke: a cross-sectional fMRI study. Brain 2003,
126:1430-1448.
26. Mazziotta J, Toga A, Evans A, Fox P, Lancaster J, Zilles K, Woods R, Paus T,
Simpson G, Pike B, Holmes C, Collins L, Thompson P, MacDonald D,
Iacoboni M, Schormann T, Amunts K, Palomero-Gallagher N, Geyer S,
Parsons L, Narr K, Kabani N, Le Goualher G, Boomsma D, Cannon T,
Kawashima R, Mazoyer B: A Probabilistic Atlas and Reference System for
the Human Brain: International Consortium For Brain Mapping (ICBM)
Philos. Trans. R. Soc. Lond. Ser. B Biol. Sci 2001, 356:1293-1322.
27. Alkadhi H, Crelier GR, Boendermaker SH, Golay H, Hepp-Reymond MC,
Kollias SS: Reproducibility of Primary Motor Cortex Somatotopy Under
Controlled Conditions. Am. J. Neuroradiol 2002, 23:1524-1532.
28. Lancaster JL, Rainey LH, Summerlin JL, Freitas CS, Fox PT, Evans AE,
Toga AW, Mazziotta JC: Automated labeling of the human brain: A
preliminary report on the development and evaluation of a forward-
transform method. Hum Brain Mapp 1997, 5:238-242.
29. Calautti C, Naccarato M, Jones PS, Sharma N, Day DD, Carpenter AT,
Bullmore ET, Warburton EA, Baron JC: The relationship between motor
deficit and hemisphere activation balance after stroke: a 3T fMRI study.
NeuroImage 2007, 34:322-331.
30. Heiland S: From A as in Aliasing to Z as in Zipper: Artifacts in MRI
(Review). Clin Neuroradiol 2008, 18:25-36.
31. Scarff CJ, Reynolds A, Goodyear BG, Ponton CW, Dort JC, Eggermonta JJ:
Simultaneous 3-T MRI and high-density recording of human auditory
evoked potentials. NeuroImage 2004, 23:1129-1142.
32. Glover GH, Law CS: Spiral-In/Out BOLD fMRI for increased SNR and
reduced susceptibility artifacts. Magn Reson Med 2001, 46:515-522.
Casellato et al. Journal of NeuroEngineering and Rehabilitation 2010, 7:49
/>Page 16 of 17
33. Chaudhary UJ, Kokkinos V, Carmichael DW, Rodionov R, Gasston D,
Duncan JS, Lemieux L: Implementation and evaluation of simultaneous
video-electroencephalography and functional magnetic resonance
imaging. Magn Reson Imaging 2010.
34. Mullinger K, Debener S, Coxon R, Bowtell R: Effects of simultaneous EEG
recording on MRI data quality at 1.5, 3 and 7 tesla. Int J. Psychophysiol
2008, 67:178-188.
35. Lotze M, Erb M, Flor H, Huelsmann E, Godde B, Grodd W: fMRI evaluation
of somatotopic representation in human primary motor cortex.
NeuroImage 2000, 11:472-481.
36. Luft AR, Forrester L, Macko R, Smith GV, Whitall J, Macko RF, Schulz JB,
Hanleya DF: Brain Activation of Lower Extremity Movement in
Chronically Impaired Stroke Survivors. NeuroImage 2005, 26:184-194.
37. Hanakawa T, Immisch I, Toma K, Dimyan MA, Van Gelderen P, Hallet M:
Functional properties of brain areas associated with motor execution
and imagery. J Neurophysiol 2003, 89:989-1002.
38. Waldvogel D, van Gelderen P, Ishii K, and Hallett M: The Effect of
Movement Amplitude on Activation in Functional Magnetic Resonance
Imaging Studies. J. Cereb. Blood Flow Metab 1999, 19:1209-1212.
39. Diciotti S, Gavazzi C, Della Nave R, Boni E, Ginestroni A, Paoli L, Cecchi P, De
Stefano N, Mascalchi M: Self-paced frequency of a simple motor task and
brain activation. An fMRI study in healthy subjects using an on-line
monitor device. NeuroImage 2007, 38:402-412.
40. Lutz K, Koeneke S, Wustenberg T, Jancke L: Asymmetry of cortical
activation during maximum and convenient tapping speed. Neurosci. Lett
2005, 373:61-66.
41. Sadato N, Ibanez V, Campbell G, Deiber MP, Le Bihan D, Hallet M:
Frequency-dependent changes of regional cerebral blood flow during
finger movements: functional MRI compared to PET. J. Cereb. Blood Flow
Metab 1997, 17:670-679.
42. Francis S, Lin X, Aboushoushah S, White TP, Phillips M, Bowtell R,
Constantinescu CS: fMRI analysis of active, passive and electrically
stimulated ankle dorsiflexion. NeuroImage 2009, 44:469-479.
doi:10.1186/1743-0003-7-49
Cite this article as: Casellato et al.: Simultaneous measurements of
kinematics and fMRI: compatibility assessment and case report on
recovery evaluation of one stroke patient. Journal of NeuroEngineering
and Rehabilitation 2010 7:49.
Submit your next manuscript to BioMed Central
and take full advantage of:
• Convenient online submission
• Thorough peer review
• No space constraints or color figure charges
• Immediate publication on acceptance
• Inclusion in PubMed, CAS, Scopus and Google Scholar
• Research which is freely available for redistribution
Submit your manuscript at
www.biomedcentral.com/submit
Casellato et al. Journal of NeuroEngineering and Rehabilitation 2010, 7:49
/>Page 17 of 17