Báo cáo hóa học: " Applying a brain-computer interface to support motor imagery practice in people with stroke for upper limb recovery: a feasibility study" docx
Bạn đang xem bản rút gọn của tài liệu. Xem và tải ngay bản đầy đủ của tài liệu tại đây (780.4 KB, 17 trang )
RESEARC H Open Access
Applying a brain-computer interface to support
motor imagery practice in people with stroke for
upper limb recovery: a feasibility study
Girijesh Prasad
1*
, Pawel Herman
1
, Damien Coyle
1
, Suzanne McDonough
2
, Jacqueline Crosbie
2
Abstract
Background: There is now sufficient evidence that using a rehabilitation protocol involving motor imagery (MI)
practice in conjunction with physical practice (PP) of goal-directed rehabilitation tasks leads to enhanced functional
recovery of paralyzed limbs among stroke sufferers. It is however difficult to confirm patient engagement during
an MI in the absence of any on-line measure. Fortunately an EEG-based brain-computer interface (BCI) can provide
an on-line measure of MI activity as a neurofeedback for the BCI user to help him/her focus better on the MI task.
However initial performance of novice BCI users may be quite moderate and may cause frustration. This paper
reports a pilot study in which a BCI system is used to provide a computer game-based neurofeedback to stroke
participants during the MI part of a protocol.
Methods: The participants included five chronic hemiplegic stroke sufferers. Participants received up to twelve
30-minute MI practice sessions (in conjunction with PP sessions of the same duration) on 2 days a week for 6
weeks. The BCI neurofeedback performance was evaluated based on the MI task classification accuracy (CA) rate.
A set of outcome measures including action research arm test (ARAT) and grip strength (GS), was made use of in
assessing the upper limb functional recovery. In addition, since stroke suffere rs often experience physical tiredness,
which may influence the protocol effectiveness, their fatigue and mood levels were assessed regularly.
Results: Positive improvement in at least one of the outcome measures was observed in all the participants , while
improvements approached a minimal clinically important difference (MCID) for the ARAT. The on-line CA of MI
induced sensorimotor rhythm (SMR) modulation patterns in the form of lateralized event-related desynchronization
(ERD) and event-related synchronization (ERS) effects, for novice participants was in a moderate range of 60-75%
within the limited 12 training sessions. The ERD/ERS change from the first to the last session was statistically
significant for only two participants.
Conclusions: Overall the crucial observation is that the moderate BCI classification performance did not impede
the positive rehabilitation trends as quantified with the rehabilitation outcome measures adopted in this study.
Therefore it can be concluded that the BCI supported MI is a feasible intervention as part of a post-stroke
rehabilitation protocol combining both PP and MI practice of rehabilitation tasks. Although these findings are
promising, the scope of the final conclusions is limited by the small sample size and the lack of a control group.
Background
Over 20 M people suffer from stroke annually world-
wideandupto9Mstrokesurvivorsmaysufferfrom
permanent upper limb paralysis, which may signific antly
impact their quality of life and employability [1]. There
is now sufficient evidence that that physical practice
(PP) (i.e. real movement) along with motor imagery
(MI) practice (often called mental practice) of a range of
therapeutic (o r motor) tasks can lead to improvem ents
in reaching, wrist movements and isolated movements
of the ha nds and fingers and object manipulation of the
impaired upper limb [2-4] and although this evidence is
promising it is still limited in many respects [5]. One of
the challenges of using MI practice is confirming patient
* Correspondence:
1
Intelligent Systems Research Centre (ISRC), University of Ulster, Magee
Campus, Derry, N. Ireland, UK
Full list of author information is available at the end of the article
Prasad et al. Journal of NeuroEngineering and Rehabilitation 2010, 7:60
/>JNER
JOURNAL OF NEUROENGINEERING
AND REHABILITATION
© 2010 Prasad et al; licensee BioMed Central Ltd. This is an Op en Acc ess article distributed under the terms of the Creativ e Commons
Attribution License ( which permits unrestricted use, distribution, and reproduction in
any medium, provide d the origin al work is properly cited.
engagement on-line so as to help him/her undertake MI
with sufficient focus. A direct non-invasive approach to
confirming MI is to assess the modulation of brainwaves
obtained from the continuous measurement of electroen-
cephalography (EEG) signals during the MI practice as
part of a brain-computer interface (BCI). Although EEG-
based BCI approach devised based on the detection of
EEG correlates of MI (measured as MI task classification
accuracy (CA)) has been widely investigated in healthy
subjects [6,7], it is yet to be systematically explored in
stroke sufferers. Also, it has been found that a substan-
tially large proportion of subjects may not be very good
at performing MI, resulting in a moderate CA obtained
with an MI-based BCI system in initial few sessions [8].
But, through practice over several sessions, most su bjects
may significantly improve their performance [9]. It is
however not known how this initial moderate level of
performance affects rehabilitation outcomes, especially if
the subjects perform MI tasks with the support of neuro-
feedback from a BCI with moderate CA. A moderate
accuracy feedback may frustrate the subject and thus
cause more of a distraction rather than assistance in per -
forming MI of rehabilitative tasks. There is also a con-
cern that with an inaccurate feedback the subject may be
executing MI practices that affect an uninten ded brain
hemisphere and thus hinder the recovery process.
Very few EEG-based BCI studies report involvement of
stroke sufferers [10-13]. A small set of preliminary results
in [11] demonstrates that a single-trial analysis represents
an appropriate method to detect task-related EEG pat-
terns in stroke patients. It is also reported that during
physical motor execution as well as MI, mainly the fre-
quency components lower b (16-22 Hz) and μ (9-14 Hz)
play an important role for an intact as well as a paretic
hand. In [10], an EEG BCI supported functional electrical
stimulation (FES) platform is reported with the aim of
training upper limb functions of a chronic stroke sufferer.
In this study, two chronic patients participated attaining
an error rate of BCI control less than 20%. However, no
evidence is reported that the BCI use resulted in any gain
in upper l imb recovery. The use of magnetoencephalo-
grap hy (MEG) based BCI by patients with chronic stroke
for controlling a hand orthosis attached to the paralysed
hand is re ported by Buch et al. [14]. In thi s study, the MI
induced modulations in 10-15 Hz sensorimotor rhythms
(SMRs) were quantified to serve as features for devising
the BCI. Patients received visual and kinaesthetic feed-
back of their brain activity. 90% of the patients were able
to voluntarily control the orthosis in 70-90% of the trials
after 20 hours of training. In the course of training the
ipsilesional brain activity increased, and spasticity
decreased significantly. However, hand movement with-
out the orthosis did not improve, i.e. no functional recov-
ery was observed. In [12,13], a controlled trial was
reported involving 12 stroke patients undertaking a robot
supported upper extremity exercises over a period of
20 weeks. A BCI driven switch was used to switch on the
exercise sessions. No significantly higher increase in
rehabilitation outcome measures was a chieved with the
BCI supported protocol when compared to that using
robots alone. Thus no BCI supported study consisted of
a rehabilitation protocol involving a combination of PP
and MI practice. Mostly, an MI BCI has been used as a
switch to initiate the rehabilitation exercise and then the
actual exercise involving motor execution is performed
with an external robotic support.
The research question (or hypothesis) for the study
presented in this paper was whether it is feasible to
make use of an EEG-based BCI generated neurofeed-
back to support patient’s engagement during an MI
practice performed as part of a post-stroke rehabilitation
protocol combining both PP and MI practice. To this
end, the study was aimed at determining recruitment
adherence and drop-out issues; integrating an EEG-
based BCI with the MI-based rehabilitation protocol;
piloting of the methodological and intervention proce-
dures; assessing qualitative effects of the intervention on
participants; and identifying most appropriate motor
outcomes for monitoring incremental motor recovery.
As there was no prior knowledge available about
the interventions to be used, it was thought vital in
the initial stage to place major emphasis on testing the
acceptability and adher ence with the intervention before
planning a large-scale controlled trial.
Methods
Selection of Participants
The aim of the study was to work towards devising a
rehabilitation protocol t hat helps in functional recovery
of upper limb paralysis of stroke sufferers whose motor
cortex has stopped reorganizing. As an auto-recovery is
normally not expected beyond the first year, any indivi-
duals with some degree of upper extremity motor impair-
ment and who had sustained a stroke at least a year
before, were considered for inclusion onto the study.
Potential participants were excluded if they were medi-
cally unstable at the time of assessment; had any history
of epilepsy; were unable to follow a two-step command;
showed any signs of confusion or neglect (evidenced by a
Hodgkinson mini-mental test score (HMMS)) [15] of less
than 7/10 and Star cancellation test (Star CT) score [16]
of less than 48/52 respectively (Table 1). Ethical approval
for the study was gained through the University of Ulster
Research Ethics committee, N Ireland.
Experimental Procedure
The experimental protocol involved a therapeutic regi-
men consisting of a treatment session that included
Prasad et al. Journal of NeuroEngineering and Rehabilitation 2010, 7:60
/>Page 2 of 17
both PP and MI practice of a therapeutic task. The task
was decided in consultation with the participants,
although most per formed or imagined hand clenching.
The session content was based on that described by
Weiss et al. [17]. Before the beginning of each session, a
trained researcher explained the task by using simple
instructions and showing a video of the sequence of
movements that should be performed with his/her own
hands. The MI consisted of imagining the performance
of motor sequences and kinaesthetic sensations asso-
ciated with it while holding the upper limbs still.
On reviewing the literature regarding the length of
therapy to stroke patients, it was observed that some-
what similar virtual reality (VR) mediated therapies were
most commonly administered three times per week for
1-1.5 hours over a 2-4 weeks period [18]. Taking into
account the logistics involved in participants travels,
laboratory preparations, and data processing and analy-
sis, it was decided to conduct 2 treatment sessions each
week for a total of 6 weeks. In each treatment session,
the participants first performed a sequence of PP and
then MI of the same. The participant started with
10 repetitions (or trials) with the unimpaired (or less
affected) upper limb followed by 10 repetitions with the
impaired (or more a ffected) limb for both PP and MI
parts of the session. This sequence was repeated with
both the PP and the MI parts of a session divided into 4
runs of 40 trials. Throughout the MI session, the partici-
pants sat relaxed on their chair with their eyes open.
From the second or third session onwards, the partici-
pants were provided with neurofeedback through the
EEG-based BCI during the MI part of the session only.
The neurofeedback was provided as part of a computer
game called “ball-basket” (explained later) in which a
ball falling at a constant speed from the top of the
screen to the bottom within a predefined interval of 4 s
during the time period of 3 s to 7 s o f a trial, was
required to be placed in a green target basket appearing
oneithertheleftortherightsideatthebottomofa
user window with the help of the MI of the respective
limb. The feedback showed the direc tion of the ba ll
movement as a result of the patient’s MI in response to
the target basket appearance. The participants were
advised to keep focusing on their left or right arm/hand
MI tasks, so as to manoeuvre the ball towards the green
basket, while constantly maintaining the balls on the
same side. The total length of the trial varies between 8
and10s.Asaresult,thereisarandomgapof1to3s
during which the screen remains blank and participants
are asked to relax.
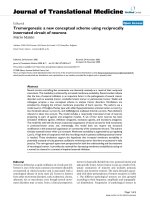
Design of the EEG-based BCI and Neurofeedback
A block-diagram representation of the EEG-based BCI
system is shown in the Figure 1a. The BCI was designed
using the data recorded from two bipolar EEG channels
around C3 and C4 locations (two electrodes placed 2.5
cm anterior and posterior to C3/C4) based on the 10/20
international system. The EEG was recorded with a g.
BSamp amplifier system f rom g.tec, Graz, Austria. In
addition, an EEG cap with Ag/AgCl electrode assembly
from Easycap™ was utilized. EMG signals from biceps
were also recorded to monitor whether there were any
actual physical movements during the MI practice.
MATLAB Simulink based BCI software developed in-
house was employed in devising various stages of the
BCI and neurofeedback system. In the preprocessing
stage, the EEG signal was band-pass filtered between 0.5
and 30 Hz with the 50 Hz notch. The bio-signals were
sampled at 500 Hz. The BCI closed-loo p was realized
through the ne urofeedback provided in a compu ter
game-like environment using the ball-basket game (Fig-
ure 1b). As shown in Figure 1b, red (non-target) and
green (target) rectangles (or baskets) were displayed at
the bottom of the user window at the beginning of each
trial interval. After 2 s f rom the beginning of a trial, a
ball appeared on the top of the user window and a beep
sound informed the user to start attempting to man-
oeuvre the ball by means o f his/her left/right arm/hand
MI corr esponding to the horizontal location of the
green target basket (i.e. l eft vs. right). The game’s objec-
tive is to place the b all in the target basket (green rec-
tangle). During the trial period, the scalp EEG data is
continuously recorded.
It is known that when the sensorimotor area of the
brain is activated during the imagination of upper limb
movement, there often occurs contralateral attenuation
Table 1 Subject Baseline Demographics
Participants Age (y) Gender Impaired side Dominant side Time since stroke (m) HMMS STAR CT
P1 (091153) 55 M L R 48 10/10 52/52
P2 (230361) 47 F L R 41 10/10 52/52
P3 (210151) 57 M L R 15 8/10 52/52
P4 (250345) 63 M R R 20 10/10 52/52
P5 (231237) 71 M R R 16 10/10 52/52
MEAN (± SD) 58.6 (8.98) 28(15.4)
Prasad et al. Journal of NeuroEngineering and Rehabilitation 2010, 7:60
/>Page 3 of 17
of the μ (8-12 Hz) rhythm an d ipsilateral enhancement
of the central b (18-25 Hz) oscillations [6,19,20]. These
processes occur due to the neurophysiological mechan-
isms of the so-called event-related desynchronization
(ERD) and event-related synchronization (ERS) [6,7,19].
The exact EEG manifestations and frequency bands of
ERS and ERD may vary from subject to subjec t. Subject
specific ERD and ERS patterns, i.e. estimates of the
spectral power of C3 an d C4 signals within the adjusted
μ and b bands, providing best separability between left
and right hand movement imaginations, were therefore
acquired in this w ork from the recorded trials in the
feature extract ion stage. To this end, power spectral
density (PSD) was parametrically estimated from the fre-
quency response of the autoregressive model (of arbi-
trary order n ), which was fitted to the EEG signal by
solving Yule-Walker equations [21]. These linear equa-
tions relate the parameters of the autoregressive model,
a
1
a
n
, with the autocorrelation s equence g( k)(k is the
time lag).
kk knkn
n
()
=−+
()
++ −+
()
=
1
11 , , ,
The model parameters were found using Levinson-
Durbin recursion by minimising the forward prediction
error in the least-square sense. The feature separability
was quantified off-li ne using the cross-validation esti-
mate of the CA obtained with a linear discriminant ana-
lysis approach.
Designing the Feature Classifier
The EEG features extracted from the 1 s long sliding
window were exploited as inputs to a two-class fuzzy
logic system classifier [22] in the feature translation
stage that infers the class of the associated MI. The clas-
sifier output, updated every data sample, was then
directly used as the feedback signal in the ball-basket
game allowing for controlling the amplitude of the hori-
zontal component of the ball’s movement (the
amplitude was proportional to the classifier’s output sig-
nal). The vertical component of the movement was kept
at a constant value so that the ball could steadily cover
the distance from the top to the bottom of the user win-
dow within a predefined interval of 4 s (i.e. from 3 s to
7 s).
The classi fier was designed off-line on the EEG
features extracted from the data set recorded in the pre-
vious on-line sessions. A type-2 fuzzy logic classifier was
adopted in this study [23]. Analogously to classical
type-1 fuzzy systems, it is defined in terms of a fuzzy
rule-base and an inf erence mechanism that allows f or
processing fuzzy information to eventually generate the
system output. However, unlike in conventional fuzzy
models, rules are represented as type-2 fuzzy relations
with extended (interval type-2) fuzzy sets [24], whic h
provides scope for more robust handling of the variabil-
ity (predominantly, long- and short-term non-stationar-
ity) of the EEG signal dynamics. A template of a
Mamdani type-2 fuzzy rule exploited in this work is the
following [23]:
IF is AND AND is THEN isXA XA classC
nn11
.
Fuzzy sets X
i
( i = 1, ,n) are conventionally fuzzified
components (Gaussian type-1 fuzzy sets) of an input
feature vector x (spectral correlates of the ERD/ERS
extracted from the μ/b bands of C3/C4 EEG channels).
A
i
s denote type-2 fuzzy sets and C is the centroid of
the consequent type-2 fuzzy set representing the class
that the input feature vector is assigned to. In interval
type-2 fuzzy systems, the outcome is represented in
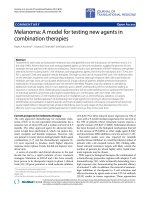
terms of intervals (cf. Figure 2b). In consequence, the
system has more degrees of freedom in the description
of its fuzzy sets.
Fuzzy sets are determined in the fuzzy classifier’s
design process. Initially, clustering is performed on the
(a) (b)
Figure 1 An illustration of a Brain-Computer Interface: (a) Main components of a BCI. (b) Timings of a ball-basket game paradigm.
Prasad et al. Journal of NeuroEngineering and Rehabilitation 2010, 7:60
/>Page 4 of 17
extracted EEG spectral power features (in μ and b
bands) using the mapping-constrained agglomerative
clustering. Next, prototype classical type-1 fuzzy rules
were intialised based on clustering outcome. In particu-
lar, each cluster served as a prototype for one Mam-
dani-type fuzzy rule. Each premise was constructed
using Gaussian membership functions with the centres
and widths corresponding to the cluster mean and its
estimated spread, respectivel y, projected on the data
axes. The crisp consequent was randomised between -1
and 1 (the interval borders denoting left and right MI
classes, respectively). Rather small sized systems (4-8
rules) were preferred to minimize over-fitting effects
and satisfy real-time computational constraints in the
recall phase [22]. For the purpose of easy visualization,
an example of the projection of a tw o-dimensional clus-
ter of data belonging to class C on the axes correspond-
ing to respective feature vector components (TFf
i
,for
the two-dimensional example i={1,2}) and the resulting
type-1 fuzzy rule (with Gaussian fuzzy sets A
i
defined by
the means m(i)=m
INP
(i) and standard deviations s(i)
=s
INP
(i) in the rule antecedent) are shown in Figure 2a.
(
a
)
(b)
(c) (d)
-2 0 2 4
0
0.5
1
-2 0 2
0
0.5
1
-2 0 2 4
0
0.5
1
-2 0 2
0
0.5
1
0 0.5 1
0
0.2
0.4
0.6
0.8
1
-1 0 1
0
0.5
1
-2 0 2 4
0
0.5
1
-2 0 2
0
0.5
1
-2 0 2 4
0
0.5
1
-2 0 2
0
0.5
1
0 0.5 1
0
0.2
0.4
0.6
0.8
1
-1 0 1
0
0.5
1
-2 0 2 4
0
0.5
1
-2 0 2
0
0.5
1
-2 0 2 4
0
0.5
1
-2 0 2
0
0.5
1
0 0.5 1
0
0.2
0.4
0.6
0.8
1
-1 0 1
0
0.5
1
-2 0 2 4
0
0.5
1
-2 0 2
0
0.5
1
-2 0 2 4
0
0.5
1
-2 0 2
0
0.5
1
0 0.5 1
0
0.2
0.4
0.6
0.8
1
-1 0 1
0
0.5
1
(1)
2
A
(1)
3
A
(1)
1
A
(1)
4
A
(1)
C
(2)
2
A
(2)
3
A
(2)
1
A
(2)
4
A
(2)
C
(3)
2
A
(3)
3
A
(3)
1
A
(3)
4
A
(3)
C
(4)
2
A
(4)
3
A
(4)
1
A
(4)
4
A
(4)
C
Figure 2 A Type-2 Fuzzy Classifier: (a) A two-dimensional cluster in the feature space and the corresponding T1 fuzzy rule. (b) Footprint of a
Gaussian interval type-2 fuzzy set with uncertain mean mÎ[m
1
,m
2
]. (c) Illustrative comparison of a one-rule T2FLS and T1FLS-based classifiers
(Δm and Δc define the initial bounds of uncertainty modeled in the system. (d) Structure of a sample T2 fuzzy rule base (the domain of the
antecedents’ membership functions is normalised).
Prasad et al. Journal of NeuroEngineering and Rehabilitation 2010, 7:60
/>Page 5 of 17
In the next step, type-1 fuzzy ru les are transforme d into
their type-2 counterparts by substituting type-1 fuzzy
sets by Gaussian interval type-2 set s (here, with uncer-
tain mean). In particular, the so-called footprint of each
interv al type-2 fuzzy set (cf. Figure 2b) was obtained by
applying the following set of extension formulae:
mm mmm m
cm cc m c
INP INP
left OUT right OUT
12
=− =+
=− =+
;;
;;
where, m
INP
defines the centre of each corresponding
Gaussian type-1 fuzzy set in the premise, and m
OUT
serves as the crisp output of the corresponding fuzzy rule.
The process of deriving and initialising type-2 fuzzy
classifier is illustrated in Figure 2c, which compares only
one-rule systems with single antecedent. As can be seen,
type-1 fuzzy set A is replaced with type-2 fuzzy set
A
Analogously, the crisp C centroid of type-1 rule conse-
quent is transformed into the interval centroid
C
.In
the final stage of designing a type-2 rule-based system,
which amounts to positioning and adjusting the spread
of Gaussian interval type-2 fuzzy sets in the antecedents,
and adjusting the consequents’ inter val centroi ds, a gra-
dient-based learning algorithm was employed with the
mean-square error criter ion. Hence, the initialised fuzzy
sets were fine tuned to optimise the system’s classifica-
tion performance. The example type-2 rule base is
shown in Figure 2d in the form of footprints of the
antecedent fuzzy sets and centroids of the correspond-
ing consequents. The detailed description of the algo-
rithm and the structure of the type-2 fuzzy classifier can
be found in [23] . For a thorough discussion of type-2
fuzzy sets and systems it is recommended to refer to
[24].
Quantification of SMR modulation effects during
BCI-supported MI practice
The EEG data and the classifier’s output recorded over
multiple sessions were also analyzed o ff-line to inv esti-
gate neurophysiological effects of BCI-supported MI
practice and identify their correlatio ns with o utcome
measures. In particular, the ERD and ERS phenomena
associated with MI were main target. To this end, the
spectral content of EEG trials recorded over both con-
tralateral and ipsilateral h emispheres (w.r.t. the MI)
before the cue onset (reference period) and during the
MI task was analyzed in each session inclu ding the first
one without feedback. Trials involving artefacts, espe-
cially eye blinks in the reference interval, were excluded.
Spectral analysis was performed using the Yule-Walker
PSD approach within the adjusted μ and b frequency
bands (follo wing a similar method as used in the on-line
computation). These adjustments were carried out to
maximize the dynamic range of within-trial power fluc-
tuations correspo nding to SMR modulations. The resul-
tant reactive frequency bands were in a strong
agreement with the outcome of analogous optimization
from the perspective of BCI performance.
TheERD/ERSisdefinedhereastheratioofsignal’s
energy with in a specified frequency band f (μ or b) mea-
sured during the MI task (
E
MI
f()
) and that during the
reference period (
E
ref
f()
) [9]:
ERD ERS/.
()
()
f
MI
f
ref
f
E
E
=
ERD occurs, if the ratio is less than 1, otherwise if it is
greater than 1, the phenomenon is referred to as ERS.
ERD/ERS is u sually evaluated as a function of time
using a sliding window o ver the trial duration. Similar
approach was adopted in this work with the window
length of 2 s keeping the reference period from 0.5 s to
2.5 s. For estimating the overall effects, ERD/ERS was
evaluated first for each trial and then averaged within a
session (separately for left a nd right hand MI trials).
The resultant time courses of the averaged ERD/ERS
were then quantified for μ and b bands separately.
Rehabilitation Outcome Measures
For this feas ibility study we measured the following out-
comes: Rate of attendance (%); Upper limb movement
and motor control: Motricity Index (McI) [25], Action
Research Arm Test (ARAT) [26], Ni ne Hole Peg T est
(NHPT) [27] and Grip Strength (GS) [28]; Fatigue and
mood [29]; and Qualita tive Feedback. All outcomes
were recorded by the same independent resear cher who
was trained in their use prior to the commencement of
the study. Unless stated otherwise, outcomes were
recorded at baseline (i.e. time-point 1 falling in the week
before the intervention began (W0)), at six separate
time points along with the 2
nd
treatment session every
week during the six week inte rvention period (W1 to
W6), and at the follow up assessment approximately
one week later (i.e. time-point 8 falling in the week fol-
lowing the intervention period (W7)).
Upper limb movement and motor control
The upper extremity secti on of McI was used in order to
assess motor impairments. The test consists of a series of
movement tasks completed in the sitting position. The
tests are graded on a scale of 1-100. In a similar manner to
the Medical Research Council scale for muscle strength,
the test involves grading strength depending on the indivi-
dual’s ability to activate a muscle group, by moving the
relevant limb through its available joint range of motion
while re sisting a force applied b y the exa miner [25].
Prasad et al. Journal of NeuroEngineering and Rehabilitation 2010, 7:60
/>Page 6 of 17
ARAT, first described by Lyle and co-authors [26] is a
commonly used m easure to assess upper-extremity
functional limitations in individuals with cerebral corti-
cal injury. The following apparatus is required in order
to administer the t est: a chair and table, woodblocks, a
cricket ball, a sharpening stone, two different sizes of
alloy tubes, a washer and bolt, two glasses, a marble and
a 6 mm ball-bearing. The ARAT uses an ordinal scale
including 19 separate items or movement tasks. Each
task is graded with 0 indicating no movement and 3 for
full or normal movement. These 19 items a re grouped
into gr oss motor ( 9 points), grasp (18 points), grip
(12 points) and pinch (18 points) tasks, with a maximum
score of 57 points. A minimal clinically important differ-
ence (MCID) for ARAT has been set as 5.7 points [30].
NHPT was used to assess fine manual dexterity [27].
The apparatus required for the test includes nine pegs
(7 mm diameter, 32 mm length) and a wooden board with
nine holes slightly larger than the pegs placed 32 mm
apart. Participants were instructed to pick up one peg at a
time with the affected arm and place them into the holes
as quickl y as possible. The time taken for the participant
to place the nine wooden dowels into nine holes on a
board and to then remove them was recorded in seconds.
A maximum test time of 120 seconds was allowed for
each test. When a participant was unable to complete the
test in this time, the number of dowels placed and
removed was recorded instead. To allow for the different
recording methods a six point scale was constructed for
thepurposesofthestudy(Table2).However,anMCID
has not been established for the NHPT.
Dynamometry is accepted as a simple and reliable
method for mea suring muscle strength defi cits after
stroke. While GS is used to directly describe strength of
the h and, it may also indicate the level of overall upper
extremity strength [28]. Here the Baseline dynamometer
(White Plains, New York 10602) was used with one
measurement recorded at each time point to limit the
effects of fatigue. Comparisons of handgrip strength
measurements with upper limb functional tests suggest
that failure to recover measurable grip strength before
twenty four days is associated with the absence of useful
arm function at three months [31].
Fatigue and Mood
Among stroke sufferers, fatigue is frequent and often
severe even late after stroke [29]. In this study, fatigue
was c onsidered in a limited sense that the participa nts
may get tired and loose attention during the session.
Undergoingthetherapysessionsmaymakethefeeling
of tiredness much worse. To monitor the influence of
fatigue on the effectiveness of the therapy, the feeling of
fatigue was assessed. It involved com pleting a 10 cm
Visual Analogue Scale (VAS) [29,32]. The scale was
marked as “No fatigue” at one end and ‘Worst fatigue
imaginable’ at the other. As fatigue and mood are often
correlated it was decided to asses each participant’s
mood during the intervention period. The mood was
also monitored by completing a 10 cm VAS. For mood,
the scale was marked as “No depression” at one end and
‘AsbadasIcouldfeel’, at the other. The VAS scales
were recorded twice in the week before the intervention,
twice per week during the interventi on period and once
in the follow-up week, resulting in 15 time-points.
Scope of Data Analysis
Since this was a feasibility study involving a small num-
ber of subjects with no control group for a limited per-
iod of time, significance tests on the data could not be
performed for any of the rehabilitation outcome mea-
sures. Treatment effects were assessed on a case by case
basis and group mean outcome scores were computed.
Adherence levels and any difficulties experienced by the
participants or research staff were reported. This may be
used to modify the interventions in a larger future trial.
For each participant however, EEG data was recorded
over up to 12 treatment sessions and each session con-
sisted of 160 trials having MI related EEG data of 4 s
sampled at 500 Hz. Such a large data set facilitated car-
rying out subject-wise significant test to find whether
there was statistically significant difference between
ERD/ERS o ccurrences in the first and the last session.
It also faci litated undertaking following correlation
analyses.
• ERD/ERS vs CA for both left and right hand MI
separately
• ERD/ERS vs rehabilitation outcomes measures.
Results
Participants
26 participants were screened for eligibility for this
study, of this number, five met the inclusion criteria and
their demographics are displayed in Table 1. The main
reasons for exclusion from this study were length of
Table 2 Ordinal 6 Point Grading Scale for the Nine Hole
Peg Test
NHPT OUTCOME SCORE
0-30 seconds to complete 6
31-60 ““ 5
61-120 ““ 4
7-9 pegs in 2 min 3
4-6 pegs ““ 2
1-3 pegs ““ 1
0 pegs and/or void test 0
Prasad et al. Journal of NeuroEngineering and Rehabilitation 2010, 7:60
/>Page 7 of 17
time since stroke greater than 5 years, and co-existing
cognitive impairment. The mean age of included partici-
pants was 59 years, with four males and one female.
Three had experienced a right sided stroke (i.e. left
hand side imp airment), two left sided, and all were right
hand dominant. The time since stroke was variable, ran-
ging from 15-48 months, all showed good cognitive
function and no perceptual difficulties.
Adherence
The attendance rate was surprisingly high for this small
group of participants given the time consuming nature
of the intervention, which took on average 2 hours per
session. From a patient’s perspective adherence was very
high, however due to technical problems with the
recording equipment, it was necessary to cancel some of
the sessions so the overall level of attendance was 100%
for four individuals, and 92% (11/12) for one participant.
BCI Neurofeedback Performance
The neurofeedback was provided to the study partici-
pants in real-time using the aforementioned fuzzy rule-
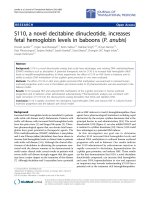
based BCI classifier. The BCI performance was evaluated
based on the MI task classification accuracy (CA) rates
obtained during on-line system use. The maximum CAs
reported in separate runs were averaged within each ses-
sion (four 40-trial runs) for ever y participant. These CA
values are plotted in Figure 3. The stroke participants
were novice BCI users. The session CA values are in the
range 60-75%. This moderate CA range obtained with
stroke patients is commonly observed in novice BCI
users. In a previous study, using a similar BCI system
design with the same ball-basket feedback paradigm,
trials were also conducted on six healthy novice partici-
pants over t en sessions. The se participants achieved a
CA range of 69.2 ± 4.6% [22], w hich is very similar to
that of stroke patients. It is also to be noted that a simi-
lar CA variation range was also observed in [14] in the
first 10 sess ions, where 8 stroke sufferers participated in
an MEG based BCI study. With regard to the course of
the CA statistics over experimental sessions, some fluc-
tuations were observed for every participant. This ten-
dency is characte ristic of early stages of learning how to
control BCI by novice users. The effect of learning gain
on the CA performance due to undertaking MI practices
for up to 12 sessions is however insignificant. It should
also be noted that no follow-up evaluation was con-
ducted to examine whether this trend corresponds with
other outcome measures.
In or der to analyse neurophysiological effects of BCI-
supported MI practice, the ERD and ERS phenomena
associated with MI were mainly targeted. The focus in
theanalysisofERD/ERSphenomenonwasonthe
quantification of the expected EEG desynchronization
within the μ band (ERD
μ
) mainly on the contralateral
side w.r.t. the MI task (i.e. in C3 for right MI trials and
in C4 for left MI trials) and synchronization within the
b band (ERS
b
) mainly on the ipsilateral side. In addition,
the first non-feedback session and the last BCI session
were compared usin g t-test at a = 0.05. The ERD/ERS
ratios computed for all the participants are plotted in
Figure 4. It is to be noted that the ratios in the μ band
are r epresented as
ERD/ERS
μ
()xy
and that in the b band
as
ERD/ERS
β
()xy
,wherex may d enote the EEG channels
C3 or C4 and y may denote either left upper limb MI
(L) or right upper limb MI (R). The figure illustrates the
ERD/ERS ratios in the tuned μ band in part (a), and the
tuned b band in part (b) over all the EEG recording ses-
sions for all five p articipants. The followin g inferences
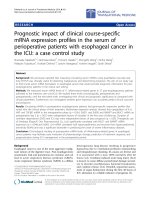
can be drawn from these plots.
• For P1, the significant drop in
ERD/ERS
(C3R)
μ
and
the enhancement of
ERD/ERS
(C3L)
β
are the clearest
observable trends for ERD/ERS ratios, especially
when the first non-feedback and the last BC I session
are compared.
• For P2, there is no conclusive evidence of a statis-
tically significant difference between the first and the
last session. However, the desynchronization within
the μ band was a dominant phenomenon throughout
all sessions.
• For P3, ERD/ERS did not show any significant
changes between the first and the last session. There
was a remarkable increase i n both
ERD/ERS
(C3R)
β
and
ERD/ERS
(C4R)
β
in the session 5 only. Interest-
ingly, this effect was not associated with any notice-
able changes in the CA for right MI trials.
• For P4, except for the first non-feedback session,
there was clear ERD within the μ band on both con-
tralateral and ipsilateral channels during left and
right MI trials. Rather unusually, desynchronization
was also prevalent within the b band. For all the
quantifiers, a significant drop from session 1 to ses-
sion 12 was observed (i.e. deeper ERD state of μ and
b rhythms).
• Fi nally, the ERD/ERS profiles for P5 demonstrated
high variability and no significant differences
between the first and the last session. It appears that
both μ and b rhythms obtained from contralateral
and i psilateral locations were synchronized (quanti-
fiers above 1) for most of the MI undertaken by P5.
Prasad et al. Journal of NeuroEngineering and Rehabilitation 2010, 7:60
/>Page 8 of 17
Thus, the inspection of Figure 4 suggests a high
degree of subject specificity in the evolution of ERD/
ERS correlates over the course of MI practice sessions.
Correlations between participants’ ERD/ERS and neu-
rofeedback performance were also examined to verify
the appropriateness of the features selection and classifi-
cation procedures. For each participant, Pearson’spro-
duct-moment correlation coefficients between the ERD/
ERS measures and the CA obtained for either left or
right MI trials, were computed over all the sessions with
feedback. The coefficients are listed in Table 3. It is
often expected that in all participants, the occurrence
and strength of certain c ombinations of the lateralized
ERD/ERS patterns (e. g., contralateral ERD
μ
and ipsilat-
eral ERS
b
observed in healthy subjects performing MI
tasks), would be strongly correlated to the degree of
recognition and thus discrimination of the two MI trial
types [9]. The analysis conducted in this work however
did not provide consistent evidence for such stereotypi-
cal correlations across all participants. More specifically,
the contralateral ERD
μ
effect was found to correlate
with the classification performance only for P1 and P2.
In particular, large negative co rrelation (r = -0.72)
between
ERD/ERS
(C3R)
μ
and the CA for right MI trials
(CA
(R)
) was found in the participant P1. Si milar
relationships were identified for the participant P2 with
the exception that the correlation involving
ERD/ERS
(C3R)
μ
was lower (r = -0.58). For the left MI
trials in P2, ho wever, the co ntralateral
ERD/ERS
(C4L)
μ
was positively correlated with the CA
(L)
. Other non-
stereotypical correlations of the ERD/ERS
μ
effects with
CAs included negative correlation (r = -0.61) between
ERD/ERS
(C4R)
μ
and CA
(R)
in P1, negative correlation
between
ERD/ERS
(C3L)
μ
and CA
(L)
(r = -0.68) indicating
ipsilateral EEG desynchronization within the μ band in
P4, and positive correlation (r = 0.66) between
ERD/ERS
(C4L)
μ
and CA
(L)
in P5. The latter case suggests
that the contralateral synchronization of the μ rhythm,
and not the desynchronization as in conventional cases
reported for healthy subjects [9], carried discriminatory
features for recognizing left MI trials in P5. As for the
MI-driven modulation of the EEG power within the b
band, t he correlations with the CA results also demon-
strated a range of subject-specific patterns. The ipsilat-
eral ERD/ERS
b
phenomena was found to consistently
contribute to the classification of the respective MI trials
only in P5. The results were then scrutinized in the
40.0
45.0
50.0
55.0
60.0
65.0
70.0
75.0
80.0
W2_3 W2_4 W3_5 W3_6 W4_7 W4_8 W5_9 W5_10 W6_11 W6_12
Time-point (Week_Session)
Classification Accuracy %
P1
P2
P3
P4
P5
mean
Figure 3 BCI Classification accuracies over the feedback sessions.
Prasad et al. Journal of NeuroEngineering and Rehabilitation 2010, 7:60
/>Page 9 of 17
Participant P1:
Participant P2:
Participant P3:
Participant P4:
Participant P5:
Figure 4 Quantification of synchroniz ed/desynchronized EEG activity within the adjusted μ and b bands over 12 re cordi ng sessions
for all participants:a)
ERD/ERS
(C3L)
μ
ERD/ERS
(C4L)
μ
,
ERD/ERS
(C3R)
μ
and
ERD/ERS
(C4R)
μ
b)
ERD/ERS
(C3L)
β
,
ERD/ERS
(C4L)
μ
,
ERD/ERS
(C3R)
β
, and
ERD/ERS
(C4R)
β
. The ratios in the μ band are represented as
ERD/ERS
μ
()xy
and that in the b band as
ERD/ERS
β
()xy
, where x may denote the EEG
channels C3 or C4 and y may denote either left upper limb MI (L) or right upper limb MI (R).
Prasad et al. Journal of NeuroEngineering and Rehabilitation 2010, 7:60
/>Page 10 of 17
context of stroke-related lateralized impairments that
the subjects suffered. However, no consistent trends for
this subject population were identified in this regard.
In general, the analysis of the correlations between the
strength of the MI induced lateralized ERD/ERS and the
BCI CA performance demonstrated subject specific pat-
terns. The ERD/ERS plots (cf. Figure 4) most certainly
demonstrated that the MI practices resulted in asym-
metric electrophysiological responses in frequency bands
associated with μ and b rhythms [33]. This suggests that
other discriminative ERD/ERS features in addition to
the conventional ones linked to contralateral ERD
μ
and
ipsilateral ERS
b
should also be included in the design of
feature selection and classification procedures. It is
therefore argued t hat the application of the proposed
computation al intelligenc e-based framework, implemen-
ted here with the use of type-2 fuzzy system, capable of
effective learning from data (consisting of both contral-
ateral and ipsilateral ERD/ERS features from μ and b
bands) to maximize the classification performance, is a
suitable approach in the c ontext of the objectives of
post-stroke MI practice.
Rehabilitation Outcomes
As seen in Figure 5a, two participants (P1 an d P5), both
with low initial scores at baseline, showed good
improvement in McI scores. The others showed no
change, but had greater scores at baseline, suggesting
that there may have been a ceiling effect towards the
hig her end of the scal e (Figure 5a). Across all t he parti-
cipants, there was a mean change of 6.2 (11.7%) w ith
respect to the mean score (53) recorded at baseline in
the week before the intervention began.
Out of the three participants (P2, P3 and P4) able to
complete the ARAT test (Figure 5b), all demonstrat ed
improvements in score, with two (P3 and P4) exceeding
the MICD of 5.7 points. Acro ss all the participants,
there was a mean change of 4.0 (18.0%) with respect to
the mean score (22.3) recorded at baseline in the week
before the intervention began. The mean change was
thus closely approac hing the ARAT MICD score. In a
similar study without BCI support reported in [3],
where 32 chronic stroke sufferers participated in a con-
trolled trial over 12 therapy sessions involving both PP
and M I practice, there was a m ean ARAT score
improvement of 7.8 (SD = 5.1) on the baseline mean
score of 18. In the current study, P2, P3 and P4 had
ARATscoreimprovementsof4.0,10.0and6.0respec-
tively and thus the improvements are in the similar
range as reported in [3].
Only two participants were able to complete the
NHPT test at all time-points (P2, P3, Figure 5c). The
participant P3 was able to do so within the 120 second
time period and perfo rmed the test c onsistently
through out the intervention period but then re turned to
baseline at the follow-up. The participant P4 could com-
plete some NHPT tasks only in the follow-up session.
Across all the participants, there was a mean change of
0.4 (33.3%) with respect to the mean score (1.6)
recorded at baseline in the week before the intervention
began.
All the five pa rticipants showed improvemen t in
dynamometer grip strength (GS) at some time-point
during the intervention period (Figure 5d). However,
two participants (P2 and P3) showed a loss of grip
strength towards the end of the intervention and
returned closer to base-line by the follow-up session.
The reasons for this finding are uncertain. Across all the
participants, there was a mean change of 4.4 (20.0%)
with respect to the mean score ( 22.2) recorded at base-
line in the week before the intervention began
In order to select a minimum number of outcome
measures so that incremental recovery could be moni-
tored across all participants, a Pearson’sproduct-
moment correlation coefficient ( r) was computed for
every possible pairing between left/right upper limb M I
induc ed ERD/ER S ratio in μ/b band and a rehabilit ation
outcome measure recorded over the whole intervention
period. Five sets of correlat ion coefficients are tabulated
in the columns of Table 4 correspond ing to five partici-
pants. The table includes only those rows of coefficients,
in which at least one coefficient has a value equal to or
more than 0.5, i.e. there is a large correlation between at
least one participant’s ERD/ERS ratio and an outcome
measure score. As seen in Table 4 a n associated ERD/
ERS ratio had large correlation with GS (r =0.77)and
McI (r = 0.61) for P1; ARAT (r = 0.50) and N HPT (r =
Table 3 Pearson’s product-moment correlation
coefficients for different possible pairings between a left/
right CA and a μ/b band ERD/ERS ratio. Symbol (*) marks
significant results (p <0.05)
P1 P2 P3 P4 P5
Left MI CA
(L)
vs
ERD/ERS
(C3L)
μ
0.21 0.81* -0.17 -0.68* 0.18
CA
(L)
vs
ERD/ERS
(C4L)
μ
0.27 0.88* -0.12 0.03 0.66*
CA
(L)
vs
ERD/ERS
(C3L)
β
-0.38 0.22 0.22 -0.46 0.05
CA
(L)
vs
ERD/ERS
(C4L)
μ
-0.43 0.14 0.30 -0.25 -0.33
Right MI CA
(R)
vs
ERD/ERS
(C3R)
μ
-0.72* -0.58* -0.09 -0.25 0.19
CA
(R)
vs
ERD/ERS
(C4R)
μ
-0.61* 0.03 -0.49* 0.05 -0.50
CA
(R)
vs
ERD/ERS
(C3R)
β
-0.36 -0.61* 0.18 0.26* 0.48*
CA
(R)
vs
ERD/ERS
(C4R)
β
-0.22 -0.52 -0.13 -0.12 0.51*
Prasad et al. Journal of NeuroEngineering and Rehabilitation 2010, 7:60
/>Page 11 of 17
0.50) for P2; ARAT (r = -0.61) and GS (r = -0.74) for
P3; ARAT (r = -0.69) for P4; and McI (r = -0.76) and
GS (r = -0.63) for P5. Since a ceiling effect was observed
in McI outcomes for some participants, ARAT and GS
(with underlined entries in Table 4) will be the best
choice for monitoring of incremental recovery across all
the five participants. It is also to be noted that the two
participants, P2 and P3, who showed a loss of GS
towards the end of the intervention returning closer to
baseline, demonstrated consistent improvement on
ARAT. However, there is a need to establish an MCID
for GS.
Visual Aanlog Scores for Fatigue and Mood
There were moderate increases in the fatigue (Figure 6)
reported by three of the participants. This resulted i n a
group mean change of +4.77 cm. Although it is possible
that the incre ase was caused by factors external to the
therapy, it could also be due to the exercises undertaken
over two hour long sessions (including time required in
preparation). However, there are substantial fluctuations
in fa tigue over t he treatment period. Since no reasses s-
ments or further follow up recordings were made , the
longer term effects of the intervention fatigue are uncer-
tain. In order to examine potential dependencies
between the CA results and the fatigue scores reported
in the study, an att empt to correlate these quantities
was made. Due to varying ranges of CAs in different
subjects, individual percentile ranks (0-1) were deter-
mined, which provided more intuitive measure of the
performance level for every subjec t. These values were
then matched with fati gue scores grouped in four inter-
quartile ranges (independent division f or each subject
into four bins - below the fir st quartile, from the first to
the second quartile, from the second to the third quar-
tile and above the third quartile). Finally, the CA per-
centile ranks were averaged within each range of fatigue
quartile and subsequently, the mean and the standard
deviation for all subjects were evaluated. This is
depicted in the Figure 6b. As can be noticed, there do
not appear any clear interaction terms. The only obser-
vable trends are for the last three inter-quartile ranges
(
a
)
(
b
)
0
10
20
30
40
50
60
70
80
90
W0_0 W1_2 W2_4 W3_6 W 4_8 W5_10 W6_12 W 7_14
Time-point
Motricity Index
P1
P2
P3
P4
P5
mean
0
10
20
30
40
50
60
W0_0 W1_2 W2_4 W3_6 W 4_8 W5_10 W6_12 W 7_14
Time-point
ARAT
P1
P2
P3
P4
P5
mean
(c) (d)
0
1
2
3
4
5
6
7
W0_0 W1_2 W2_4 W3_6 W4_8 W 5_10 W6_12 W7_14
Time-point
NHPT
P1
P2
P3
P4
P5
0
10
20
30
40
50
60
W0_0 W1_2 W2_4 W3_6 W 4_8 W5_10 W6_12 W 7_14
Time-point
Grip Strength (llbs)
P1
P2
P3
P4
P5
mean
Figure 5 Recording of rehabilitation outcome measures with respect to time-points wi_j,wherei rep resents the week and j
represents the session number: (a) Motricity Index score (/100). (b) ARAT Score (/57). (c) NHPT Score (/6). (d) Grip strength (lbs.).
Prasad et al. Journal of NeuroEngineering and Rehabilitation 2010, 7:60
/>Page 12 of 17
of f atigue, where growing VAS score levels correspond
to a decrease in the CA ranks for fatigue. This interpre-
tation has been further reinforced in Figure 6c where a
plot is drawn between the inter-subject variance of sub-
ject-wise CA percentile ranks and VAS fatigue score
quartiles. Based on this plo t, it can be argued that
higher level of fatigue can contribute to a larger variabil-
ity in the BCI performance among the subjects. It may
also be argued that growing fatigue has increasingly
varying effect on different subjects. However, the obser-
vations can only be treated as a trend without convin-
cing statistical evidence.
As far as mood changes are conc erned, all of the par-
ticipants showed i mprovem ent in mood (Figure 7) dur-
ing the intervention period with a group mean change
close to -0.8 cm. This change can be considered as clini-
cally significant. Similar to the fatigue above, the CA
percentile ranks are plotted in Figure 7b for mood. A s
expected, main observable trends are for the last three
inter-quartile ranges of mood, where growing VAS score
levels correspond to an increase in the CA ranks for
mood.
Qualitative comments
The participants were overall pleased to have taken part
in the study despite its feasi bility evaluation aspect.
Most of them found it beneficial in terms of the
enhanced concentration and one individual reported an
improvement of ce rtain motor functions in his a ffected
hand (subjective perception). Two subjects found the
treatment sessions excessively lengthy and tiring, parti-
cularly if they were held in the afternoon. All of the sub-
jects expressed willingness to participate in potential
follow-up studies. With regard to the use of BCI tech-
nology, subjects did not experience any significant diffi-
culties in e mbracing the neurofeedback paradigm.
However, most of them suggested the need for more
interesting, challenging and thus more immersive com-
puter game scenarios.
Discussion and Conclusions
With the help of a pilot trial, the paper has presented a
feasibility s tudy of an EEG-based BCI generate d neuro-
feedback to support patient engagement during an MI
practice performed as part of a post-stroke rehabilitation
protocol combining both PP and MI practice of rehabili-
tation tasks. The protocol used a BCI controlled ball-
basket game based neurofeedback for confirming the
patient engagement on-line. Five individuals suffering
from stroke for more than a year participated in the
pilot trial involving up to twelve treatment ses sions. The
on-line CA of MI induced SMR patterns in the form of
ERD and ERS, for novice participants was in a moderate
of range 60-75% within the limited 12 half an hour long
BCItrainingsessionsundertakenaspartoftreatment
sessions. A detailed analysis of EEG data demonstrated
that two different types of MI practices resulted in
hemispherically asymmetric electrophysiological
responses in frequency bands corresponding to μ and b
rhythms, which clearly demonstrated that both hemi-
spheres were stimulated in all participants. There also
existed a high correlation between the CA rates and the
ERD/ERS ratios demonstrating that the hemispheric
asymmetry in b oth μ and b bands contributed to BCI
CA rates. However, for only two participants, the ERD
change was statistically significant between the first ses-
sion and the last session.
The study f ound improvements in some of the func-
tional outcome measure scores for all the participants as
Table 4 Pearson’s product-moment correlation
coefficients for different pairings between left/right
upper limb MI ERD/ERS ratio in μ/b band and a
rehabilitation outcome measure recorded over whole of
the intervention period
P1 P2 P3 P4 P5
ERD/ERS
(C3L)
μ
vs McI
0.31 -0.52
ERD/ERS
(C3L)
μ
vs ARAT
0.45
-0.61 -0.22
ERD/ERS
(C3L)
μ
vs GS
0.12 -0.06 -0.61 0.05 -0.50
ERD/ERS
(C4L)
μ
vs ARAT
0.50 0.12 -0.05
ERD/ERS
(C4L)
μ
vs NHPT
0.50 0.46 0.02 0.00
ERD/ERS
(C4L)
μ
vs GS
-0.17 0.32
-0.74 -0.03 -0.05
ERD/ERS
(C3R)
μ
vs GS
0.15 0.14 -0.64 -0.10 -0.58
ERD/ERS
(C4R)
μ
vs GS
-0.27 -0.37 -0.72 0.20 0.02
ERD/ERS
(C3L)
β
vs GS
-0.15 0.04 -0.63 0.01 -0.38
ERD/ERS
(C4L)
μ
vs ARAT
0.23 0.30
-0.69
ERD/ERS
(C4L)
μ
vs NHPT
0.23 0.53 -0.48 0.00
ERD/ERS
(C4L)
μ
vs GS
0.77 0.10 -0.21 -0.05 -0.38
ERD/ERS
(C3R)
β
vs McI
0.61 -0.09
ERD/ERS
(C3R)
β
vs ARAT
0.46 -0.33 -0.50
ERD/ERS
(C3R)
β
vs GS
-0.42 0.40 -0.35 -0.08
-0.63
ERD/ERS
(C4R)
β
vs McI
0.17 -0.76
ERD/ERS
(C4R)
β
vs NHPT
0.36 0.60 -0.23 0.00
ERD/ERS
(C4R)
β
vs GS
-0.10 0.05 -0.38 0.26 -0.51
Some entries are blank because no coefficient could be computed, as the
corresponding outcome scores remained unchanged.
Prasad et al. Journal of NeuroEngineering and Rehabilitation 2010, 7:60
/>Page 13 of 17
a result of undergoing the rehabilitation protocol. The
improvements in ARAT for two of the participants
exceeded the MCID limit, while its mean change was
nearly approaching the MCID limit. Based on the Pear-
son’s correlation coefficient computation for every
possible pairing between left/right upper limb MI
induc ed ERD/ER S ratio in μ/b band and a rehabilit ation
outcome measure score, it was found that the scores of
two outcome measures, ARAT and GS, h ave large cor-
relation with ERD/ERS ratios of all the participants and
(a)
Fatigue
0.0
1.0
2.0
3.0
4.0
5.0
6.0
7.0
W0_i
W
0_0
W
1_1
W1_
2
W2_3
W2_4
W
3_5
W3_
6
W
4_7
W4_8
W
5_9
W5_10
W6_11
W6_12
W
7_13
Time point
Visual Analogue Scale [cm]
mean
P1
P2
P3
P4
P5
(b) (c)
Figure 6 Monitoring of Fatigue: (a) Visual analog scores (VAS) for fatigue plotted with respect to time-points wi_j, where i represents the week
and j the session number. (b) Dependency between CA results and fatigue VAS-plot of the subject-wise CA percentile rank (inter-subject mean
with standard deviation) matched with fatigue VAS quartiles (i.e. inter-quartile ranges). (c) Dependency between CA results and fatigue VAS-plot
of the inter-subject variance of subject-wise CA percentile ranks matched with fatigue VAS quartiles (i.e. inter-quartile ranges).
Prasad et al. Journal of NeuroEngineering and Rehabilitation 2010, 7:60
/>Page 14 of 17
these two will be sufficient to monitor incremental func-
tional gains during the intervention. However, an MCID
needs to be established for GS. As expected, most parti-
cipants were suffering from fatigue. As far as interaction
of the fatigue scores with the CAs is concerned, it can
be argued that higher level of fatigue can contribute to a
larger variability in the BCI performance among the
subjects. Nevertheless, there was significant improve-
ment in average mood over the treatment sessi ons. Par-
ticipants in general appeared ve ry enthusiastic about
participating in the study and regularly attended all the
sessions. There was no drop out at all.
(a)
Mood
0.0
0.5
1.0
1.5
2.0
2.5
3.0
W0_
i
W0_0
W1_
1
W
1_2
W2
_3
W2_4
W3_
5
W3_6
W4_
7
W4
_8
W5_9
W5_10
W6
_1
1
W6_1
2
W7_
1
3
Time point
Visual Analogue Scale [cm]
mean
P1
P2
P3
P4
P5
(b)
0.0
0.2
0.4
0.6
0.8
1.0
01234
Mean CA percentile rank
Mood
q
uartile
Figure 7 Monitoring of Mood: (a) Visual analog scores (VAS) for mood plotted with respect to time-points wi_j, where i represents the week
and j the session number. (b) Dependency between CA results and mood VAS-plot of the subject-wise CA percentile rank (inter-subject mean
with standard deviation) matched with mood VAS quartiles (i.e. inter-quartile ranges).
Prasad et al. Journal of NeuroEngineering and Rehabilitation 2010, 7:60
/>Page 15 of 17
The origins of rat her moderate CA values reported in
the experiments are multifarious-subjects were novice BCI
users, they could have difficulties maintaining high con-
centration and performing consistent MI throughout the
entire experimental session, or the lateralization of the MI
related EEG correlates that the BCI relies on could be
affected due to post-stroke brain lesion. It maybe possible
to improve the CA performance by adapting the BCI sys-
tem to a ddress specificities of MI induced EEG patterns
recorded from stroke rehabilitants. F or significant
enhancement in CA rates, the study should run for much
larger number of sessions, i.e. at least 20 or more sessions.
Overall, however, the crucial observation is the fact that
the moderate BCI classification performance did not
impede the positive rehabilitation trends as quant ified
with the rehabilitation outcome measures adopted in this
study. Therefore it can be concluded that the BCI sup-
ported MI practice is a feasible intervention as part of a
post-stroke rehabilitation protocol combining both PP and
MI practice of rehabilitation tasks. It is however yet to be
ascertained whether the enhanced rehabilitation gain is
primarily because of BCI neurofeedback, as the positive
impact of MI practice without feedback has been reported
in a recent study [3]. Additionally it is to be noted that the
scope of the final conclusions is limited by the small sam-
ple size and the lack of a control group. To address these
issues, it is proposed to perform a more extensive follow-
up study in near future.
Acknowledgements
Authors gratefully acknowledge the financial support for this work received
from the University of Ulster through the Research Council Support Fund
(RCSF) scheme. Authors also gratefully acknowledge the support provided
by Ms Clare McGoldrick in recruiting participants and assessing outcomes.
Author details
1
Intelligent Systems Research Centre (ISRC), University of Ulster, Magee
Campus, Derry, N. Ireland, UK.
2
Health & Rehabilitation Sciences Research
Institute, University of Ulster, Jordanstown Campus, Newtonabbey, N. Ireland,
UK.
Authors’ contributions
GP conceived the initial idea, obtained ethical approval and led the pilot
study. PH undertook algorithmic developments, data analysis and performed
most of BCI related experimental tasks with some help from GP and DC. PH,
JC, and SM supported the content and delivery of the MP intervention; also
provided advice and training on the outcome measures used. GP wrote the
first draft and all authors revised and approved the final manuscript.
Competing interests
The authors declare that they have no competing interests.
Received: 2 November 2009 Accepted: 14 December 2010
Published: 14 December 2010
References
1. World Health Organization: Global Report. 2002 [ />whr/2002/en/index.html], [Last accessed on 13 January 2007].
2. Crosbie JH, McDonough SM, Gilmore DH, Wiggam MI: The adjunctive role
of mental practice in the rehabilitation of the upper limb after
hemiplegic stroke: a pilot study. Clinical Rehabilitation 2004, 18:60-68.
3. Page SJ, Levine P, Leonard AC: Mental Practice in Chronic Stroke: Results
of a Randomised, Placebo-Controlled Trial. Stroke 2007, 38(4):1293-1297.
4. Dickstein R, Deutsch JE: Motor imagery in physical therapist practice. Phys
Ther 2007, 87(7):942-53.
5. Braun S, Kleynen M, Schols J, Schack T, Beurskens A, Wade D: Using mental
practice in stroke rehabilitation: a framework. Clin Rehabil 2008,
22(7):579-91.
6. Pfurtscheller G, Neuper C: Motor imagery and direct brain computer
communication Proc. IEEE 2001, 89(7):1123-34.
7. Wolpaw JR, Birbaumer N, McFarland DJ, Pfurtscheller G, Vaughan : Brain-
computer interfaces for communication and control. Clinical
Neurophysiology 2002, 113:767-91.
8. Guger G, Edlinge G, Harkam W, Niedermayer I, Pfurtschelle G: How Many
People are Able to Operate an EEG-based Brain-Computer Interface
(BCI)? IEEE Trans Neural Systems and Rehabilitation Engineering 2003,
11(2):145-147.
9. Neuper , et al: Enhancement of Left Right Senorimotor EEG Differences
During Feedback Regulated Motor Imagery. Journal of Clinical
Neurophysiology 1999, 16(4):373-382.
10. Meng F, Tong K, Chan S, Wong W, Lui K, Tang K, Gao S: BCI-FES Training
System Design and Implementation for Rehabilitation of Stroke Patients.
Proceedings of the IJCNN 2008, 4102-4105.
11. Mohapp A, Scherer R, Keinrath C, Grieshofer P, Pfurtscheller G, Neuper C:
Single-trial EEG Classification of Executed and Imagined Hand
Movements in Hemiparetic Stroke Patients. Proceedings of the 3rd Intl. BCI
Workshop & Training Course, Graz 2006, 80-81.
12. Ang KK, et al: A clinical evaluation of non-invasive motor imagery-based
brain-computer interface in stroke. Proceedings of the IEEE Eng Med Biol
Soc. Conf., 2008 2008, 4178-81.
13. Ang KK, et al: A clinical evaluation on the spatial patterns of non-invasive
motor imagery-based brain-computer interface in stroke. Proceedings of
the IEEE Eng Med Biol Soc. Conf., 2008 2008, 4174-7.
14. Buch E, Weber C, Cohen LG, Braun C, Dimyan MA, Ard T, Mellinge J,
Caria A, Soekadar S, Fourkas A, Birbaumer N: Think to Move: a
Neuromagnetic Brain-Computer Interface (BCI) System for Chronic
Stroke. Stroke 2008, 39:910-917.
15. Hodkinson HM: Evaluation of a mental test score for assessment of
mental impairment in the elderly. Age and Ageing 1972, 1:233-238.
16. Bhavani G, Cockburn J, Lincoln N: The reliability of the Rivermead
Assessment and implications for some commonly used assessments of
perception. British Journal of Occupational Therap 1983, 46:17-19.
17. Weiss T, Hansen E, Beyer L: Activation processes during mental practice
in stroke patients. Int J Psychophys 1994, 17:91-100.
18. Crosbie JH, Lennon S, Basford JR, McDonough SM: Virtual reality in stroke
rehabilitation: still more virtual than real. Disability & Rehabilitation 2007,
29(14):1139-1146.
19. McFarland DJ, Miner LA, Vaughan TM, Wolpaw JR: Mu and Beta
topographies during motor imagery and actual movements. Brain
Topography 2000, 12(3):177-186.
20. Coyle DH, Prasad G, McGinnity TM: A time-frequency approach to feature
extraction for a brain-computer interface with a comparative analysis of
performance measures. EURASIP Journal of Applied Signal Processing 2005,
2005(19):3141-3151.
21. Herman P, Prasad G, McGinnity TM, Coyle DH: Comparative analysis of
spectral approaches to feature extraction for EEG-based motor imagery
classification. IEEE Trans. on Neural Systems and Rehabilitation Engineering
2008, 16(4):317-326.
22. Herman P, Prasad G, McGinnity TM: Design and on-line evaluation of
type-2 fuzzy logic system-based framework for handling uncertainties in
BCI classification. Proc of IEEE Engineering in Medicine and Biology Society
Conference 2008, Vancouver, Canada.
23. Herman P, Prasad G, McGinnity TM: Designing a Robust Type-2 Fuzzy
Logic Classifier for Non-stationary Systems with Application in Brain-
Computer Interfacing. Proceedings of the 2008 IEEE International
Conference on Systems, Man, and Cyberneti cs (SMC 2008), Suntec Singapore
2008.
24. Mendel JM: Uncertain Rule-Based Fuzzy Logic Systems: Introduction and New
Directions Prentice-Hall, USA; 2001.
25. Demeurisse G, Demol O, Robaya E: Motor evaluation in vascular
hemiplegia. European Neurology 1980, 19:382-389.
Prasad et al. Journal of NeuroEngineering and Rehabilitation 2010, 7:60
/>Page 16 of 17
26. Lyle RC: A performance test for assessment of upper limb function in
physical rehabilitation treatment and research. Int J Rehabil Res 1981,
4:483-492.
27. Mathiowetz V, Weber K, Kashman N, Volland G: Adult norms for the nine
hole peg test of finger dexterity. Occup Ther J Res 1985, 5:24-38.
28. Mathiowetz V, Kashman N, Volland G, Weber K, Dowe M, Rogers S: Grip
and pinch strength: normative data for adults. Arch Phys Med Rehabil
1985, 66:69-72.
29. Glader E-L, Stegmayr B, Asplund K: Poststroke Fatigue: A 2-Year Follow-Up
Study of Stroke Patients in Sweden. Stroke 2002, 33:1327-1333.
30. Van der Lee JH, Wagennaar RC, Lankhorst GJ, Vogelaar TW, Deville WL,
Bouter LM: Forced use of the upper extremity in chronic stroke patients:
results from a single-blind randomised clinical trial. Stroke 1999,
30:2369-2375.
31. Hellar A, Wade DT, Wood VA, Sunderland A, Hewar RL, Ward E: Arm
function after stroke: measurement and recovery over the first three
months. J Neurol Neurosurg Psychiatry 1987, 50:714-719.
32. Dittnera AJ, Wesselyb SC, Brown RG: The assessment of fatigue: A
practical guide for clinicians and researchers. Journal of Psychosomatic
Research 2004, 56:157-170.
33. Shahid S, Sinha RK, Prasad G: Mu and beta rhythm modulations in motor
imagery related post-stroke EEG: a study under BCI framework for post-
stroke rehabilitation. BMC Neuroscience 2010, 11(Suppl 1):P127.
doi:10.1186/1743-0003-7-60
Cite this article as: Prasad et al.: Applying a brain-computer interface to
support motor imagery practice in people with stroke for upper limb
recovery: a feasibility study. Journal of NeuroEngineering and Rehabilitation
2010 7:60.
Submit your next manuscript to BioMed Central
and take full advantage of:
• Convenient online submission
• Thorough peer review
• No space constraints or color figure charges
• Immediate publication on acceptance
• Inclusion in PubMed, CAS, Scopus and Google Scholar
• Research which is freely available for redistribution
Submit your manuscript at
www.biomedcentral.com/submit
Prasad et al. Journal of NeuroEngineering and Rehabilitation 2010, 7:60
/>Page 17 of 17