Báo cáo hóa học: " Effects of an attention demanding task on dynamic stability during treadmill walking" doc
Bạn đang xem bản rút gọn của tài liệu. Xem và tải ngay bản đầy đủ của tài liệu tại đây (368.04 KB, 10 trang )
BioMed Central
Page 1 of 10
(page number not for citation purposes)
Journal of NeuroEngineering and
Rehabilitation
Open Access
Research
Effects of an attention demanding task on dynamic stability during
treadmill walking
Jonathan B Dingwell*
†1
, Roland T Robb
†1
, Karen L Troy
†2
and
Mark D Grabiner
†2
Address:
1
Department of Kinesiology & Health Education, University of Texas, 1 University Station, Mail Stop D3700, Austin, TX 78712, USA and
2
Department of Movement Sciences, University of Illinois at Chicago, 1919 West Taylor St., Chicago, IL 60612, USA
Email: Jonathan B Dingwell* - ; Roland T Robb - ; Karen L Troy - ;
Mark D Grabiner -
* Corresponding author †Equal contributors
Abstract
Background: People exhibit increased difficulty balancing when they perform secondary
attention-distracting tasks while walking. However, a previous study by Grabiner and Troy (J.
Neuroengineering Rehabil., 2005) found that young healthy subjects performing a concurrent Stroop
task while walking on a motorized treadmill exhibited decreased step width variability. However,
measures of variability do not directly quantify how a system responds to perturbations. This study
re-analyzed data from Grabiner and Troy 2005 to determine if performing the concurrent Stroop
task directly affected the dynamic stability of walking in these same subjects.
Methods: Thirteen healthy volunteers walked on a motorized treadmill at their self-selected
constant speed for 10 minutes both while performing the Stroop test and during undisturbed
walking. This Stroop test consisted of projecting images of the name of one color, printed in text
of a different color, onto a wall and asking subjects to verbally identify the color of the text. Three-
dimensional motions of a marker attached to the base of the neck (C5/T1) were recorded. Marker
velocities were calculated over 3 equal intervals of 200 sec each in each direction. Mean variability
was calculated for each time series as the average standard deviation across all strides. Both "local"
and "orbital" dynamic stability were quantified for each time series using previously established
methods. These measures directly quantify how quickly small perturbations grow or decay, either
continuously in real time (local) or discretely from one cycle to the next (orbital). Differences
between Stroop and Control trials were evaluated using a 2-factor repeated measures ANOVA.
Results: Mean variability of trunk movements was significantly reduced during the Stroop tests
compared to normal walking. Conversely, local and orbital stability results were mixed: some
measures showed slight increases, while others showed slight decreases. In many cases, different
subjects responded differently to the Stroop test. While some of our comparisons reached
statistical significance, many did not. In general, measures of variability and dynamic stability
reflected different properties of walking dynamics, consistent with previous findings.
Conclusion: These findings demonstrate that the decreased movement variability associated with
the Stroop task did not translate to greater dynamic stability.
Published: 21 April 2008
Journal of NeuroEngineering and Rehabilitation 2008, 5:12 doi:10.1186/1743-0003-5-12
Received: 7 June 2007
Accepted: 21 April 2008
This article is available from: />© 2008 Dingwell et al; licensee BioMed Central Ltd.
This is an Open Access article distributed under the terms of the Creative Commons Attribution License ( />),
which permits unrestricted use, distribution, and reproduction in any medium, provided the original work is properly cited.
Journal of NeuroEngineering and Rehabilitation 2008, 5:12 />Page 2 of 10
(page number not for citation purposes)
Introduction
Falls pose a significant and extremely costly [1] health care
problem for the elderly [2] and patients with gait disabil-
ities [3-5]. One recent meta-analysis found that abnormal-
ities of gait or balance were the most consistent predictors
of future falls [6]. Because most falls occur during whole-
body movements like walking [7,8], understanding the
mechanisms humans use to maintain dynamic stability
during walking is critical to addressing this momentous
clinical problem effectively [9,10]. The ability to maintain
balance during walking can be negatively affected by con-
comitant information processing and this effect appears
to increase with age [11]. These effects can be studied
using various dual-task paradigms, which require subjects
to perform an attention demanding secondary task while
simultaneously performing a primary task like walking.
Dual-task paradigms assume humans possess limited
information processing capacity. When performing both
primary and secondary tasks, each of which require some
level of attention, a negative influence on the performance
of either task may indicate structural interference or capac-
ity interference [11]. The former is associated with tasks
that share common input and output resources whereas
the latter is associated with exceeding the total informa-
tion processing capacity.
Dual-task paradigms have been used to investigate walk-
ing in part because of the frequency with which walking is
performed concurrently with cognitive tasks. The changes
in reaction time and gait-related variables (e.g., [12-15])
reported for older adults during dual-task paradigms have
been associated with increased fall-risk. For example, per-
forming a verbal reaction time task during an obstacle
avoidance task significantly increases the risk of obstacle
contact by young adults [16] and to an even greater extent
by older adults [17]. These results broadly suggest that
performing cognitive tasks during locomotion may
increase the risk of tripping.
The variability of step kinematics has also been strongly
linked with falls by older adults. In particular, cross-sec-
tional and prospective studies have consistently linked
increased step time variability to falls in the normal aging
population [18,19]. Older adults without a history of falls
exhibit increased step width and step width variability
compared to young adults [20], which likely reflects the
increased need for lateral stabilization, despite incurring
increased energetic cost [21]. Prospective studies have also
shown that increases in stride-to-stride variability of walk-
ing speed [22] and/or stride time [19] can discriminate
older adults who fall from those who do not.
The apparent relationship between increased fall-risk
when performing attention demanding tasks while walk-
ing, and the relationship between step kinematic variabil-
ity and fall risk raises the question of whether attention
demanding tasks increase step kinematic variability. Some
evidence supports this idea. For example, step time varia-
bility of patients with either Parkinson's or Alzheimer's
disease is significantly greater than that of healthy con-
trols and also demonstrates additional significant increases
when performing an attention demanding task while
walking [23,24]. Conversely, Grabiner and Troy [25]
recently found that young healthy subjects performing a
concurrent Stroop task [26] while walking on a motorized
treadmill actually exhibited decreased step width variabil-
ity. This Stroop test consisted of projecting images of the
name of one color, printed in text of a different color,
onto a wall and asking subjects to verbally identify the
color of the text. These authors suggested that these
changes may have reflected a voluntary gait adaptation
toward a more conservative gait pattern that emphasized
frontal plane trunk control [25].
While the findings of Grabiner and Troy initially appear
counter-intuitive, the biomechanical and physiological
significance of changes in gait variability remain an issue
of considerable debate. Variability is often assumed to be
deleterious, reflecting the presence of unwanted noise in a
physiological system.
Alternatively, variability may reflect a desirable trait of an
adaptive system that arises from the interaction of multi-
ple control systems [27]. As specifically related to walking,
several recent studies found that step width variability can
distinguish between healthy young and elderly subjects
[28], that step width cannot distinguish between fit and
frail elderly adults [29], and that elderly adults with a his-
tory of falls may exhibit either too much or too little step
width variability [30]. Thus, it remains quite unclear what
true clinical implications may be drawn from observed
changes in measures of locomotor variability.
One potential reason for this is that statistical measures of
variability do not directly quantify how the locomotor
system responds to perturbations [10]. Previous work has
shown that measures of kinematic variability are not well
correlated with measures of dynamic stability that directly
quantify the sensitivity of walking kinematics to small
perturbations [9,31,32]. Variability may also not be
equated with the stability exhibited in response to larger
perturbations [33]. The purpose of the present study was
therefore to determine how performing a concurrent
attention-distracting Stroop task would affect the dynamic
stability of walking in young healthy subjects. We ana-
lyzed the dynamic stability of upper body kinematics of
the subjects tested in same experiments previously
reported by Grabiner and Troy [25]. We hypothesized that
while these subjects did exhibit decreased step width var-
iability, they would conversely exhibit increases in the sen-
Journal of NeuroEngineering and Rehabilitation 2008, 5:12 />Page 3 of 10
(page number not for citation purposes)
sitivity of their upper body (i.e. trunk) movements to the
small inherent perturbations that naturally occur during
normal walking [9,31,32].
Methods
Fifteen young healthy individuals (8 male and 7 female,
age: 24.5 ± 3.4 years, height: 1.66 ± 0.12 m, and mass:
68.5 ± 8.0 kg) volunteered to participate. The protocol
was reviewed and approved institutionally and all sub-
jects provided written informed consent prior to partici-
pating. All data were obtained from the same subjects
tested during the same experiments previously described
by Grabiner and Troy [25]. Data for 2 of these subjects
were unusable for the present analyses due to technical
difficulties that arose during data collection. Therefore,
the results obtained from the remaining 13 subjects are
reported here.
Subjects walked on a motorized treadmill at their self-
selected constant speed for 10 minutes each, both while
walking normally and while concurrently performing an
attention demanding Stroop test [26]. During control tri-
als, subjects were asked to walk while looking straight
ahead at a wall approximately five meters away. During
Stroop test trials, images consisting of the name of one of
four colors, printed in text of a different color, were pro-
jected onto the wall in letters 15 cm tall. These images
changed randomly once every second. The subjects were
instructed to verbally identify the color of the text and
ignore the word itself. The order of presentation of the
Stroop and control conditions was randomly assigned
and the entire experiment was performed during a single
day.
In addition to the foot marker data used to report step
width variability in Grabiner and Troy [25], a retro-reflec-
tive marker was also attached to the skin over the 5
th
cer-
vical/1
st
thoracic vertebrae (C5/T1) to measure the three-
dimensional movements of the upper body during each
trial. Our analyses here focused on these upper body
movements because over half of the body's mass is
located above the pelvis. Thus, maintaining dynamic sta-
bility of the trunk is critical for maintaining stability of the
body as a whole [9,34,35]. The motions of this C5/T1
marker in the anterior-posterior (AP), mediolateral (ML),
and vertical (VT) directions were recorded using an 8-cam-
era motion analysis system (Motion Analysis, Santa Rosa,
CA, USA) operating at 60 Hz. Raw marker data were fil-
tered with a zero-lag Butterworth filter with a cutoff fre-
quency of 6 Hz.
The analytical techniques applied also required stationary
data [36], but the raw motion data exhibited considerable
nonstationarity mainly because subjects "wandered" in
the horizontal plane as they walked on the treadmill [9].
To obtain more stationary data, the velocity of each time
series (V
AP
, V
ML
, and V
VT
) was calculated using a standard
3-point difference formula [37]:
where D
X
(i) was the displacement in each direction, X ∈
{AP, ML, VT}, at data sample i and Δt = 1/60 sec was the
time between data samples. The analysis techniques used
here were independent of specific measurement units.
Thus, analyzing the dynamical properties of the velocity
time series was equivalent to analyzing the dynamical
properties of the displacement time series [9,36]. Addi-
tionally, each ten-minute time series was first divided into
three equal intervals of 200 sec (approximately 150
strides) each to calculate both within- and between-sub-
ject variances in each dependent measure. Data for all
strides from all trials were analyzed. While the number of
strides analyzed was slightly different for each subject and
trial, the analyses conducted here were not sensitive to
small changes in this parameter [9,38].
To quantify variability, the V
AP
, V
ML
, and V
VT
data for each
individual stride were extracted and time-normalized to
101 samples (0% to 100%). Individual strides were differ-
entiated by identifying every other minimum from the
vertical movements of the C5/T1 marker [9]. Standard
deviations were calculated across all strides at each nor-
malized time increment and then averaged over the nor-
malized stride to produce a single measure of the mean
variability ("MeanSD") for each trial (Fig. 1A):
MeanSD(V
X
) = ΌSD
n
[V
X
] (2)
where V
X
denotes the velocity in each direction, X ∈ {AP,
ML, VT}, n
∈
{0%, , 100%} is an index denoting each
percentage of the gait cycle, and Ό· denotes the average
over all values of n [9].
In theoretical mechanics, stability is defined by how a sys-
tem's state variables respond to perturbations [39]. For
aperiodic systems that exhibit no discernable periodic
structure, "local stability" is defined using local divergence
exponents [36,40], which quantify how the system's states
respond to very small (i.e. "local") perturbations continu-
ously in real time [9,10,31]. For limit cycle systems,
defined as having a constant fixed period, "orbital stability"
is defined using Floquet multipliers [39] that quantify,
discretely from one cycle to the next, the tendency of the sys-
tem's states to return to the periodic limit cycle orbit after
small perturbations [32,41,42]. Because human walking
is neither strictly periodic, nor strongly aperiodic, both
methods were used to assess the sensitivity of walking kin-
Vn
D
X
iD
X
i
t
X
()
=
+
()
−−
()
11
2Δ
(1)
Journal of NeuroEngineering and Rehabilitation 2008, 5:12 />Page 4 of 10
(page number not for citation purposes)
ematics to small perturbations during continuous walk-
ing.
For both analyses, we first defined appropriate multi-
dimensional state spaces for each individual time series
using standard delay-reconstruction techniques [9,10,36]
(e.g., Fig. 1B):
S(t) = [q(t), q(t + T), q(t + 2T), , q(t + (d
E
- 1)T)]
(3)
where S(t) was the d
E
-dimensional state vector, q(t) was
the original 1-dimensional data [i.e., either V
AP
(t), V
ML
(t),
or V
VT
(t)], T was the time delay, and d
E
was the embedding
dimension. Time delays were calculated from the first
minimum of the Average Mutual Information function
[10,36]. An embedding dimension of d
E
= 5 was used for
all data sets, as determined from a Global False Nearest
Neighbors analysis [10,36]. Note that these state spaces
consisted of the original real-time data (i.e., data were not
time normalized).
To quantify local stability, the mean local divergence of
nearest neighbor trajectories was calculated using a previ-
ously published algorithm [40]. For each point S(t) in
state-space, the nearest neighboring point S(t*) on an
adjacent trajectory was determined (Fig. 1C). For each pair
(j) of initially nearest neighbors, the subsequent diver-
gence over time between these two points was then calcu-
lated:
d
j
(i) = ||S(t + iΔt) - S(t* + iΔt)||
2
(4)
where d
j
(i) was the Euclidean distance between the two
trajectories after each discrete time step i (i.e. iΔt seconds).
This local divergence was computed out to 10 seconds (i
= 600 samples) beyond each initial perturbation. This
process was repeated for all points from the data set and
then averaged to define the mean local divergence curve,
Όd
j
(i), where Ό• denotes the arithmetic mean over all val-
ues of j (Fig. 1C).
For purely deterministic "chaotic" systems, these mean
local divergence curves would be linear, reflecting a con-
stant exponential rate of divergence [36,40,43], and their
slope would approximate the maximum finite-time Lya-
punov exponent for the system. Since the curves we
obtained (e.g., Fig. 1C and [9,10]) were clearly not linear,
there was no basis for defining a true Lyapunov exponent
for human walking [36,43]. Nevertheless, these local
divergence exponents still provided rigorously defined
metrics for estimating the sensitivity of human walking to
small intrinsic perturbations [10,35]. To parameterize this
sensitivity, we instead fit a double-exponential function to
each mean divergence curve [35]:
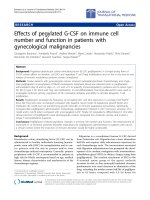
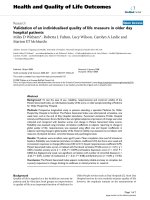
Schematic representations of dependent measure calcula-tionsFigure 1
Schematic representations of dependent measure calculations.
A: Example of mean ± 1 SD for a typical time series. Between-stride stand-
ard deviations are computed at each % of the gait cycle (i) and then aver-
aged to compute the MeanSD across the entire gait cycle (Eq. 2). B: An
original time series, q(t), is reconstruction into a 3-dimensional attractor
such that S(t) = [q(t), q(t+T), q(t+2T)]. The two triplets of points indicated
in A and separated by time lags T and 2T each map onto a single point in
the 3D state space. C: Expanded view of a local section of the attractor
shown in B. An initial naturally occurring local perturbation, d
j
(0), diverges
across i time steps as measured by d
j
(i). The average logarithmic diver-
gence, <d
j
(i)> is computed across all pairs of initially neighboring trajecto-
ries and then fit with a double exponential function (Eq. 5). D:
Representation of a Poincaré section transecting the state space perpen-
dicular to the system trajectory. The system state at stride k, S
k
, evolves
to S
k+1
one stride later. The Floquet multipliers quantify whether the dis-
tances between these states and the system fixed point, S*, grow or decay
across multiple strides (Eq. 8).
q(t)
q(t+T)
t
q(t)
q(t+2T)
A
B
D
C
d (i)
j
d (0)
j
< d
j
(i) >
Time (# of Strides)
*
Fixed Point (S*)
(
S
k+1
− S*
)
Poincare Section
V
AP
0 25 50 75 100
% of Stride
SD
i
[
V
AP
]
i
A−B
S
e −B
L
e
−t
τ
S
−t
τ
L
(
S
k
− S*
)
S
k+1
S
k
2T
T
Journal of NeuroEngineering and Rehabilitation 2008, 5:12 />Page 5 of 10
(page number not for citation purposes)
where
τ
S
and
τ
L
(
τ
L
>>
τ
S
) represent the time constants that
describe how quickly Όd
j
(i) saturates to A, and B
S
and B
L
determine the size of the effect the dynamics at each
timescale have on Όd
j
(i) [35]. Eq. 5 was fit to each diver-
gence curve using the 'fmincon' function in Matlab. This
function requires an initial guess of the parameter values
and for most of the 234 time series analyzed, the results
were not particularly sensitive to this choice. For ~40 time
series (~17%), the initial guess had to be adjusted an addi-
tional 1–3 times to obtain good curve fits. The exponents
τ
S
-1
and
τ
L
-1
are mathematically directly analogous to the
"short-term" and "long-term" local divergence exponents
we have used previously [35]. Values of A, B
S
,
τ
S
, B
L
, and
τ
L
were computed for each trial for each subject for each
test condition.
Orbital stability was quantified by calculating the Floquet
Multipliers (FM) for the system [39] based on well-estab-
lished techniques [32,41,42,44]. Because Floquet theory
assumes the system is strictly periodic, the state space data
(Eq. 3) for each stride were first time-normalized to 101
samples (0% to 100%). We could then define a Poincaré
map (Fig. 1D) for the system at any chosen % of the gait
cycle as:
S
k+1
= F(S
k
)(6)
where k was an index enumerating the individual strides
and S
k
denoted the system state for the single chosen % of
the gait cycle. Limit cycle trajectories correspond to fixed
points in each Poincaré map:
S* = F(S*) (7)
For our walking data, we chose Poincaré sections at 0%,
25%, 50%, 75%, and 100% of the gait cycle [32,42]. We
defined the fixed point at each Poincaré section by the
average trajectory across all strides within a trial. Orbital
stability at each Poincaré section was estimated by quan-
tifying the effects of small perturbations away from these
fixed points, using a linearized approximation of Eq. (6):
[S
k+1
- S*] ≈ J(S*) [S
k
- S*] (8)
where J(S*) defined the Jacobian matrix for the system at
each Poincaré section. Floquet multipliers (FM) are the
eigenvalues of J(S*) [39,41,44]. Deviations away from the
fixed point are multiplied by FM by the subsequent cycle
(Fig. 1D). If the magnitude of the largest FM is < 1, these
deviations decay and the limit cycle is orbitally stable.
Smaller FM imply greater stability. We therefore com-
puted the magnitudes of the maximum FM (MaxFM) for
each Poincaré section for each trial for each subject for
each test condition.
For each dependent measure computed, differences
between control (CO) walking and Stroop test (ST) walk-
ing were evaluated using a two-factor (Subject × Condi-
tion) repeated measures (i.e., 3 intervals per trial)
balanced ANOVA for randomized block design, where
Subject was a random factor. For the local dynamic stabil-
ity variables (A, B
S
,
τ
S
, B
L
, and
τ
L
), the data were first log
transformed to satisfy linearity and normality constraints.
For each dependent measure, p-values for each main
effect and for Subject × Condition interaction effects were
obtained. Finally, linear and quadratic regression analyses
were run to determine if differences in movement varia-
bility (i.e., MeanSD) across subjects were generally corre-
lated with differences in either local or orbital stability.
Results
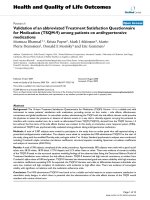
The mean variability (MeanSD) of upper body (i.e.,
trunk) movements was significantly greater during Con-
trol (CO) walking than during Stroop (ST) walking (p ≤
0.021) for all three principle directions: V
AP
, V
ML
, and V
VT
(Fig. 2). As expected, trunk movement variability was
greatest in the medio-lateral (ML) direction. Additionally,
there was a significant Subject × Condition interaction
effect for movements in the anterior-posterior (AP) direc-
tion (p = 0.008), indicating that while most subjects' AP
variability decreased during the Stroop test, this was not
true for all subjects (Fig. 2).
Overall, the Stroop test led to either no changes or incon-
sistent changes in local stability. The asymptotic ampli-
tudes of the local divergence curves ('A' in Eq. 5; Fig. 3A)
tended to be greater for CO walking than for ST walking
for ML movements (p = 0.055). For AP and VT move-
ments, the were no significant differences for Condition
(p > 0.32), but there were statistically significant Subject ×
Condition interactions (p = 0.021 and p = 0.036 for AP
and VT directions, respectively). Short-term time con-
stants ('
τ
S
' in Eq. 5; Fig. 3B) tended to be slightly larger
(i.e., more stable) during ST walking than CO walking for
AP movements (p = 0.102). However, the significant Sub-
ject × Condition interaction (p = 0.001) indicated that dif-
ferent subjects exhibited different responses. Long-term
time constants ('
τ
L
' in Eq. 5; Fig. 3C) were significantly
larger (i.e., more stable) during ST walking than CO walk-
ing for AP movements (p = 0.024), but were not signifi-
cantly different for ML (p = 0.200) or VT (p = 0.739)
movements. While the Subject × Condition interaction
effects were not statistically significant (0.10 < p < 0.30),
differences between subjects were evident in the data (Fig.
3C). Short-term and Long-term scaling coefficients ('B
S
'
and 'B
L
' in Eq. 5; data not shown) exhibited no significant
di A Be Be
jS
t
L
t
S
L
()
/
/
=− −
−
−
τ
τ
(5)
Journal of NeuroEngineering and Rehabilitation 2008, 5:12 />Page 6 of 10
(page number not for citation purposes)
differences between the two walking conditions (0.24 < p
< 0.67 for B
S
and 0.15 < p < 0.93 for B
L
, respectively).
Overall, the Stroop test led to either no changes or slight
increases in orbital instability of walking patterns. All sub-
jects exhibited orbitally stable walking kinematics (i.e.,
Max FM < 1) for all walking trials (Fig. 4), consistent with
previous findings [32,42]. In contrast to the local stability
findings, Max FM values were, on average, slightly larger
(i.e., more unstable) for the ST walking condition than the
CO walking condition for movements in the AP and VT
directions, but slightly smaller (i.e., more stable) for ML
movements. None of these differences, however, were sta-
tistically significant (0.17 < p < 0.90). At 75% of the gait
cycle, subjects did exhibit significantly greater (i.e., more
unstable) Max FM values during the Stroop test for vertical
movements (p = 0.009; Fig. 4). While none of the Subject
× Condition interaction effects were statistically signifi-
cant (0.07 < p < 0.85), differences between subjects were
again evident in the data (Fig. 4).
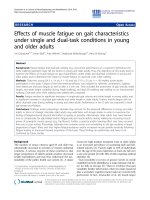
Kinematic variability (MeanSD) results for trunk velocities in the anterior-posterior (AP), mediolateral (ML), and vertical (VT) directionsFigure 2
Kinematic variability (MeanSD) results for trunk
velocities in the anterior-posterior (AP), medi-
olateral (ML), and vertical (VT) directions. Note that
the vertical scale is different for the ML direction compared
to the AP and VT directions. Nearly all subjects exhibited
greater variability during the Control (CO) walking trials,
particularly in the AP and VT directions. Variability of ML
movements was much greater than that of AP and VT move-
ments. The "*" indicates a statistically significant Subject ×
Condition interaction effect (p = 0.008).
CO ST
0
10
20
30
40
50
60
p = 0.001*
V
AP
MeanSD
CO ST
0
50
100
150
200
p = 0.021
V
ML
CO ST
0
10
20
30
40
50
60
p < 0.001
V
VT
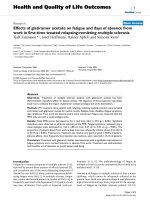
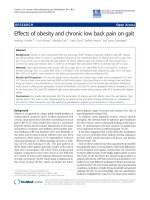
Local dynamic stability results for AP, ML, and VT trunk velocitiesFigure 3
Local dynamic stability results for AP, ML, and VT trunk veloci-
ties. These data were log transformed to satisfy linearity and normality
constraints of the ANOVA analyses. A: Divergence amplitudes (A in Eq. 5)
were slightly greater in the ML direction (p = 0.055) during Control (CO)
walking relative to Stroop test (ST) walking. B: Short-term time constants
(
τ
S
in Eq. 5) were not significantly different between the 2 tasks. C: Long-
term time constants (
τ
L
in Eq. 5) were significantly smaller (i.e., indicating
greater local instability) for the CO walking condition for movements in
the AP direction (p = 0.024). This same trend was observed in the ML
direction, but was not statistically significant (p = 0.200). The "*" indicate
statistically significant Subject × Condition interaction effects (p < 0.05). In
general, the Stroop test led to slightly more stable movements in the AP
direction, but slightly more unstable movements in the ML direction, com-
pared to CO walking.
CO ST
4.5
5.5
6.5
7.5
p = 0.327*
V
AP
Ln (A)
CO ST
4.5
5.5
6.5
7.5
p = 0.055
V
ML
CO ST
4.5
5.5
6.5
7.5
p = 0.656*
V
VT
CO ST
-4
-3
-2
-1
0
1
2
p = 0.102*
Ln (
τ
S
)
CO ST
-4
-3
-2
-1
0
1
2
p = 0.140
CO ST
-4
-3
-2
-1
0
1
2
p = 0.362
CO ST
-1
0
1
2
3
4
5
6
7
p = 0.024
CO ST
-1
0
1
2
3
4
5
6
7
p = 0.200
CO ST
-1
0
1
2
3
4
5
6
7
p = 0.739
Ln (
τ
L
)
A
B
C
Journal of NeuroEngineering and Rehabilitation 2008, 5:12 />Page 7 of 10
(page number not for citation purposes)
For AP and VT movements (Fig. 5, top and bottom rows),
differences in variability predicted differences in short-
term local instability (
τ
S
), but did not predict differences
in either long-term local instability (
τ
L
) or orbital instabil-
ity (MaxFM). For ML movements (Fig. 5, middle row), all
three stability measures exhibited quadratic relationships
with variability, with trials exhibiting intermediate
amounts of variability showing greater instability, while
trials exhibiting lesser or greater variability were more sta-
ble. We note that since each regression contained depend-
ent data (i.e., 2 data points from each subject), the p-
values obtained cannot indicate "statistical significance"
in the strict sense. The p-values and r
2
values in Fig. 5
instead indicate only the general quantitative strengths of
these relationships. Thus, measures of variability and
dynamic stability reflected different properties of walking
dynamics, consistent with previous findings [9,31].
Discussion
People often perform secondary attention-demanding
cognitive tasks while walking. The apparent relationships
between increased fall-risk when performing attention
demanding tasks while walking [11-17] and between step
kinematic variability and fall risk [19,20,22] suggest that
attention demanding tasks might increase step kinematic
variability. However, Grabiner and Troy [25] found that
young healthy subjects performing a concurrent Stroop
task [26] while walking on a motorized treadmill actually
exhibited decreased step width variability. The relationship
between step width and risk of falls remains an issue of
debate [28-30] and measures of kinematic variability are
not well correlated with measures of dynamic stability
that directly quantify the sensitivity of walking kinematics
to small perturbations [9,31,32]. Therefore, the present
study was conducted to determine if performing the con-
current Stroop task also affected the dynamic stability of
walking in the same experiments described in Grabiner
and Troy [25].
The present analyses demonstrate that these subjects also
exhibited decreased variability of trunk movements in all
three principle directions while performing the concur-
rent Stroop test (Fig. 2). These findings support the
decreased step width variability results reported by Grab-
iner and Troy and demonstrate that this decreased varia-
bility was not restricted to leg movements, but also
affected trunk movements. Decreasing the variability of
trunk (and thereby head) movements during the Stroop
test would help subjects stabilize their gaze on the words
being projected on the wall [45]. The local and orbital
dynamic stability results, however, were mixed. While
subjects exhibited somewhat more locally stable move-
ments in the AP direction while performing the Stroop
test ('
τ
L
'; Fig. 3C), most comparisons showed minimal dif-
ferences that were not statistically significant (Fig. 3). Fur-
thermore, subjects exhibited either no significant
differences in orbital stability, or slightly greater orbital
instability, while performing the Stroop task (Fig. 4). The
lack of main effects differences for these measures was
likely due at least in part to the fact that different subjects
responded differently to the Stroop task, as indicated by
the significant interaction effects. Therefore, the decreased
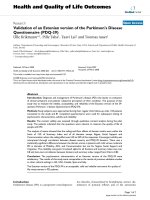
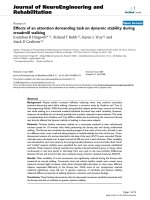
Orbital stability resultsFigure 4
Orbital stability results. Magnitudes of maximum Floquet
multipliers (MaxFM) for Poincaré sections taken at 25% and
75% of the gait cycle for trunk velocities in the AP, ML, and
VT directions. All subjects were orbitally stable (all MaxFM <
1) in all directions, but somewhat less stable (i.e., larger
MaxFM) in the ML direction, compared to the AP and VT
directions. During the Stroop test, subjects tended to be
slightly more stable in the ML direction, but slightly more
unstable in the AP and VT directions. This greater instability
was statistically significant at the 75% Poincaré section (p =
0.009). Similar results were obtained at the 0%, 50%, and
100% Poincaré sections, but no significant Condition effects
(0.231 < p < 0.996) were found. There were no statistically
significant Subject × Condition interaction effects for any of
the comparisons (0.07 < p < 0.85).
CO ST
0.2
0.4
0.6
0.8
1.0
p = 0.505
V
AP
MaxFM 25%
CO ST
0.2
0.4
0.6
0.8
1.0
p = 0.784
V
ML
CO ST
0.2
0.4
0.6
0.8
1.0
p = 0.657
V
VT
CO ST
0.2
0.4
0.6
0.8
1.0
p = 0.172
MaxFM 75%
CO ST
0.2
0.4
0.6
0.8
1.0
p = 0.360
CO ST
0.2
0.4
0.6
0.8
1.0
p = 0.009
Journal of NeuroEngineering and Rehabilitation 2008, 5:12 />Page 8 of 10
(page number not for citation purposes)
variability associated with performing the concurrent
Stroop task did not translate to greater dynamic stability in
these young healthy subjects.
Although subjects did not improve their dynamic stability
while performing the Stroop test and walking, they also
did not become obviously more unstable either. It is likely
that these young healthy subjects altered their gait pat-
terns to adapt to the Stroop task, as originally suggested by
Grabiner and Troy [25]. However, the present findings
demonstrate that they did not over-compensate, but were
instead able to maintain approximately the same levels of
dynamic stability. Another, albeit not mutually exclusive,
possibility is that the Stroop test itself imposed constraints
for head orientation that were not present in the control
task [45]. Thus, the Stroop task may not have been chal-
lenging enough to elicit more significant deterioration of
dynamic stability during walking. We believe it is likely
that we would observe more pronounced effects of con-
current cognitive tasks on the dynamic stability of walking
if we examined more impaired (e.g., elderly) populations
with more limited capacity to adapt to the task and/or if
we required subjects to perform more complex cognitive
tasks, such as more complex Stroop test [46,47], or possi-
bly solving arithmetic problems [15,45]. Performing
mental arithmetic in particular would likely cause subjects
to reorient their visual attention away from external visual
landmarks to internal images of the calculation [45],
thereby disrupting the otherwise very strong reliance on
visual information for the control of walking [48].
Regressions between measures of variability (MeanSD) and short-term local divergence time constants (
τ
S
; left column), long-term local divergence time constants (
τ
L
; middle column), and magnitudes of maximum Floquet multipliers (MaxFM; right col-umn) for movements in the AP (top row), ML (middle row), and VT (bottom row) directionsFigure 5
Regressions between measures of variability (MeanSD) and short-term local divergence time constants (
τ
S
; left
column), long-term local divergence time constants (
τ
L
; middle column), and magnitudes of maximum Flo-
quet multipliers (MaxFM; right column) for movements in the AP (top row), ML (middle row), and VT (bot-
tom row) directions. Each subplot show the average value for each subject for both Stroop ('O') and Control ('X') walking
trials. Linear regressions were performed for AP and VT movements, while quadratic regressions were performed for ML
movements. Adjusted r
2
values and p-values for each regression are shown in each sub-plot. Since each regression contained
two data points from each subject, these p-values do not indicate "statistical significance" in the strict sense, but instead indi-
cate only the general quantitative strengths of these relationships.
20 30 40 50 60
-4
-3
-2
-1
0
r
2
= 33.6%
p = 0.001
AP
20 30 40 50 60
-1
0
1
2
3
4
5
r
2
= 3.1%
p = 0.193
20 30 40 50 60
0.2
0.3
0.4
0.5
0.6
MaxFM
r
2
= 0.0%, p = 0.725
0 50 100 150 200
-4
-2
0
2
r
2
= 28.8%, p = 0.008
ML
0 50 100 150 200
1
2
3
4
r
2
= 16.0%, p = 0.052
0 50 100 150 200
0.2
0.4
0.6
0.8
1.0
MaxFM
r
2
= 55.9%, p < 0.001
10 20 30 40
-3
-2
-1
0
1
2
r
2
= 17.7%, p = 0.019
VT
10 20 30 40
0
1
2
3
4
MeanSD (deg)
r
2
= 1.6%, p = 0.247
10 20 30 40
0.2
0.3
0.4
0.5
0.6
0.7
MaxFM
r
2
= 0.0%, p = 0.805
Ln (τ
S
)
Ln (
τ
L
)
Ln (
τ
S
)Ln (τ
S
)
Ln (
τ
L
)Ln (τ
L
)
Journal of NeuroEngineering and Rehabilitation 2008, 5:12 />Page 9 of 10
(page number not for citation purposes)
One possible limitation of the present study was that sub-
jects walked on a motorized treadmill. Treadmill walking
can reduce the natural variability [31,49] and enhance the
local stability [31] and, to a lesser extent, the orbital sta-
bility [42] of locomotor kinematics. This may be because
walking speed is strictly enforced on the treadmill, allow-
ing subjects fewer options for altering their gait speed
and/or walking kinematics. The present study needed to
be conducted on a motorized treadmill so that walking
speeds could be controlled experimentally and to provide
the Stroop test intervention. Because each subject walked
at the same speed under both conditions, this ensured
that comparisons of the variability and dynamic stability
between the two walking tasks would remain valid and
would not be confounded by subjects changing their gait
speed.
None of the subjects tested in this study fell, or even stum-
bled, during these experiments. As such, the present study
was limited to experimentally quantifying how these sub-
jects responded to those small perturbations that occur
naturally during normal walking [10,32]. Therefore, these
results may or may not extend to global stability [39],
where the response of the system to much larger perturba-
tions, like tripping or slipping (e.g., [50,51]), would be
assessed. Clearly, there is a limit to the magnitude of per-
turbations that humans can accommodate and we do not
know how much inherent local or orbital instability
humans can tolerate while remaining globally stable. Pre-
vious studies showing that obstacle avoidance is also
impaired while walking and performing concurrent cog-
nitive tasks [16,17] suggest that global stability is likely
also impaired during dual-tasking situations. The present
findings, along with our previous work [9,10,35], suggest
that the underlying mechanisms responsible for govern-
ing local and/or orbital dynamic stability in human loco-
motion are likely related in some way to those governing
global stability. One important line of future research will
be to determine if subtle changes in the dynamic stability
properties quantified here can also be used to predict the
resilience of humans to much larger perturbations.
Competing interests
The authors declare that they have no competing interests.
Authors' contributions
MDG and JBD conceived the study. MDG and KLT con-
ducted the experiments and collected the data. JBD evalu-
ated the data and results and was responsible for the
initial drafting of the manuscript. RTR wrote/modified
software necessary for the analysis and was involved in
drafting and revising the manuscript. All authors read and
approved the final manuscript.
Acknowledgements
This work was partially funded by NIA R01AG10557 awarded to MDG, by
Whitaker Foundation Biomedical Engineering Research Grant #RG-02-
0354 awarded to JBD, and by a University of Texas Preemptive Fellowship
awarded to RTR. The authors wish to acknowledge the assistance of Rijuta
Dhere, who was instrumental in the collection of the data, and of Hyun Gu
Kang and Jimmy Su, who helped develop the dynamic stability analysis algo-
rithms used in the present study.
References
1. Englander F, Hodson TJ, Terregrossa RA: Economic dimensions of
slip and fall injuries. J Forensic Sci 1996, 41(5):733-746.
2. Fuller GF: Falls in the elderly. Am Fam Physician 2000,
61(7):2173-2174.
3. Richardson JK, Hurvitz EA: Peripheral Neuropathy: A True Risk
Factor for Falls. J Gerontol A Biol Sci Med Sci 1995,
50(4):M211-M215.
4. Forster A, Young J: Incidence and Consequences of Falls Due to
Stroke: A Systematic Inquiry. BMJ 1995, 311(6997):83-86.
5. Hausdorff JM, Schaafsma JD, Balash Y, Bartels AL, Gurevich T, Giladi
N: Impaired regulation of stride variability in Parkinson's dis-
ease subjects with freezing of gait. Exp Brain Res 2003,
149(2):187-194.
6. Ganz DA, Bao Y, Shekelle PG, Rubenstein LZ: Will My Patient Fall?
JAMA 2007, 297(1):77-86.
7. Tinetti ME, Doucette J, Claus E, Marottoli R: The contribution of
predisposing and situational risk factors to serious fall inju-
ries. J Am Geriatr Soc 1995, 43(11):1207-1213.
8. Niino N, Tsuzuku S, Ando F, Shimokata H: Frequencies and cir-
cumstances of falls in the National Institute for Longevity
Sciences, Longitudinal Study of Aging (NILS-LSA). J Epidemiol
2000, 10(1 Suppl.):S90-S94.
9. Dingwell JB, Marin LC: Kinematic Variability and Local
Dynamic Stability of Upper Body Motions When Walking at
Different Speeds. J Biomech 2006, 39(3):444-452.
10. Dingwell JB, Cusumano JP: Nonlinear Time Series Analysis of
Normal and Pathological Human Walking. Chaos 2000,
10(4):848-863.
11. Woollacott M, Shumway-Cook A: Attention and the control of
posture and gait: A review of an emerging area of research.
Gait & Posture 2002, 16(1):1-14.
12. Lajoie Y, Teasdale N, Bard C, Fleury M: Attentional Demands for
Static and Dynamic Equilibrium. Exp Brain Res 1993,
97(1):139-144.
13. Ebersbach G, Dimitrijevic MR, Poewe W: Influence of Concurrent
Tasks on Gait: A Dual-Task Approach. Percept Motor Skills 1995,
81:107-113.
14. Sparrow WA, Bradshaw EJ, Lamoureux E, Tirosh O: Ageing effects
on the attention demands of walking. Hum Mov Sci 2002, 21(5-
6):961-972.
15. Beauchet O, Dubost V, Gonthier R, Kressig RW: Dual-Task-
Related Gait Changes in Transitionally Frail Older Adults:
The Type of the Walking-Associated Cognitive Task Mat-
ters. Gerontology 2005, 51(1):48-52.
16. Weerdesteyn V, Schillings AM, van Galen GP, Duysens J: Distraction
affects the performance of obstacle avoidance during walk-
ing. J Mot Behav 2003, 35:53-63.
17. Chen HC, Schultz AB, Ashton-Miller JA, Giordani B, Alexander NB,
Guire KE: Stepping Over Obstacles: Dividing Attention
Impairs Performance of Old More Than Young Adults. J Ger-
ontol A Biol Sci Med Sci 1996, 51A(3):M116-M122.
18. Hausdorff JM, Nelson ME, Kaliton D, Layne JE, Bernstein MJ, Nuern-
berger A, Fiatarone-Singh MA: Etiology and modification of gait
instability in older adults: a randomized controlled trial of
exercise. J Appl Physiol 2001, 90(6):2117-2129.
19. Hausdorff JM, Rios DA, Edelberg HK: Gait Variability and Fall
Risk in Community-Living Older Adults: A 1-Year Prospec-
tive Study. Arch Phys Med Rehabil 2001, 82(8):1050-1056.
20. Owings TM, Grabiner MD: Variability of step kinematics in
young and older adults. Gait & Posture 2004, 20(1):26-29.
21. Dean JC, Alexander NB, Kuo AD: The effect of lateral stabiliza-
tion on walking in young and old adults. IEEE Trans Biomed Eng
2007, 54(11):1919-1926.
Publish with BioMed Central and every
scientist can read your work free of charge
"BioMed Central will be the most significant development for
disseminating the results of biomedical research in our lifetime."
Sir Paul Nurse, Cancer Research UK
Your research papers will be:
available free of charge to the entire biomedical community
peer reviewed and published immediately upon acceptance
cited in PubMed and archived on PubMed Central
yours — you keep the copyright
Submit your manuscript here:
/>BioMedcentral
Journal of NeuroEngineering and Rehabilitation 2008, 5:12 />Page 10 of 10
(page number not for citation purposes)
22. Maki BE: Gait Changes in Older Adults: Predictors of Falls or
Indicators of Fear? J Am Geriatr Soc 1997, 45(3):313-320.
23. Sheridan PL, Solomont J, Kowall N, Hausdorff JM: Influence of
executive function on locomotor function: divided attention
increases gait variability in Alzheimer's disease. J Am Geriatr
Soc 2003, 51(11):1633-1637.
24. Hausdorff JM, Balash J, Giladi N: Effects of cognitive challenge on
gait variability in patients with Parkinson's Disease. J Geriatr
Psychiatry Neurol 2003, 16(1):53-58.
25. Grabiner MD, Troy KL: Attention demanding tasks during
treadmill walking reduce step width variability in young
adults. J Neuroeng Rehabil 2005, 2:25.
26. Stroop JR: Studies of interference in serial verbal reactions. J
Exp Phychol 1935, 18:643-661.
27. Lipsitz LA: Dynamics of Stability: The Physiologic Basis of
Functional Health and Frailty. J Gerontol A Biol Sci Med Sci 2002,
57(3):B115-125.
28. Owings TM, Grabiner MD: Step width variability, but not step
length variability or step time variability, discriminates gait
of healthy young and older adults during treadmill locomo-
tion. J Biomech 2004, 37(6):935-938.
29. Moe-Nilssen R, Helbostad JL: Interstride trunk acceleration var-
iability but not step width variability can differentiate
between fit and frail older adults. Gait & Posture 2005,
21(2):164-170.
30. Brach JS, Berlin JE, VanSwearingen JM, Newman AB, Studenski SA:
Too much or too little step width variability is associated
with a fall history in older persons who walk at or near nor-
mal gait speed. J Neuroeng Rehabil 2005, 2(1):21.
31. Dingwell JB, Cusumano JP, Sternad D, Cavanagh PR: Local Dynamic
Stability Versus Kinematic Variability of Continuous Over-
ground and Treadmill Walking. J Biomech Eng 2001,
123(1):27-32.
32. Dingwell JB, Kang HG, Marin LC:
The Effects of Sensory Loss and
Walking Speed on the Orbital Dynamic Stability of Human
Walking. J Biomech 2007, 40(8):1723-1730.
33. Li L, Haddad JM, Hamill J: Stability and variability may respond
differently to changes in walking speed. Hum Mov Sci 2005,
24(2):257-267.
34. Prince F, Winter DA, Stergiou P, Walt SE: Anticipatory Control of
Upper Body Balance During Human Locomotion. Gait & Pos-
ture 1994, 2:19-25.
35. Kang HG, Dingwell JB: A Direct Comparison of Local Dynamic
Stability During Standing and Walking. Exp Brain Res 2006,
172(1):35-48.
36. Kantz H, Schreiber S: Nonlinear Time Series Analysis, 2nd Ed.
Cambridge, UK. , Cambridge University Press; 2004.
37. Winter DA: Biomechanics and Motor Control of Human
Movement, 3rd Ed. New York, NY , John Wiley & Sons, Inc.; 2005.
38. England SA, Granata KP: The influence of gait speed on local
dynamic stability of walking. Gait & Posture 2007, 25(2):172-178.
39. Nayfeh AH, Balachandran B: Applied Nonlinear Dynamics: Ana-
lytical, Computational, and Experimental Methods. In Wiley
Series in Nonlinear Science Edited by: Nayfeh AL, Holden AV. New
York, New York. , John Wiley & Sons,; 1995.
40. Rosenstein MT, Collins JJ, DeLuca CJ: A Practical Method For
Calculating Largest Lyapunov Exponents From Small Data
Sets. Physica D 1993, 65:117-134.
41. Hurmuzlu Y, Basdogan C, Stoianovici D: Kinematics And
Dynamic Stability of the Locomotion of Post-Polio Patients.
In J Biomech Eng Volume 118. Issue 3 American Society of Mechanical
Engineers; 1996:405-411.
42. Kang HG, Dingwell JB: Separating the Effects of Age and Speed
on Gait Variability During Treadmill Walking. Gait Posture
2008, 27(4):572-7.
43. Timmer J, Häussler S, Lauk M, Lücking CH: Pathological Tremors:
Deterministic Chaos or Nonlinear Stochastic Oscillators?
Chaos 2000, 10(1):278-288.
44. Donelan JM, Shipman DW, Kram R, Kuo AD: Mechanical and met-
abolic requirements for active lateral stabilization in human
walking. J Biomech
2004, 37(6):827-835.
45. Jamet M, Deviterne D, Gauchard GC, Vancon G, Perrin PP: Higher
visual dependency increases balance control perturbation
during cognitive task fulfilment in elderly people. Neurosci Lett
2004, 359(1-2):61-64.
46. Chen Z: Attentional focus, processing load, and Stroop inter-
ference. Percept Psychophys 2003, 65(6):888-900.
47. Vallee M, McFadyen BJ, Swaine B, Doyon J, Cantin JF, Dumas D:
Effects of Environmental Demands on Locomotion After
Traumatic Brain Injury. Arch Phys Med Rehabil 2006,
87(6):806-813.
48. Warren WH, Kay BA, Zosh WD, Duchon AP, Sahuc S: Optic Flow
is Used to Control Human Walking. Nat Neurosci 2001,
4(2):213-216.
49. Wank V, Frick U, Schmidtbleicher D: Kinematics and Electromy-
ography of Lower Limb Muscles in Overground and Tread-
mill Running. Int J Sports Med 1998, 19(7):455-461.
50. Pavol MJ, Owings TM, Foley KT, Grabiner MD: Mechanisms Lead-
ing to a Fall From an Induced Trip in Healthy Older Adults.
J Gerontol A Biol Sci Med Sci 2001, 56A(7):M428-M437.
51. Smeesters C, Hayes WC, McMahon TA: Disturbance Type and
Gait Speed Affect Fall Direction and Impact Location. J Bio-
mech 2001, 34(3):309-317.