báo cáo hóa học: "Reliability and validity of pendulum test measures of spasticity obtained with the Polhemus tracking system from patients with chronic stroke" pot
Bạn đang xem bản rút gọn của tài liệu. Xem và tải ngay bản đầy đủ của tài liệu tại đây (453.27 KB, 7 trang )
BioMed Central
Page 1 of 7
(page number not for citation purposes)
Journal of NeuroEngineering and
Rehabilitation
Open Access
Research
Reliability and validity of pendulum test measures of spasticity
obtained with the Polhemus tracking system from patients with
chronic stroke
Richard W Bohannon*, Steven Harrison and Jeffrey Kinsella-Shaw
Address: Department of Physical Therapy, Neag School of Education, University of Connecticut, Storrs, USA
Email: Richard W Bohannon* - ; Steven Harrison - ; Jeffrey Kinsella-
Shaw -
* Corresponding author
Abstract
Background: Spasticity is a common impairment accompanying stroke. Spasticity of the
quadriceps femoris muscle can be quantified using the pendulum test. The measurement properties
of pendular kinematics captured using a magnetic tracking system has not been studied among
patients who have experienced a stroke. Therefore, this study describes the test-retest reliability
and known groups and convergent validity of the pendulum test measures obtained with the
Polhemus tracking system.
Methods: Eight patients with chronic stroke underwent pendulum tests with their affected and
unaffected lower limbs, with and without the addition of a 2.2 kg cuff weight at the ankle, using the
Polhemus magnetic tracking system. Also measured bilaterally were knee resting angles, Ashworth
scores (grades 0–4) of quadriceps femoris muscles, patellar tendon (knee jerk) reflexes (grades 0–
4), and isometric knee extension force.
Results: Three measures obtained from pendular traces of the affected side were reliable
(intraclass correlation coefficient ≥ .844). Known groups validity was confirmed by demonstration
of a significant difference in the measurements between sides. Convergent validity was supported
by correlations ≥ .57 between pendulum test measures and other measures reflective of spasticity.
Conclusion: Pendulum test measures obtained with the Polhemus tracking system from the
affected side of patients with stroke have good test-retest reliability and both known groups and
convergent validity.
Introduction
Although controversy surrounds the definition of spastic-
ity, Lance described it as "a motor disorder characterized
by a velocity dependent increase in tonic stretch reflexes
(muscle tone) and increased tendon jerks resulting from
disinhibition of the stretch reflex, as one component of
the upper motor neuron lesion"[1]. Several tests have
been used for quantifying spasticity among patients with
diverse sources of upper motor neuron lesions, including
stroke, multiple sclerosis, spinal cord injury, and cerebral
palsy. Among such tests, the Ashworth [2] or Modified
Ashworth [3] are probably used most often. An alternative
to these tests' ordinal scales are the real number descrip-
tions of the knee extensors' response to stretch provided
Published: 30 July 2009
Journal of NeuroEngineering and Rehabilitation 2009, 6:30 doi:10.1186/1743-0003-6-30
Received: 16 October 2008
Accepted: 30 July 2009
This article is available from: />© 2009 Bohannon et al; licensee BioMed Central Ltd.
This is an Open Access article distributed under the terms of the Creative Commons Attribution License ( />),
which permits unrestricted use, distribution, and reproduction in any medium, provided the original work is properly cited.
Journal of NeuroEngineering and Rehabilitation 2009, 6:30 />Page 2 of 7
(page number not for citation purposes)
by the pendulum test. First described by Wartenberg, the
pendulum test depicts movement of the leg following its
drop from a horizontal position while subjects are
instructed to relax [4]. Since Waltenberg's initial publica-
tion, electrogoniometry [5-7], videography [7,8], and
magnetic sensing devices [9] have been used to character-
ize movement of the leg while it oscillates after being
dropped. Magnetic sensing devices are the most recent
technology to be employed, but their use with patients
who have experienced a stroke has been limited to date.
We were unable to identify any research that examined the
use of magnetic tracking systems during pendulum tests
of both lower limbs of patients following stroke. Moreo-
ver, we failed to find any literature addressing the per-
formance of the test with a weighted lower limb. Before
the pendulum test performed in conjunction with mag-
netic sensing devices can be recommended for use, it must
be shown to have acceptable measurement properties. We
therefore purposed to determine the intrasession reliabil-
ity and validity of the test performed with an unweighted
and weighted limb.
Methods
Subjects
Based on published information and our expectation that
the angle of first reversal of the pendulum test would dif-
fer by more than 20 degrees between the more and less
involved sides, our analysis suggested that a power of 80%
could be achieved with p < .05 with 8 subjects. Therefore,
after obtaining written informed consent, we enrolled 8
middle-aged and older, independently ambulatory indi-
viduals who had experienced a stroke more than 6
months before. The side of predominate weakness was the
right for 5 subjects and the left for 3 subjects. Five subjects
were women and 3 were men.
Procedures
Prior to performing the pendulum tests, several variables
were measured to describe the subjects and their neuro-
logic status. These included demographics (age, height,
weight, and time since stroke), sensory appreciation of
touch with a 5.07 monofilament on both distal lower
limbs and feet, comfortable gait speed over a 3 meter dis-
tance, resting angles of both knees while subjects were
supine with their legs hanging freely off the end of a test
table, Ashworth scores (grades 0–4) of bilateral quadri-
ceps femoris muscles, patellar tendon (knee jerk) reflexes
(grades 0–4) of both lower limbs, and isometric knee
extension force (Newtons) of each lower limb while sub-
jects were seated with their legs vertical.
The pendulum test was conducted while subjects were
supine on a padded table with their nontested leg sup-
ported. The test employed the Polhemus Liberty magnetic
position tracking system. Two sensors were positioned on
the tested lower limb, one laterally over the knee axis of
rotation and one just distal to the lateral malleolus (Figure
1). The system transmitter was placed in close proximity
on the floor. After checking calibration of the field sen-
sors, the tested leg was passively elevated to horizontal by
one of the investigators. Once relaxation was assured by
palpation of the patellar tendon, free mobilization of the
patella and slight hefts and releases of the leg, data capture
was initiated and the leg was dropped. Data capture ended
when the leg ceased swinging. This procedure was com-
pleted, in random order, twice without a cuff weight at the
ankle and twice with a cuff weight (5 lb/2.27 kg) at the
ankle. After all subjects were tested, files were imported to
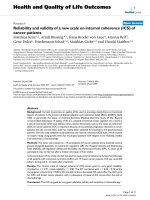
Matlab for characterization of pendular kinematics. Char-
acterization consisted of three measures (Figure 2): 1)
First angle of reversal, when leg motion first switched
from flexion to extension, 2) Area under the curve, the
area between the knee angle during oscillations and rest-
ing angle, and 3) Velocity to first reversal, the change in
knee angle between starting position and first reversal
divided by time to first reversal.
Data analysis
The Statistical Package for Social Sciences was used for all
analysis. Summary statistics were calculated. These
involved medians and minimum to maximum values for
most measurements as the sample sizes were small, they
were ordinal in nature, or they not normally distributed.
Measurements derived from pendulum tests were an
exception. Reliability of the pendulum test measures was
established by the intraclass correlation coefficient (ICC).
Two aspects of validity were examined statistically: known
groups and convergent. Known groups validity entailed
using Wilcoxon tests to determine if the pendulum test
measures differed significantly between the uninvolved
and involved side of the subjects. Convergent validity
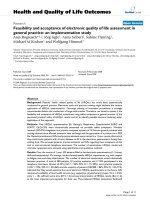
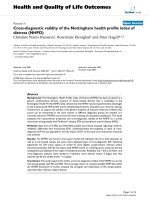
Line drawing illustrating pendulum test performed with sub-ject supine and leg swinging freely with motion sensors attached and weight secured at ankleFigure 1
Line drawing illustrating pendulum test performed
with subject supine and leg swinging freely with
motion sensors attached and weight secured at
ankle.
Journal of NeuroEngineering and Rehabilitation 2009, 6:30 />Page 3 of 7
(page number not for citation purposes)
required the calculation of Spearman correlations (r
s
) to
determine if significant relationships existed between the
pendulum test measures and other relevant measures of
motor status of the involved side.
Results
Subjects were all either middle-age or older adults. Their
height and weight are reported along with other descrip-
tive information in Table 1. Only one subject failed to
appreciate touch with the 5.07 monofilament and for that
subject, the impairment was limited to the affected lower
limb. All subjects walked at less than a meter per second.
All had resting knee angles of less than 90 degrees. No
subject's unaffected quadriceps demonstrated increased
tone (resistance to stretch) during Ashworth testing, but
most had some increase in tone on the affected side. Most
had knee jerks that were below normal (2/4) on the unaf-
fected side but above normal on the affected side. The
subjects' median knee extension force on the affected side
was 74.1 percent of that on the unaffected side.
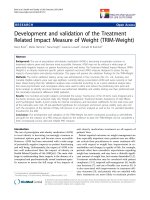
Pendulum test traces for all subjects are presented in Fig-
ure 3. Table 2 summarizes the ICCs associated with the
various pendulum test measures obtained from the traces.
With the exception of the ICC associated with the velocity
to first reversal during testing with no weight on the unaf-
fected side (ICC = .212), all ICCs (.651 to .844) were sig-
nificant (p < .05). Table 3 compares the pendulum test
measures between the affected and unaffected sides. Sup-
porting the known groups validity of the measures, all dif-
fered significantly between sides whether or not the test
was supplemented with a weight. Convergent validity of
the pendulum test measures was affirmed by their strong
Representative pendulum test tracing with angle of first reversal identified (large trace) and area under curve high-lighted (small insert)Figure 2
Representative pendulum test tracing with angle of
first reversal identified (large trace) and area under
curve highlighted (small insert).
Table 1: Summary statistics describing subjects and measurements (excluding pendulum tests) obtained from them.
Variable Median Min-Max
Age (yr) 65.5 46–83
Height (cm) 159.7 154.3–171.4
Weight (kg) 63.9 49.5–93.6
Gait speed (cm/sec) 84.0 21.9–97.2
Resting knee angle: affected side (degrees) 65.0 24.0–74.0
Resting knee angle: unaffected side (degrees) 65.5 56.0–72.0
Ashworth grade-quadriceps: affected side (0–4) 1.5 0–3
Ashworth grade-quadriceps: unaffected side (0–4) 0 0–0
Knee jerk: affected side (0–4) 2.5 2–4
Knee jerk: unaffected side (0–4) 1.0 0–4
Knee extension force: affected side (Newtons) 202.8 93.4–400.2
Knee extension force: unaffected side (Newtons) 273.5 169.0–591.4
Journal of NeuroEngineering and Rehabilitation 2009, 6:30 />Page 4 of 7
(page number not for citation purposes)
correlations (.81 to .99) with one another (Table 4). Their
validity is further supported by their good correlations
with most other motor measures (Table 4). On the
involved side, lesser angles of first reversal, smaller areas
under the curve, and slower velocities to first reversal were
all associated with smaller resting angles (r
s
= .57 to .71),
higher Ashworth scores (r
s
= 63 to 89), greater knee
jerks (r
s
= 64 to 79), and lower knee extension forces (r
s
= .59 to .76). However, only the angles of first reversal
were significantly correlated (r
s
= .71 to 80, p ≤ ,01) with
all of these measures. None of the pendulum test meas-
ures correlated significantly (r
s
= .27 to .57) with gait
speed.
Discussion
This study demonstrated that a magnetic tracking system
can be used to characterize the pendular kinematics of the
leg and thus quantify spasticity of the quadriceps femoris
muscles of patients with stroke. By conducting repeated
pendulum tests on both the affected and unaffected sides
Table 2: Intraclass correlation coefficients (ICCs) for repeated pendulum test measures
Measure ICC (p) 95% Confidence Interval
Lower Upper
First Reversal (no weight): affected side .956 (.001) .798 .991
First Reversal (weight): affected side .974 (.001) .876 .995
First Reversal (no weight): unaffected side .630 (.034) 063 .913
First Reversal (no weight): unaffected side .863 (.001) .463 .971
Area under curve (no weight): affected side .920 (.001) .656 .983
Area under curve (weight): affected side .871 (.001) .487 .973
Area under curve (no weight): unaffected side .933 (.001) .705 .986
Area under curve (weight): unaffected side .976 (.001) .886 .995
Velocity to first reversal (no weight): affected side .957 (.001) .804 .991
Velocity to first reversal (weight): affected side .844 (.001) .405 .967
Velocity to first reversal (no weight): unaffected side .212 (.292) 592 .770
Velocity to first reversal (weight): unaffected side .651 (.029) 027 .919
Table 3: Paired comparisons relevant to known groups validity of the pendulum test
Measures Affected
Mean (SD)
Unaffected
Mean (SD)
Wilcoxon Test
Z(p)
First Reversal-No Weight (degrees) 54.7 (25.4) 99.4 (12.8) -2.383 (.017)
First Reversal-Weight (degrees) 70.5 (30.9) 109.9 (9.5) -2.383 (.017)
Area Under Curve-No Weight (degrees*seconds) 24.0 (14.3) 45.4 (23.7) -2.100 (.036)
Area Under Curve-Weight (degrees*seconds) 37.1 (26.0) 73.2 (46.5) -1.960 (.050)
Velocity to First Reversal-No Weight (degrees/second) 164.5 (56.5) 240.1 (27.5) -2.240 (.025)
Velocity to First Reversal-Weight (degrees/second) 173.4 (54.7) 233.6 (27.1) -1.960 (.050)
Journal of NeuroEngineering and Rehabilitation 2009, 6:30 />Page 5 of 7
(page number not for citation purposes)
and by employing other tests meant to reflect spasticity,
we were able to examine the reliability and validity of the
test as well.
Measurements obtained with the magnetic tracking sys-
tem, like those acquired previously using electrogoniom-
eter and video based systems [6,8,10,11], tended to be
reliable. Exceptions were 3 measurements from the unaf-
fected side, which is less likely to be the target of clinical
testing anyway. Whether the measurements are reliable
across longer periods of time (eg days) and how much of
a change would be required to assume a real difference
remains to be determined.
The measurements obtained in this study were found to
possess both known groups and convergent validity. The
known groups in this study were the affected and unaf-
fected sides of the patients with stroke. Unlike Fowler et al
[12], we found a difference in angle of first reversal and
velocity between sides. Whether measurements obtained
from the patients differ from those of control subjects, as
they did in the study of Fowler et al, is unknown as we did
not have a control group.
If the different measures obtained from the pendulum test
(ie, angle of first reversal, area under the curve, velocity)
are measuring the same underlying variable, they would
be expected to converge (correlate highly), which they
did. Moreover, if that variable is spasticity, meaningful
correlations between the pendulum test measures and
other tests reflective of spasticity (eg, Ashworth) might be
anticipated. Based on Feinstein's characterization of corre-
lations as quite good in medical research if they surpass
.50 [13], we interpret the correlations between measures
of spasticity in our study to be meaningful even if all were
not significant. The correlation between pendulum test
and Ashworth scale grades supports previous work of Les-
lie et al who reported a correlation of 878 between a pen-
dulum test measure and Ashworth grades for 14 patients
with multiple sclerosis [14]. The correlations between
pendulum test measures and gait speed in our study fell
below the .50 criterion of Feinstein. Thus, while the pen-
dulum test is supported as a measure of impairment, its
ability to explain an activity limitation such as gait speed
was more limited. Although Francis et al have argued that
a reduction in spasticity can result in improved function
[15], the meta-analysis leading to their conclusion
focused on the upper limb. Studies using the pendulum
test and other measures to document spasticity in the
lower limbs have not shown it to explain reductions in
gait speed [11,16,17].
While the objectivity, reliability, and validity of the pen-
dulum test and the simplicity and portability of the Pol-
hemus tracking system provide support for its use, the
convergent validity of the measures obtained with the sys-
tem suggests little advantage of the area under the curve
and velocity measures over the angle of first reversal meas-
ure. That angle, also called the "first swing excursion," was
described by Fowler et al as the "most sensitive outcome
measure" in persons with cerebral palsy [18]. There are
other measures that can be obtained from pendulum test
Table 4: Spearman correlations (probabilities) relevant to the convergent validity of the pendulum test
Measures First Reversal-NW First Reversal-W AUC-NW AUC-W Velocity-NW Velocity-W
First Reversal-W .99 (.001)
AUC-NW .96 (.001) .96 (.001)
AUC-W .91 (.002) .91 (.002) .91 (.002)
Velocity-NW .96 (.001) .96 (.001) .86 (.007) .81 (.015)
Velocity-W .96 (.001) .96 (.001) .87 (.005) .92 (.001)
Rest Angle .71 (.050) .71 (.050) .67 (.071) .57 (.139) .62 (.102) .64 (.091)
Ashworth 80 (.018) 80 (.018) 73 (.040) 63 (.094) 85 (.007) 89 (.003)
Knee Jerk 76 (.028) 76 (.028) 79 (.019) 67 (.070) 64 (.086) 76 (.028)
Knee Force .73 (.040) .73 (.040) .76 (.028) .57 (.139) .67 (.071) .59 (.126)
Gait Speed .49 (.217) .49 (.217) .57 (.139) .45 (.260) .31 (.456) .27 (.509)
*AUC = area under curve, W = weight, NW = no weight
Journal of NeuroEngineering and Rehabilitation 2009, 6:30 />Page 6 of 7
(page number not for citation purposes)
Pendulum test traces from all subjectsFigure 3
Pendulum test traces from all subjects. Those on the left are from the unaffected side while those on the right are from
the affected side. Blue dashed lines represent traces obtained without weights whereas red solid lines represent traces
obtained with weights.
Publish with BioMed Central and every
scientist can read your work free of charge
"BioMed Central will be the most significant development for
disseminating the results of biomedical research in our lifetime."
Sir Paul Nurse, Cancer Research UK
Your research papers will be:
available free of charge to the entire biomedical community
peer reviewed and published immediately upon acceptance
cited in PubMed and archived on PubMed Central
yours — you keep the copyright
Submit your manuscript here:
/>BioMedcentral
Journal of NeuroEngineering and Rehabilitation 2009, 6:30 />Page 7 of 7
(page number not for citation purposes)
traces (eg, number of oscillations, angle of first reversal
with reference to resting angle) [10,18] that were not
derived or tested in our study. Their measurement proper-
ties may or may not be comparable to those of the meas-
ures tested. As expected, adding weight to the ankle during
the pendulum test altered pendular kinematics. Presuma-
bly it contributed to the inertia of the leg against which
the quadriceps and spasticity served as a brake. Still, the
addition of the weight did not improve the measurement
properties of the pendulum test and can therefore be
judged unnecessary.
Conclusion
Pendulum test measures obtained with the Polhemus
tracking system from the affected side of patients with
stroke have good test-retest reliability. The measures also
demonstrate both known groups and convergent validity.
List of abbreviations
ICC: intraclass correlation coefficient; r
s
: Spearman rho
correlation; lb: pound; kg: kilogram.
Competing interests
The authors declare that they have no competing interests.
Authors' contributions
RWB conceived of the study, contributed to its design,
recruited subjects, tested subjects, conducted data analy-
sis, and wrote the original draft of the manuscript. SH
contributed to the design of the study, helped to test sub-
jects, generated graphics, and helped to write the manu-
script. JK-S recruited subjects, helped to test subjects, and
helped to write the manuscript. All authors read and
approved the final manuscript.
References
1. Lance J: Symposium synopsis. In Spasticity disordered motor control
Edited by: Feldman RJ, Young RR, Koella WP. Chicago: Year Book;
1980:485-494.
2. Ashworth B: Preliminary trial of carisoprodol in multiple scle-
rosis. Practitioner 1964, 192:540-542.
3. Bohannon RW, Smith MB: Interrater reliability of a modified
Ashworth scale of muscle spasticity. Phys Ther 1987,
67:206-207.
4. Wartenberg R: Pendulousness of the legs as a diagnostic test.
Neurology 1951, 1:18-24.
5. Bajd T, Vodovnik L: Pendulum testing of spasticity. J Biomed Eng
1984, 6:9-16.
6. Bohannon RW: Variability and reliability of the pendulum test
for spasticity using a Cybex II isokinetic dynamometer. Phys
Ther 1987, 67:659-661.
7. Jamshidi M, Smith AW: Clinical measurement of spasticity using
the pendulum test: comparison of electrogoniometric and
videotape analyses. Arch Phys Med Rehabil 1996, 77:1129-1132.
8. Stillman B, McMeeken J: A video-based version of the pendulum
test: technique and normal response. Arch Phys Med Rehabil
1995, 76:166-176.
9. Fee JW, Miller F: The leg drop pendulum test performed under
general anesthesia in spastic cerebral palsy. Dev Med Child Neu-
rol 2004, 46:273-281.
10. White H, Uhl TL, Augsburger S, Tylkowski C: Reliability of the
three-dimensional pendulum test for able-bodied children
and children diagnosed with cerebral palsy. Gait Posture 2007,
26:97-105.
11. Bohannon RW, Andrews AW: Correlation of knee extensor
muscle torque and spasticity with gait speed in patients with
sroke. Arch Phys Med Rehabil 1990, 71:330-333.
12. Fowler V, Canning CG, Carr JH, Shepherd RB: Muscle length effect
on the pendulum test. Arch Phys Med Rehabil
1998, 79:169-171.
13. Feinstein AR: Clinical Epidemiology. Philadelphia: W.B. Saunders;
1985.
14. Leslie GC, Muir C, Part NJ, Roberts RC: A comparison of the
assessment of spasticity by the Wartenberg pendulum test
and the Ashworth grading scale in patients with multiple
sclerosis. Clin Rehabil 1992, 6:41-48.
15. Francis HP, Wade DT, Turner-Stokes L, Kingswell RS, Dott CS,
Coxon EA: Does reducing spasticity translate into functional
benefit? An exploratory meta-analysis. J Neurol Neurosurg Psy-
chiatry 2004, 75:1547-1551.
16. Ada L, Vattanasilp W, O'Dwyer NJ, Crosbie J: Does spasticity con-
tribute to walking dysfunction after stroke? J Neurol Neurosurg
Psychiatry 1998, 64:628-635.
17. Hsu AL, Tang PF, Jan MH: Analysis of impairments influencing
gait velocity and asymmetry of hemiplegic patients after
mild to moderate stroke. Arch Phys Med Rehabil 2003,
84:1185-1193.
18. Fowler EG, Nwigwe AI, Ho TW: Sensitivity of the pendulum test
for assessing spasticity in persons with cerebral palsy. Dev
Med Child Neurol 2000, 42:182-189.