Developments in Heat Transfer Part 12 ppt
Bạn đang xem bản rút gọn của tài liệu. Xem và tải ngay bản đầy đủ của tài liệu tại đây (3.17 MB, 40 trang )
increases MRR. Higher flushing pressure hinders the formation of ionized bridges across the
gap and results in higher ignition delay and decrease discharge energy and reduces MRR.
It was found by many researchers that the influential machining factors on MRR are the
current intensity and voltage.
Usually EDM is carried out by electrical sparks between the electrode and the workpiece
using a single discharge for each electrical pulse. Some researchers have carried out
experiments using a multi-electrode discharging system, delivering additional discharge
simultaneously from a corresponding electrode connected serially. The design of electrode
was based on the concept of dividing an electrode into multiple electrodes, which are
electrically insulated. The energy efficiency were claimed to be better than the conventional
EDM without any significant difference in work suface finish.
Material removal rate is expressed as the ratio of the difference in volume of the workpiece
before and after machining to the machining time, i.e.:
volume o
f
material removed
f
rom the work
p
iece
MRR
machining time
=
WPV WPW
MRR
M
−
=
BA
T
where WPVB and WPWA are the volumes of the workpiece before and after machining
and
M
T
is the machining time.
Material removal rate vs current
-5
0
5
10
15
20
25
30
35
0510
current (A)
material removal
rate(mm3/min)
Cu-Al
Cu-Steel
Brass-Al
Brass-Steel
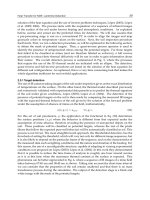
Fig. 13. Relationship between current and MRR
Relationship of MRR with current during machining of aluminum and steel using brass and
copper electrodes are illustrated in Fig. 13. It is to be noted that at a low current MRR is very
low, but with increase in current MRR increases sharply. At a low current, a small quantity
of heat is generated and a substantial portion of it is absorbed by the surroundings and the
machine components and the left of it is utilized in melting and vaporizing the work
material. But as the current is increased, a stronger spark with higher energy is produced,
more heat is generated and a substantial quantity of heat is utilized in material removal.
However, the highest material removal rate was observed during machining of aluminum
using copper electrodes. Comparatively low thermal conductivity of brass as an electrode
material doesn’t allow absorbing much of the heat energy and most of the heat is utilized in
removal of material from aluminum workpiece of low melting point. But during machining
of steel using copper electrodes, comparatively smaller quantity of heat is absorbed by the
work material due to its low thermal conductivity. As a result MRR becomes very low.
4.4 Micro cracks
During the spark discharge in EDM the temperature is usually in the range of 8,000°C to
20,000°C. After the spark the work surface is immediately cooled rapidly by the dielectric
fluid. Repeated heating to a very high temperature followed by rapid cooling develops
micro-cracks on the work surface. Micro-cracks on the work surface are a major problem in
EDM. They strongly influence on the fatigue strength of the part machined by EDM. Micro-
cracks in the surface and loose grains in the subsurface resulted from thermal shock causes
surface damage and leads to degradation of both strength and reliability. Comparing the
SEM images in Fig. 14 it can be observed that more micro-cracks were formed during EDM
with a higher current of 6.5 Amp as shown in Fig. 14 (a) compared to that with a low current
of 2.5 Amp as illustrated in Fig. 14 (b). More heat is developed during EDM at a higher
current heating the work surface to a higher temperature followed by rapid cooling. As a
result more micro-cracks are found at a higher current. A larger t
on
results more cracks as it
can be observed comparing the Figs. 14 (c) and 14 (d). However, it was suggested by Lee &
Tai, 2003 that when the pulse voltage is maintained at a constant value of 120 V, it is
possible to avoid the formation of cracks if machining is carried out with a current in the
range of 12-16 A together with pulse duration of 6-9 µs.
4.5 Recast layer
There are three layers created on the top of the base metal which are spattered EDM surface
layer, recast layer and Heat Affected Zone (HAZ). Recast layer consists of dielectric fluid,
molten electrode and molten workpiece that are melted during EDM machining and
solidified. Usually recast layer has a higher hardness when compared to the base metal. The
recast layer is also known as white layer because it often appears as a bright white layer in a
sectional view under magnification. It occurs as the second layer under the spattered EDM
surface layer. This layer is formed by the un-expelled molten metal solidifying in the crater.
The recast layer is usually very thin and it can be removed by finishing operations. Recast
layer can cause problems in some applications due to stress cracking or premature failure.
Recast structure greatly affects die fatigue strength and shortens its service life. This is
because the recast layers have micro-cracks and discharge craters that cause bad surface
quality. HAZ consists of two layers: a hardened layer and the annealed layer. The depth of
the hardened layer depends on the machining conditions. Usually the depth is 0.002mm for
finish cut and 0.012 mm for rough cut. Below the hardened layer there is a layer which was
cooled slowly and as a result, the layer is annealed. Its hardness is 2 to 5 points below the
same of the base metal. Its thickness may be 0.05mm for finish cut and 0.2mm for rough
cut.
(a) I=6.5 Amp; t
on
=10 µs
(b) I=2.5 Amp; t
on
=10 µs
(c) I=2.5 Amp; t
on
=10 µs
(d) I=2.5 Amp; t
on
=3 µs
Fig. 14. Influence of current and pulse-on time on micro cracks
As stated above, a higher current and a higher pulse-on time produce a spark with more
energy, melt more materials from the workpiece and the electrode. Consequently higher
thickness of recast layer is found at a current of 6.5 Amp, Fig. 15 (a) compared to that at a
current of 2.5 Amp, Fig. 15 (b). Similarly, thickness of the recast layer was found to be at a
higher pulse-on time, Fig. 15 (c) compared to that at a shorter pulse-on time, Fig. 15 (d).
Hwa-Teng Lee et al., 2004 also stated that R
a
and average white layer thickness tend to
increase at higher values of pulse current and t
on
. However, they found that for extended
pulse-on duration MRR, R
a
and crack density all decrease.
(a) t
av
22.1 µm: I= 6.5 Amp; t
on
=10µs
(b) t
av
18.1 µm: I= 2.5 Amp; t
on
=10 µs
(c) t
av
21.3 µm: I= 2.5 Amp; t
on
=10 µs
(d) t
av
12.5 µm: I= 2.5 Amp; t
on
=1.5 µs
Fig. 15. Thickness of recast layer at different machining conditions
5. Conclusion
From the above discussions the following conclusions can be drawn:
1.
Electrodes undergo more wear along its cross-section compared to that along its length.
2.
Electrode wear increases with increase in current and voltage. Wear of copper
electrodes is less than that of brass electrodes. This is due to the higher thermal
conductivity and melting point of copper compared to those of brass.
3.
During machining of mild steel, electrodes undergo more wear than during machining
of aluminum. This is due to the fact that thermal conductivity of aluminum is higher to
that of mild steel which causes comparatively more heat energy to dissipate into the
electrode during machining of mild steel.
4.
Wear ratio decreases with increase in current, but decreases with increase in gap
voltage. The highest wear ratio was found during machining of aluminum using a
copper electrode.
5.
MRR increases sharply with increase in current. In the present study, highest MRR was
obtained during machining of aluminum using a brass electrode.
6.
Micro cracks are found on the machined surface. The tendency of formation of micro
cracks increases during EDM with a higher current and larger pulse-on time.
7.
A recast layer was found on the machined surface which consists of the molten
materials from the workpiece and the electrode that could not be flushed away
completely by the dielectric fluid. A thicker layer of recast layer was formed on the
work surface machined with a higher current and pulse-on time.
6. Acknowledgement
The author of this work is indebted to the Research Management Center, International
Islamic University Malaysia (IIUM) for its continuous help during the research work. Also,
the author likes to appreciate the help of the staff and the technicians of the Department of
Manufacturing and Materials Engineering, International Islamic University Malaysia.
7. References
Bleys, P.; Kruth, P. & Lauwers, B. (2004). Sensing and compensation of tool wear in milling EDM.
Journal of Materials Processing Technology, vol.149, No.1-3, pp. 139-146, ISSN 0924-0136
Bulent, E.; Erman, A. & Abdulkadir E. (2006). A semi-empirical approach for residual
stresses in electric discharge machining (EDM). International Journal of Machine Tool
& Manufacture. Vol.46, pp. 858-865, ISSN 0890-6955
Dibitonto, D.; Eubank, T.; Patel, R. & Barrufet, A. (1989).Theoretical models of the electro
discharge machining process–a simple cathode erosion model. Journal of Applied
Physics, vol.69, pp. 4095-4103, ISSN 0021-8979
Ghosh, A. & Mallik, K. (1991). Electrical Discharge Machining, In: Manufacturing Science,
383-403, Affiliated East- West Press Private Limited, ISBN 81-85095-85-X, New
Delhi, India.
Ho, H. & Newman, T. (2003). State of the art electrical discharge machining (EDM).
International Journal of Machine Tools and Manufacture, vol.43, No.13, pp. 1287-1300,
ISSN 0890-6955
Hu, F. Zhou, C. & Bao, W. (2008). Material removal and surface damage in EDM of Ti3SiC2
ceramic. Ceramics International, vol.34, issue 3, pp. 537-541, ISSN 0272-8842
Hwa-Teng, L.; Fu-ChuanHsu & Tzu-Yao, T. (2004). Study of surface integrity using the small
area EDM process with a copper–tungsten electrode, Materials Science and
Engineering A, vol. 364, issues 1-2, pp. 346-356, ISSN 0025-5416
Kalpakjian, S. Schmid, R. (2001). Electrical-discharge machining, in: Manufacturing Engineering
and Technology, 6
th
edition, Prentice Hall, 769-774, Singapore
Khan, A. & Mridha, S. (2006). Performance of copper and aluminum electrode during EDM
of stainless steel and carbide. International Journal of Manufacturing and Production,
vol. 7, No.1, pp. 1-7, ISSN 0793-6648
Khanra, K.; Sarker, R.; Bhattacharya, B.; Pathak, C. & Godkhindi, M. (2007). Performance of
ZrB
2
–Cu composite as an EDM electrode. Journal of Materials Processing Technology,
vol.183, No.1, pp. 122-126, ISSN 0924-0136
Kunieda, M. & Kobayashi, T. (2004). Clarifying mechanism of determining tool electrode
wear ratio in EDM using spectroscopic measurement of vapor density. Journal of
Materials Processing Technology, vol.149, No. 1-3, pp. 284-288, ISSN 0924-0136
Lee, T. & Tai, Y. (2003). Relationship between EDM parameters and surface crack formation.
Journal of Materials Processing Technology, vol.142, issue 3, pp. 676-683, ISSN 0890-6955
Marafona, J. & Wykes. C. (2000). A new method of optimizing material removal rate using
EDM with copper-tungsten electrodes. International Journal of Machine Tools and
Manufacture, vol.40, pp. 153-164, ISSN 0890-6955
Marafona, J., & Chousal, G. (2006). A finite element model of EDM based on the Joule effect.
International Journal of Machine Tools & Manufacture, vol.46, pp. 595-602, ISSN 0890-6955
Pandey, C. & Jilani, T. (1986). Plasma channel growth and the resolidified layer in EDM.
Precision Engineering, Vol.8, issue 2, pp. 104-110, ISSN 0141-6359
Ozgedik, A. & Cogun, C. (2006). An experimental investigation of tool wear in electric
discharge machining. International Journal of Advance Manufacturing Technology.
Vol.27, pp. 488-500, ISSN 0268-3768
Patel, R.; Barrufet, A.; Eubank, T. & DiBitonto, D. (1989). Theoretical models of the electrical
discharge machining process-II: the anode model. Journal of Applied Physics, vol.66,
pp. 4104-4111, ISSN 0021-8979
Peter, Fonda.; Zhigang, Wang.; Kazuo, Yamazaki. & Yuji, A. (2007). A fundamental study on
Ti-6Al-4V’s thermal and electrical properties and their relation to EDM
productivity. Journal of Materials Processing Technology,
doi:10.1016/j.jmatprotec.2007.09.060, ISSN 0924-0136
Puertas, I.; Luis, J. & Alvarez, L. (2004). Analysis of the influence of EDM parameters on
surface quality, MRR and EW of WC-Co. Journal of Materials Processing Technology,
vol.153-154, No.10, pp. 1026-1032, ISSN 0924-0136
Ramasawmy, H. & Blunt, L. (2001). 3D surface characterization of electropolished EDMed
surface and quantitative assessment of process variables using Taguchi
Methodology. International Journal of Machine Tools and Manufacture, vol.42, pp.
1129-1133, ISSN 0890-6955
Salonitis, K.; Stournaras, A.; Stavropoulos, P. & Chryssolouris, G. (2007). Thermal modeling
of the material removal rate and surface roughness for die-sinking EDM.
International Journal of Advance Manufacturing Technology. DOI 10.1007/s00170-007-
1327-y, ISSN 0268-3768
Shuvra, D.; Mathias, K. & Klocke, F. (2003). EDM simulation: finite element-based
calculation of deformation, microstructure and residual stresses. Journal of Materials
Processing Technology, vol.142, pp. 434-451, ISSN 0924-0136
Tariq, S. & Pandey, C. (1984). Experimental investigation into the performance of water as
dielectric in EDM, International Journal of Machine Tool Design and Research, vol.24,
pp. 31-43, ISSN 0020-7357
Thomas, N.; Shreyes, M.; Thomas, W.; Rosa, T. & Laura, R. (2009). Investigation of the effect
of process parameters on the formation and characteristics of recast layer in wire-
EDM of Inconel 718. Materials Science and Engineering: A, vol.513-514, pp. 208-215,
ISSN 0025-5416
Vinod, Y.; Vijay, K. & Prakash, M. (2002). Thermal stresses due to electrical discharge
machining, International Journal of Machine Tools & Manufacture. Vol.42, pp. 877-888,
ISSN 0890-6955
Wang, J. & Tsai, M. (2001a) Semi-empirical model on work removal and tool wear in
electrical discharge machining. Journal of materials processing technology, vol.114,
No.4, pp. 1-17, ISSN 0924-0136
Wang, J. & Tsai, M. (2001b). Semi-emperical model of surface finish on electrical discharge
machining. International Journal of Machine Tools and Manufacture, vol.41, pp. 1455-
1477, ISSN 0890-6955
Yan, H.; Tsai, C. & Huang, Y. (2005). The effect of EDM of a dielectric of a urea solution in
water on modifying the surface of titanium. International Journal of Machine Tools
and Manufacture, vol. 45, No.2, pp. 194-200, ISSN 0890-6955
Zarepour, H.; Tehrani, A.; Karim, D & Amini, S. (2007). Statistical analysis on electrode wear
in EDM of tool steel DIN 1.2714 used in forging dies. Journal of Material Processing
Technology, vol.187-188, pp. 711-714, ISSN 0924-0136
Zaw, M.; Fuh, H.; Nee, C. & Lu, L. (1999). Fabrication of a new EDM electrode material
using sintering techniques. Journal of Materials Processing Technology
, vol.89-90, pp.
182-186, ISSN
0924-0136
22
Thermal Treatment of Granulated
Particles by Induction Thermal Plasma
M. Mofazzal Hossain
1
and Takayuki Watanabe
2
1
Department of Electronics and Communications Engineering, East West University
2
Department of Environmental Chemistry and Engineering
Tokyo Institute of Technology,
1
Bangladesh
2
Japan
1. Introduction
After the invention of induction plasma torch by [Reed, 1961], tremendous achievements
have been earned by the researchers in the field of thermal treatment of micro particles by
induction plasma torch. Induction thermal plasma (ITP) has become very popular in material
processing due to several of its inherent characteristics: such as contamination free (no
electrode), high thermal gradient (between torch and reaction chamber), wide pressure range
and high enthalpy. ITP have extensively been used for the synthesis and surface treatment
of fine powders since couple of decades as a clean reactive heat source [Fan, 1997], [Watanabe,
2004]. ITP technology may ensure essentially the in-flight one-step melting, short melting
time, and less pollution compared with the traditional technologies that have been using in
the glass industries for the vitrification of granulated powders. Moreover ITP technology
may be very effective in the thermal treatment of porous micro particles and downsizing the
particle size. During in-flight treatment of particles, it is rear to have experimental records of
thermal history of particles; only some diagnosis of the quenched particles is possible for the
characterization. Thus, the numerical analysis is the only tool to have comprehensive
characterization of the particle thermal history and energy exchange during in-flight
treatment. Thus, for numerical investigation it is the challenge to predict the trajectory and
temperature history of the particles injected into the ITP torch. Among others Yoshida et al
[Yoshida, 1977] pioneered the modeling of particle heating in induction plasmas; though
their work assumed the particle trajectory along the centerline of the torch only. Boulos
[Boulos, 1978] developed a model and comprehensively discussed the thermal treatment of
alumina powders in the fire ball of argon induction plasma. Later (Proulx et al) [Proulx,
1985] predicted the trajectory and temperature history of alumina and copper particles
injected into ITP torch and discussed the particle loading effects in argon induction plasma.
In this chapter we shall discuss the in-flight thermal treatment mechanism of soda-lime-
silica glass powders by ITP and to optimize the plasma discharge parameters, particle size
and feed-rate of input powders that affect the quenched powders size, morphology, and
compositions. The thermal treatment of injected particles depends mainly on the plasma-
particle heat transfer efficiency, which in turn depends to a large extent on the trajectory and
temperature history of the injected particles. To achieve that goal, a plasma-particle
interaction model has been developed for argon-oxygen plasma, including a nozzle inserted
Developments in Heat Transfer
438
into the torch for the injection of carrier gas and soda-lime-silica glass powders. This model
can be used to demonstrate the particle loading effects and to optimize the parameters that
govern the particles trajectory, temperature history, quenched particles size and plasma-
particle energy exchange efficiency. This model may be used to optimize the plasma and
particle parameters for any combination of plasma gases for example argon-oxygen or argon
nitrogen etc.
2. Modeling
2.1 Plasma model
The schematic geometry of the ITP torch is presented in Fig.1. The torch dimensions and
discharge conditions are tabulated in Table 1. The overall efficiency of the reactor is assumed
to be 50%, thus, plasma power is set to 10 kW. The torch dimension, power and induction
frequency may vary and can be optimized through the simulation. The model solves the
conservation equations and vector potential form of Maxwell’s equations simultaneously
under LTE (local thermodynamic equilibrium) conditions, including a metal nozzle inserted
into the torch. It is assumed that plasma flow is 2-dimensioanl, axi-symmetric, laminar,
steady, optically thin, and electromagnetic fields are 2-dimensional. Adding the source terms
to the conservation equations, the plasma-particle interaction and particle loading effects
have been taken into account. In this model, the conservation equations are as follows:
Mass conservation:
C
p
S
ρ
∇⋅ =u
(1)
Momentum conservation:
M
p
p
S
ρμ
⋅∇ =−∇ +∇⋅ ∇ + × +uu uJB
(2)
Distance to initial coil position (L
1
)
Length of injection tube (L
t
)
Distance to end of coil position (L
2
)
Torch length (L
3
)
Coil diameter (d
c
)
Wall thickness of quartz tube (T
wall
)
Inner radius of injection tube (r
1
)
Outer radius of injection tube (r
t
)
Outer radius of inner slot (r
2
)
Inner radius of outer slot (r
3
)
Torch radius (r
0
)
Coil radius (r
c
)
19 mm
52 mm
65 mm
190 mm
5 mm
1.5 mm
1 mm
4.5 mm
6.5 mm
21.5 mm
22.5 mm
32 mm
Plasma power
Working frequency
Working pressure
Flow rate of carrier gas (Q
1
)
Flow rate of plasma gas (Q
2
)
Flow rate of sheath gas (Q
3
)
10 kW
4 MHz
0.1 MPa
4 ∼ 9 L/min of Argon
2 L/min of Argon
22 L/min Argon & 2 L/min Oxygen
Table 1. Torch dimensions & discharge conditions
Thermal Treatment of Granulated Particles by Induction Thermal Plasma
439
Energy conservation:
E
r
p
p
hhQS
C
κ
ρ
⎛⎞
⎜⎟
⋅
∇=∇⋅ ∇ +⋅ − −
⎜⎟
⎝⎠
uJE (3)
Species conservation:
(
)
mC
p
y
DyS
ρρ
⋅∇ =∇⋅ ∇ +u (4)
Vector potential form of Maxwell electromagnetic field equation [Mostaghimi, 1998]:
2
0
i
μσω
∇=
cc
AA (5)
r
1
r
t
r
2
r
3
r
0
r
c
L
2
L
t
L
1
L
3
T
wall
d
c
Q
3
Q
2
Q
1
Fig. 1. Schematic geometry of induction thermal plasma torch
Developments in Heat Transfer
440
2.1.1 Boundary conditions
The boundary conditions for the mass, momentum, energy and species conservation
equations are: at the inlet, gas temperature was set to 300 K and uniform velocity profiles
are assumed based on the given flow rates; on the axis of symmetry, the symmetry
conditions are imposed; on the walls, no-slip condition is assumed; the outer wall
temperature is set to 350 K; and, at the exit, axial gradients of all fields are set equal to zero.
The inserted nozzle is assumed to be water cooled at 300 K. On the nozzle wall, the velocity
is set to zero. The boundary conditions for the vector potential form of Maxwell’s equation
are the same as those described in reference [Mostaghimi, 1998].
2.1.2 Computational procedure and thermophysical properties
The conservation equations, which are listed in previous section, are solved numerically
using the SIMPLER algorithm of Patankar [Patankar, 1980]. The algorithm is based on a
control-volume finite-difference scheme for solving the transport equations of
incompressible fluids. Calculations are performed for a 44 (in radial direction) by 93 (in axial
direction) non-uniform grid system.
Thermodynamic and transport properties of argon and oxygen gases required for the
simulation are mass density, specific heat at constant pressure, viscosity, electrical and
thermal conductivity and radiative loss coefficient. The transport properties, which are
function of temperature, are calculated under LTE conditions using Chapman-Enskog first
approximation to Boltzmann equation [Tanaka, 2000]. The effective diffusion coefficient of
species is calculated based on the following equations:
(
)
,1
1
i
m
i
i
i
j
jij
y
D
x
D
υ
≠=
−
=
∑
(6)
(
)
()
1.5
2
1.1
2.628 10
2
ij
ij
ij
ij
MM
T
D
MM
−
+
=×
Ω
(7)
The ambipolar diffusion coefficient for ions can be approximated as D
a
=D
ion
(1+T
e
/T
ion
). As
the thermal equilibrium condition i.e
T
h
=T
e
=T
ion
was applied thus, D
a
≅ 2D
ion
.
2.2 Particle model
The following assumptions are made in the analysis of plasma-particle interactions in the
ITP torch; the particle motion is two-dimensional, only the viscous drag force and gravity
affect the motion of an injected particle, the temperature gradient inside the particle is
neglected, and the particle charging effect caused by the impacts of electrons or positive ions
is negligible. The particle charging effects have not been intensively studied yet. However,
the electromagnetic drag forces caused by the particle charging of the injected particles are
negligible compared with those by neutrals and charged particles due to negligible electrical
conductivity of soda-lime-silica powders. Thus, the momentum equations for a single
spherical particle injected vertically downward into the plasma torch can be expressed as
follows:
Thermal Treatment of Granulated Particles by Induction Thermal Plasma
441
()
3
4
p
Dp R
pp
du
Cu uU
g
dt d
ρ
ρ
⎛⎞
⎜⎟
=
−− +
⎜⎟
⎝⎠
(8)
()
3
4
p
Dp R
pp
d
CU
dt d
ν
ρ
νν
ρ
⎛⎞
⎜⎟
=− −
⎜⎟
⎝⎠
(9)
()()
22
Rp p
Uuu
ν
ν
=−+− (10)
The particle temperature, liquid fraction and diameter are predicted according to the
following energy balances:
(
)
(
)
2244
p
c
pp
s
p
a
QdhTT d TT
ππσε
=−− − (11)
3
6
for
p
p
b
pp pp
dT
Q
TT
dt
dC
πρ
=
< (12)
3
6
for 1000 1600
p
pp m
dQ
T
dt
dH
χ
πρ
=≤≤ (13)
2
2
for 1000 1600,
p
pp
b
pp
dd
Q
TTT
dt
dH
ν
πρ
=
≤≤ ≥ (14)
Drag coefficient C
Df
is calculated using Eq. (15) and the property variation at the particle
surface layer and the non-continuum effects are taken into account by Eq. (16) and (17)
[Chen, 1983].
()
()
0.81
0.62
24
0.2
24 3
1 0.2 < 0.2
16
24
1 0.11 2.0 < 21.0
24
1 0.189
e
e
ee
e
D
ee
e
e
e
R
R
RR
R
C
RR
R
R
R
≤
⎛⎞
+≤
⎜⎟
⎝⎠
=
+≤
+
f
21.0 < 200
e
R
⎧
⎪
⎪
⎪
⎪
⎪
⎨
⎪
⎪
⎪
⎪
≤
⎪
⎩
(15)
0.45
1
ss
f
ρμ
ρμ
−
∞∞
⎛⎞
=
⎜⎟
⎝⎠
(16)
0.45
2
24
1 , 10 2 0.1
1
s
fKnKn
Pr
αγ
αγ
−
⎧⎫
⎛⎞
−
⎪⎪
⎛⎞
=+ −< <
⎨⎬
⎜⎟
⎜⎟
+
⎝⎠
⎪⎪
⎝⎠
⎩⎭
(17)
Developments in Heat Transfer
442
12DD
CCff
=
f
(18)
To take into account the steep temperature gradient between plasma and particle surface,
the Nusselt correlation can be expressed by Eq. (19) [Lee, 1985]. The non-continuum effect is
taken into account by Eq. (20) [Chen, 1983].
()
0.38
0.6
1/2 1/3
2.0 0.6
p
e
ss ps
C
Nu R Pr
C
ρμ
ρμ
∞
∞∞
⎛⎞
⎛⎞
⎜⎟
=+
⎜⎟
⎜⎟
⎝⎠
⎝⎠
f
ff
(19)
1
3
24
1 , 10 3 0.1
1
s
fKnKn
Pr
αγ
αγ
−
⎧⎫
⎛⎞
−
⎪⎪
⎛⎞
=+ −< <
⎨⎬
⎜⎟
⎜⎟
+
⎝⎠
⎪⎪
⎝⎠
⎩⎭
(20)
The convective heat transfer coefficient is predicted as follows:
3c
p
hNuf
d
κ
=
f
f
(21)
2.2.1 Particle source terms
Let us assume Nt0 be the total number of particles injected per unit time, nd is the particle
size distribution, and nr is the fraction of Nt0 injected at each point through the injection
nozzle. Thus, the total number of particles per unit time traveling along the trajectory (l, k)
corresponding to a particle diameter dl injected at the inlet point rk is:
(, )
0
lk
lk
dr t
NnnN= (22)
For the sake of computation, the particle concentration nr in the inlet is assumed to be
uniform and to be separated into five injection points, which are at radial positions of 0.3,
0.45, 0.6, 0.75 and 0.9 mm. In the present computation the particles diameter distribution is
assumed to be Maxwellian (similar to experiment). The particle size and corresponding
distribution fraction are presented in Table 2. In the present computation, the powder is
assumed to be composed of seven size particles according to its diameter and deviation. The
average particle diameter is 58 μm and the maximum deviation is 67%. As a result, there are
35 different possible trajectories of the injected particles. The injection velocity of the
particles is assumed to be equal to the injection velocity of carrier gas.
Particle diameter (μm)
20 40 50 68 77 80 90
Fraction 0.03 0.07 0.1 0.6 0.1 0.07 0.03
Table 2. Particle size and corresponding distribution fraction
To take into account the particles loading effects, particles source terms for the mass,
momentum, energy and species conservation equations have been calculated in the same
fashion as described in reference [Proulx, 1985], using the Particle-Source-In Cell (PSI-CELL)
approach [Crowe,1977], where the particles are regarded as sources of mass, momentum
and energy. The source terms in the mass and species conservation equation,
C
p
S is the net
efflux rate of particles mass in a computational cell (control volume). Assuming the particles
Thermal Treatment of Granulated Particles by Induction Thermal Plasma
443
are spherical, the efflux rate of particle mass for the particle trajectory (l, k) that traverses a
given cell (i, j) is:
()
(, ) (, )
33
,,
,
1
6
Clk lk
p
i
j
in i
j
out
pij ij
SNdd
πρ
=− (23)
The net efflux rate of particle mass is obtained by summing over all particles trajectories
which traverse a given cell (i, j):
(, )
,
,
Clk
C
pij
pij
lk
SS=
∑∑
(24)
The source terms for momentum conservation equations are evaluated in the same fashion
as that of mass conservation equation. In this case, the efflux rate of particles momentum for
the particle trajectory (l, k) traversing a given cell (i, j) is:
()
(, ) (, )
33
,, , ,
,
1
6
z
Mlk lk
p
i
j
in i
j
in i
j
out i
j
out
pij ij
SNudud
πρ
=−
(25)
()
(, ) (, )
33
,, , ,
,
1
6
r
Mlk lk
p
i
j
in i
j
in i
j
out i
j
out
pij ij
SNdd
πρ ν ν
=−
(26)
Thus, the corresponding source terms for axial and radial momentum conservation
equations are:
(, )
,,
zz
M
Mlk
pij pij
lk
SS=
∑∑
(27)
(, )
,,
rr
M
Mlk
pij pij
lk
SS=
∑∑
(28)
The source term for energy conservation equation
,
E
p
i
j
S consists of the heat given to the
particles
(, )
,
lk
p
i
j
Q , and superheat to bring the particle vapors into thermal equilibrium with the
plasma
(, )
,
lk
i
j
Q
ν
:
(
)
(, ) (, )
2
,,
out
in
lk lk
pc ij
pij pij
QdhTTdt
τ
τ
π
=−
∫
(29)
()
(, ) (, )
2
,,
2
out
in
p
lk lk
pp p ij
ij p ij
dd
QdCTTdt
dt
τ
ν
ν
τ
π
πρ
⎛⎞
=−
⎜⎟
⎜⎟
⎝⎠
∫
(30)
(
)
(, ) (, ) (,)
,
,,
lk lk lk
E
pij
i
jp
i
j
i
j
lk
SNQQ
ν
=+
∑
∑
(31)
The calculation is started by solving the plasma temperature and flow fields without
injection of any particles. Using these conversed temperature and flow fields, particles
trajectories together with particle temperature and size histories are calculated. The particle
Developments in Heat Transfer
444
source terms for the mass, momentum and energy conservation equations for each control
volume throughout the torch are then predicted. The plasma temperature and flow fields
are predicted again incorporating these particle source terms. The new plasma temperature
and flow fields are used to recalculate the particles trajectories, temperature and size
histories. Calculating the new source terms and incorporating them into conservation
equations constitute the effects of plasma-particle interaction, thereby completing the cycle
of mutual interaction. The above computation schemes are repeated until convergence. The
physical properties of soda-lime-silica glass powders used in the present investigation are
listed in Table 3.
Mass density
Specific heat at constant pressure
Porosity
Fusion temperature
Boiling temperature
Latent heat of fusion
Latent heat of vaporization
2300 kg/m
3
800 J/kg-K
80%
1000~1600 K
2500 K
3.69×10
5
J/kg
1.248×10
7
J/kg
Table 3. Physical properties of soda-lime-silica glass powders
3. Simulated results
The calculation has been carrier out for a plasma power of 10 kW, reactor pressure 0.1 MPa
and induction frequency 4 MHz. The discharge conditions are tabulated in Table 1. In this
study, attention is given to the plasma-particle interaction effects on individual particle
trajectory, velocity, and temperature history along the trajectories for different carrier gas
flow-rate and powder feed-rates. Attention also paid to investigate how the plasma-particle
energy exchange process is affected by the particle loading effects. Two aspects of the
thermal treatment are investigated: the behavior of the individual particles, and the global
effects of the particles on the plasma fields. The carrier gas flow-rate is very vital in
determining the individual particle trajectories, and the allowable powder feed-rate. Figure
2 shows the isotherms in the torch for a carrier gas flow-rate of 6 L/min argon and various
powder feed-rates. The other discharge conditions are the same as presented in Table 1. A
comparison among the isotherms clearly reveals the intense cooling around the torch
centerline that increases with powder feed-rate. However, the plasma temperature away
from the centerline of the torch remains almost unaffected by higher powder feed-rates. This
is because the
individual particle trajectories are not widely outbound in the radial direction; rather the
trajectories are very close to the torch axis. Thus, the plasma-particle interaction around the
centerline is very crucial at higher powder feed-rate. The same kind of arguments is
proposed by Ye et al [Ye, 2000] to explain the particle trajectories for alumina and tungsten
particles. The effects of carrier gas flow-rates on the individual particle trajectories are
presented in Fig. 3, for the particle diameter of 50 μm and a feed-rate of 5 g/min. It is
comprehended that the higher flow-rate of carrier gas enhances the axial velocity of the
particles, because the initial axial velocity of the particles depends on carrier gas flow rate;
as a result the trajectories become closer to the torch axis at higher flow-rate. The individual
particle temperature history along the trajectory is also influenced by the carrier gas flow-
Thermal Treatment of Granulated Particles by Induction Thermal Plasma
445
rate and powder feed-rate. Figure 4 shows the effects of carrier gas flow-rate on the particle
temperature for a feed-rate of 5 g/min. It is found that the particle temperature along the
trajectory decreases at higher carrier gas flow-rate. The main reason is the cooling of plasma
at Fig. 2 Effects of powder loading on the isotherms for a carrier gas flow-rate of 6 L/min
higher carrier gas flow-rate that leads less heat transfer to particles. Figure 5 describes the
effects of powder feed-rate on the particle temperature along the trajectory. Like the flow-
rate of carrier gas, the higher feed-rate of powder also causes intense cooling of plasma;
thus, the heat transfer to particles decreases what results lower particle temperature. At this
stage of investigation, it is indeed necessary to discuss the energy transfer mechanism to
particles. The energy transfer is affected by the particles physical properties, plasma
temperature, and velocity. The last two parameters are affected to a large extent by the
carrier gas flow-rate and powder loading. The net energy transfer to particles is calculated
by integrating the energy transfer rate to the particles injected per unit time over the
residence time for all the particle trajectories. Mathematically the net energy transfer to
particles (Q
net
) can be expressed as follows:
()
()
{}
2244
0
s
tt
tpcppspa
t
QdhTTdTTdt
ππσε
=
=
=−−−
∫
(32)
(, )lk
net t
lk
QNQ=
∑∑
(33)
01020
180
160
140
120
100
80
60
40
20
0
Radius [mm]
Axial position [mm]
01020
Radius [mm]
01020
Feed-rate: 10
Feed-rate: 5
Feed-rate: 0
0K
1kK
2kK
3kK
4kK
5kK
6kK
7kK
8kK
9kK
10k
K
11k
K
Radius [mm]
Fig. 2. Effects of powder loading on the isotherms for a carrier gas flow-rate of 6 L/min
Developments in Heat Transfer
446
0 20 40 60 80 100 120 140 160 180
0.0
0.5
1.0
1.5
2.0
2.5
3.0
Particle diameter: 50 μm
Powder feed-rate: 5 g/min
Carrier gas flow-rate: 4
Carrier gas flow-rate: 6
Carrier gas flow-rate: 7
Carrier gas flow-rate: 9
Radial distance from centerline [mm]
Axial distance from top of the torch [mm]
Fig. 3. Effects of carrier gas flow-rate on the particle trajectories for a powder feed-rate of
5 g/min
0 20 40 60 80 100 120 140 160 180
0
500
1000
1500
2000
2500
3000
Axial distance [mm]
Particle diameter: 50 μm
Powder feed-rate: 5 g/min
Carrier: 4
Carrier: 6
Carrier: 7
Carrier: 9
Particle temperature [K]
Fig. 4. Dependence of particle temperature history along the trajectory on carrier gas flow-
rate
Thermal Treatment of Granulated Particles by Induction Thermal Plasma
447
0 20 40 60 80 100 120 140 160 180
0
500
1000
1500
2000
2500
3000
Particle diameter: 50 μm
Carrier flow-rate: 6 lpm
Feed-rate: 5
Feed-rate: 10
Particle temperature [K]
Axial distance [mm]
Fig. 5. Dependence of particle temperature history along the trajectory on the powder feed-
rate
Figure 6 clearly presents how the net energy transfer to particles is affected by the carrier
gas flow-rate under powder loading conditions. Only 5 g/min of powder feeding decreases
345678910
0
1
2
3
4
5
No loading effect
With loading effect
Average diameter: 58 μm
Powder feed-rate: 5 g/min
Energy transfer [%]
Carrier gas flow-rate [lpm]
Fig. 6. Effects of powder loading and carrier gas flow-rate on the plasma-particle energy
transfer
Developments in Heat Transfer
448
4 6 8 10121416182022
50
100
150
200
250
300
Carrier gas flow-rate: 9 lpm
Without loading effect
With loading effect
Energy transfer [W]
Powder feed-rate [g/min]
Fig. 7. Particle loading effects on plasma-particle energy transfer at various powder feed-rate
the energy transfer to particle by about 44%. The powder loading effect and the dependence
of energy transfer to particles on the powder feed-rate is presented in Fig. 7, for a carrier gas
flow-rate of 9 L/min. It can be noticed that energy transfer to particles increases linearly
with feed-rate in the absence of particle loading effect; however, when particle loading effect
is taken into account, energy transfer to particles yet increases with feed-rate but with a
declined slop. The main reason is the intense local cooling of plasma around the torch
centerline under dense particle loading. It is also evident that the particle loading effect is
pronounced at higher powder feed-rate.
4. Experimental
4.1 Setup
The experimental setup consists of a plasma torch (Fig. 1), a reaction chamber, powder
feeder, and a power supply unit (4 MHz, 20 kW). The plasma torch consists of a water-
cooled co-axial quartz tube surrounded by a three-turn induction coil. The granulated soda-
lime-silica glass powders are prepared by spray-drying method from the reagents of
Na
2
CO
3
, CaCO
3
and SiO
2
with the composition of Na
2
O:16, CaO:10 and SiO
2
:74 in wt%. The
mean diameter and porosity of soda-lime-silica glass powders are 58 μm and 80%,
respectively. The plasma discharge conditions are the same as those described in Table 1 in
the modeling section. The soda-lime-silica glass powders are injected into ITP torch along
with the carrier gas at a rate of 5-20 g/min and the quenched powders are collected on a
water-cooled ceramic block at 340 mm from the nozzle exit.
4.2 Characterization of plasma-treated particles
The treatment quality of the powders is characterized by the vitrification degree, the surface
morphology, cross-sectional structure and composition of the quenched powders. The
Thermal Treatment of Granulated Particles by Induction Thermal Plasma
449
234567
10
20
30
40
50
90
95
100
105
Evaporation of Na
2
O [%]
Powder feed-rate: 5 g/min
Carrier gas flow-rate [lpm]
Vitrification degree [%]
(a)
4 6 8 10 12 14 16 18 20 22
90
95
100
105
10
20
30
40
50
Evaporation of Na
2
O [wt%]
Carrier gas flow-rate: 6 lpm
Vitrification degree [%]
Powder feed-rate [g/min]
(b)
Fig. 8. Effects of carrier gas flow-rate (a), and powder feed-rate (b) on the vitrification degree
and Na
2
O evaporation rate
Developments in Heat Transfer
450
(a)
(b)
Fig. 9. The SEM photographs of soda-lime-silica glass powders before (a), and after (b)
thermal treatment
vitrification degree is defined as the ratio of the converted crystalline phases of SiO
2
in the
quenched powder to the crystalline SiO
2
in the raw powders. The vitrification degree of
quenched powders is quantitatively determined by X-ray diffractometry (XRD) on Miniflex
(Rigaku) with Cu Kα radiation at 30 kV and 15 mA. The data are collected in the 2θ range
3-90º with a step size of 0.02º and a scan speed of 4º/min. The quenched powders collected
at the reaction chamber are examined by scanning electron microscopy (SEM) on JSM5310
(JEOL) to observe their surface morphologies and cross-sectional microstructures. The
composition of quenched powders is analyzed by inductively coupled plasma (ICP) on
ICP-8100 (SHIMADZU).
Thermal Treatment of Granulated Particles by Induction Thermal Plasma
451
4.3 Experimental results
In the experiment soda-lime-silica glass powders are injected along with the carrier gas
through the nozzle inserted into the plasma torch. Thus, the initial particle velocity is the
same as that of carrier gas. When the particles come in contact to high temperature plasma
flame, they are heated and their temperature starts to rise. As the particle temperature
reaches to its melting temperature, particle porosity decreases drastically; as a result,
particle diameter shrinks. When particle temperature reaches to its boiling temperature,
vaporization takes place and particle diameter shrinks further. In order to investigate the
effects of carrier gas flow-rate and powder feed-rate on energy transfer to particles, the
vitrification degree and Na
2
O evaporation rate are estimated through XRD and ICP
spectrum analysis. Higher vitrification degree and Na
2
O evaporation rate indirectly indicate
the large energy transfer to particles. Figure 8 shows the XRD and ICP spectrum analysis
results. It can be noticed that both the evaporation rate of Na
2
O and the vitrification degree
decrease with the increase of both carrier gas flow-rate [Fig. 8(a)] and powder feed-rate
[Fig. 8(b)]. The vitrification degree and the evaporation of Na
2
O depend to a large extent on
the particle temperature. Higher carrier gas flow-rate and powder feed-rate cause lower
plasma temperature which causes less heat transfer to particles; as a result particle
temperature is lower. It is important to underline that after the thermal treatment, the size,
composition, and morphology of the particles have been changed significantly. The effects
of thermal treatment are visualized in the SEM photograph as shown in Fig. 9. From Fig. 9
(a) and (b), it can be noticed that after treatment, the particle size becomes smaller, quite
spherical, smoother and compact surface.
5. Discussions
To validate the modeling and simulated results, a comparative discussion between
simulated and experimental results are indeed necessary. From the experimental results it is
found that at higher carrier gas flow-rate and powder feed-rate, both the evaporation rate of
Na
2
O and the vitrification degree decrease. These results indicate that less heat transfer to
particles takes place at higher carrier gas flow-rate and powder feed-rate. From the
simulated results it is evident that at increased carrier gas flow-rate and powder feed-rate,
the energy transfer to particles decreases; as a result, particles temperature becomes lower. It
is convinced that the main reason of less heat transfer to particles is the severe local cooling
of plasma around the torch centerline at higher carrier gas flow-rate and powder feed-rate.
Thus, it may be argued that the simulated results well agree with the experimental findings.
6. Conclusions
In this chapter we basically, discussed the way of thermal treatment of any type of
granulated porous particles by induction thermal plasma. A general plasma-particle
interactive flow model has been discussed using what it is possible to simulate the particle
trajectories, temperature histories, plasma temperature contours etc. The described model
can be used to optimize the carrier gas flow-rate, particle size, and powder feed-rate to
achieve the maximum treatment efficiency during thermal treatment of granulated powders
by argon-oxygen induction thermal plasmas. Numerically, it is found that the heat transfer
to particles decreases at increased carrier gas flow-rate and powder feed-rate, and these
results well agree with those of experiment. Thus, it can be concluded that, efficient thermal
Developments in Heat Transfer
452
treatment of particles depends not only on the physical properties of the particles, but also
on the plasma discharge conditions and particle parameters. Therefore, for a particular type
of powder (certain physical properties) both carrier gas flow-rate and powder feed-rate
mainly govern the treatment quality.
7. Nomenclature
A
c
Complex amplitude of vector potential
B Magnetic field vector
C
p
Specific heat at constant pressure
C
pp
Particle specific heat at constant pressure
d
p
Particle diameter
D
ij
Binary diffusion coefficient between species i and j
D
m
Multicomponent diffusion coefficient
E Electric field vector
f Frequency
g Acceleration of gravity
h Enthalpy
h
c
Heat transfer coefficient
H
m
Latent heat of melting
H
v
Latent heat of vaporization
i Complex vector ( 1
−
)
J Current density vector
K
n
Knudsen number
M
i
Molecular weight of species i
M
j
Molecular weight of species of j
0
t
N
Total number of particles injected per unit time
n
d
Particle size distribution
n
r
Fraction of Nt0 injected at each point
Nu Nusselt number
p Pressure
Pr Prandtl number
Q Net heat exchange between the particle and its surroundings
Q
r
Volumetric radiation loss
Re Reynold number
C
p
S Particle source term in continuity equation
M
p
S Particle source term in momentum equation
E
p
S Particle source term in energy equation
t Time
T Plasma temperature
T
a
Ambient temperature
T
b
Boiling point temperature of particles
T
e
Electron temperature
T
h
Heavy particle temperature
T
ion
Ion temperature
Thermal Treatment of Granulated Particles by Induction Thermal Plasma
453
T
p
Particle temperature
t
s
Residence time of particle in the plasma
u Velocity vector
u
p
Axial velocity component of particle
U
R
Relative speed of particles with respect to plasma
v
p
Radial velocity component of particle
x
i
Mole fraction of species i
y Mass fraction
Greek symbols
Vector operator
κ
Thermal conductivity
Mass density
Viscosity
σ
Electrical conductivity
κ
Thermal conductivity
μ
0
Permeability of free space
ω
Angular frequency (2πf)
(1.1)
i
j
Ω Collision integral between species i and j
ε
Particle porosity
σ
s
Stefan-Boltzmann constant
Liquid mass fraction of a particle
Thermal accommodation coefficient
γ
Specific heat ratio
Subscripts
f Properties corresponding to film temperature
p Particle
s Properties corresponding to particle temperature
∞ Properties corresponding to plasma temperature
(i, j) Location of a control volume or cell
Superscripts
(l, k) Particles having an initial diameter d
l
, and injection point r
k
.
8. References
Boulos, M. I, 1978, “Heating of powders in the fire ball of an induction plasma,” IEEE Trans.
on Plasma Sci. PS-6, pp. 93-106.
Crowe, C. T., Sharma, M. P., and Stock, D. E., 1977, “The particle-source-in cell (PSI-CELL)
model for gas-droplet flows,” J. Fluid Eng., 99, pp. 325-332.
Chen, X., and Pfender, E., 1983, “Effects of Knudsen number on heat transfer to a particle
immersed into a thermal plasma,” Plasma Chem. Plasma Process., 3, pp. 97-113.
Fan, X., Ishigaki, T., and Sato, Y., 1997, “Phase formation in molybdenum disilicide powders
during in-flight induction plasma treatment,” J. Mater. Res., 12, pp. 1315-1326.
Mostaghimi, J., Paul, K. C., and Sakuta, T., 1998, “Transient response of the radio frequency
inductively coupled plasma to a sudden change in power,” J. Appl. Phys., 83, pp.
1898-1908.