Expert Systems for Human Materials and Automation Part 2 ppt
Bạn đang xem bản rút gọn của tài liệu. Xem và tải ngay bản đầy đủ của tài liệu tại đây (934.95 KB, 30 trang )
SeDeM Diagram: A New Expert System for the Formulation of Drugs in Solid Form
21
Carr Index, limits are based on references in “Tecnologia Farmaceutica” by S. Casadio
(Casadio, 1972) and on monograph 2.9.36 of Ph Eur (Ph Eur, 2011).
• Icd. The limit is determined empirically from compression tests on many powdered
substances, based on the maximum hardness obtained without producing capped or
broken tablets. This hardness is then established as the maximum limit. The minimum
value is “0”. This value implies that no tablets are obtained when the powders are
compressed.
• IH, Powder flow, repose angle. The limits are set on the basis of the monographs
described in “Handbook of Pharmaceutical Excipients” (Kibbe, 2006), and monograph
2.9.36 of Ph Eur (Ph Eur, 2011) or other references in “Tecnologia Farmaceutica” by S.
Casadio (Casadio, 1972).
• %HR. The limits are established on the basis of the references cited elsewhere, such as
“Farmacotecnia teórica y práctica” by José Helman (Helman, 1981). The optimum
humidity is between 1% to 3%.
• Hygroscopicity is based on the “Handbook of Pharmaceutical Excipients” (Kibbe, 2006):
based on manitol (not hygroscopic) and sorbitol (highly hygroscopic).
• Particle size. The limits are based on the literature. These sources (Kibbe, 2006) report
that rheological and compression problems occur when the percentage of fine particles
in the formulation exceeds 25%.
The limits for the Homogeneity Index (Iθ) are based on the distribution of the particles of the
powder (see Table 3, indicating the size of the sieve (in mm), average particle size in each
fraction and the difference in average particle size in the fraction between 0.100 and 0.212
and the others). A value of 5 on a scale from 0 to 10 was defined as the minimum acceptable
value (MAV), as follows:
Sieve
(mm)
Corresponding
fraction
Average of the
diameter of the
fraction
Corresponding
diameter
(dm dm ± n)
Dif dm with
the mayor
component
0,355 – 0,500 Fm+2 427 dm+2 271
0,212 – 0,355 Fm+1 283 dm+1 127
0,100 – 0,212 Fm 156 dm 0
0,050 –0,100 Fm-1 75 dm-1 81
< 0,050 Fm-2 25 dm-2 131
Table 3. Distribution of particles in the determination of Iθ.
The major fraction (Fm) corresponds to the interval from 0.100 to 0.212 mm, because it falls
in the middle of the other fractions of the table. This interval is calculated as the proportion
in which the powder particles are found in each fraction considered in the table (as
described above). Those particles located in the major fraction (Fm) in a proportion of 60%
are considered to represent the MAV of 5. The distributions of the other particles are
considered to be Gaussian. The limits for the Homogeneity Index are set between 0 and 0.02.
2.3 Conversion of the limits considered in each parameter of the SeDeM method into
the radius (r) of the SeDeM Diagram
The numerical values of the parameters of the powder, which are obtained experimentally
(v) as described above, are placed on a scale from 0 to 10, considering 5 as the MAV.
Expert Systems for Human, Materials and Automation
22
Incidence Parameter
Limit value
(v)
Radius
(r)
Factor
applied to v
Bulk density 0–1 0–10 10v Dimensions
Tapped density 0–1 0–10 10v
Inter-particle porosity 0–1.2 0–10 10v/1.2
Carr index 0–50 0–10 v/5
Compressibility
Cohesion index 0–200 0–10 v/20
Hausner ratio (a) 3–1 0–10 (30-10v)/2
Angle of repose 50–0 0–10 10 − (v/5)
Flowability/powder
flow
Powder flow 20–0 0–10 10 − (v/2)
Loss on drying (b) 10-0 0-10 10-v Lubricity/estability
Higroscopicity 20–0 0–10 10 − (v/2)
Particles < 50 μ 50–0 0–10 10 − (v/5) Lubricity/dosage
Homogeneity index 0–2 × 10⁻² 0–10 500v
Table 4. Conversion of limits for each parameter into radius values (r).
(a) The values that exceptionally appear below 1 are considered values corresponding to
non-sliding products.
(b) Initially, relative humidity was calculated based on the establishment of three intervals
because the percentage relation obtained from the measurement of the humidity of the
substance does not follow a linear relation with respect to the correct behaviour of the dust.
Humidity below 1% makes the powder too dry, and electrostatic charge is induced, which
affects the rheology. Furthermore, low humidity percentages do not allow compression of the
substance (moisture is necessary for compacting powders). Moreover, more than 3% moisture
causes caking, in addition to favouring the adhesion to punches and dyes. Consequently, it
was considered that this parameter should present optimal experimental values from 1% to 3%
(Braidotti, 1974). Nevertheless, experience using the SeDeM Diagram has demonstrated no
significant variations in the results, so the previous three intervals of relative humidity can be
simplified to the calculation of the parameter, thus finally the linear criterion of treatment of
results is adopted (Suñé et al, 2011).
The correspondence of the value of the parameters with this scale takes into account the limit
values (see 2.2), using the factors indicated in Table 4. When all radius values are 10, the
SeDeM Diagram takes the form of a circumscribed regular polygon, drawn by connecting all
the radius values of the parameters with linear segments. Table 4 shows the factors used for
calculating the numerical value of each parameter required for the SeDeM method.
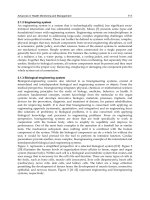
2.4 Graphical representation of the SeDeM Diagram
When all radius values are 10, the SeDeM Diagram takes the form of a circumscribed regular
polygon, drawn by connecting the radius values with linear segments. The results obtained
from the earlier parameter calculations and conversions are represented by the radius. The
figure formed indicates the characteristics of the product and of each parameter that
determines whether the product is suitable for direct compression. In this case, the SeDeM
Diagram is made up of 12 parameters, thus forming an irregular 12-sided polygon (Figure 1).
SeDeM Diagram: A New Expert System for the Formulation of Drugs in Solid Form
23
Fig. 1. The SeDeM Diagram with 12 parameters.
2.5 Acceptable limits for Indexes
To determine whether the product is suitable for direct compression using a numerical
method, the following indexes are calculated based on the SeDeM Diagram as follows:
nP 5
Parameter index IP=
nPt
≥
−
D
D
(2)
Where:
No. p ≥ 5: Indicates the number of parameters whose value is equal to or higher than 5
No. Pt: Indicates the total number of parameters studied
The acceptability limit would correspond to:
º5
0,5
º
nP
IP
nPt
≥
==
(3)
()
Parameter profile Index IPP Average of r all parameters−=
(4)
Average (r) = mean value of the parameters calculated.
The acceptability limit would correspond to: IPP = media (r) = 5
Good Compressibilit
y
Index IGC=IPP x f−
(5)
Pol
yg
on area
f Reliability factor
Circle area
==
(6)
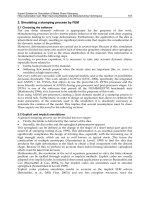
The acceptability limit would correspond to: ICG = IPP x f = 5.
The reliability factor indicates that the inclusion of more parameters increases the reliability
of the method (Figure 2).
Expert Systems for Human, Materials and Automation
24
0
5
10
1
2
3
4
5
6
7
8
9
10
11
12
0
5
10
1
2
3
4
5
6
7
8
Fig. 2. On the left graph with ∞ parameters (maximum reliability), f = 1. In the center, graph
with 12 parameters (nº of parameters in this study), f = 0.952. On the right, graph with 8
parameters (minimum reliability), f = 0.900.
3. Practical applications of SeDeM
3.1 Determination of the suitability of an API to be subjected to direct compression
technology
Here we used the SeDeM method to characterize an active product ingredient in powder
form (API SX-325) and to determine whether it is suitable for direct compression, applying
the profile to the SeDeM Diagram.
We measured the 12 parameters proposed in the SeDeM method following the procedures
indicated. Thus we obtained the values on which the factors set out in Table 5 are applied to
obtain the numerical values corresponding to the radius of the diagram and the values of
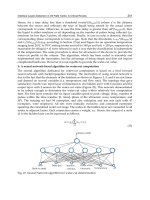
the mean incidence. All the values in Table 5 correspond to the average of two
determinations. The radius values are represented in the diagram shown in Figure 3.
0
5
10
Da
Dc
Ie
IC
Icd
IH
(α )
t
%HR
%H
% Pf
(Iθ )
Fig. 3. SeDeM Diagram for API SX-325.
To obtain the indices of acceptance or qualification for formulation by direct compression,
the formulas corresponding to the parametric index were applied from the numerical results
of the radius shown in Table 5. The results of the acceptance indices are shown in Table 6.
SeDeM Diagram: A New Expert System for the Formulation of Drugs in Solid Form
25
Incidence factor Parameter Symbol Unit Value
(v)
(r) Mean
incidence
Bulk Density Da g/ml 0.448 4.48 Dimension
Tapped Density Dc g/ml 0.583 5.83
5.16
Inter-particle Porosity Ie – 0.517 4.31
Carr Index IC % 23.156 4.63
Compressibility
Cohesion Index Icd N 118.00 5.90
4.95
Hausner Ratio IH – 1.868 5.66
Angle of Repose (α) ° 25.770 4.85
Flowability/Powder
Flow
Powder Flow t s 1.500 9.25
6.59
Loss on Drying %HR % 5.650 4.35 Lubricity/Stability
Hygroscopicity %H % 15.210 2.40
3.37
Particles < 50 μm %Pf % 0.000 10.0 Lubricity/Dosage
Homogeneity Index (Iθ) – 0.0058 2.90
6.45
Table 5. Application of the SeDeM method to API in powder form (API SX-325), and
calculation of radii.
Parameter index
0.42
Parametric profile index (mean r of all parameters)
5.38
Good compression index (IGC)
5.12
Table 6. SeDeM acceptance index for API SX-325
On the basis of the results of the radius corresponding to the SeDeM Diagram, the
parametric profile was > 5. This value implies that API SX-325 is suitable for direct
compression. However, in order to discern the appropriateness of this substance for this
formulation technology, we analyzed the 5 groups of individual factors classified by the
type of incidence in this compression.
In the case study above, only the parameters involved in the general factor of denominated
incidence lubrication/stability presented values below 5 (median = 3.37). This finding
implies deficient rheological qualities and poor stability, expressed by a high intrinsic
humidity of balance and high hygroscopicity. The product tended to capture humidity, thus
worsening the rheological profile (compression, lack of flow) and consequently impairing its
stability. These deficiencies are reflected graphically in the SeDeM Diagram, which shows
that a large shaded area (activity area) (the greater the shaded area, the more suitable the
characteristics for direct compression) is present for most of the parameters. However, some
parameters show a small shaded area, thus indicating that the powder is not suitable for
direct compression.
In this regard, the SeDeM method informed (table 5) on the following for API SX-325: it is a
dusty substance with correct dimensional characteristics (Da and Dc); it shows moderately
acceptable compressibility (IE, IC, Icd), which can be improved with the addition of
excipients of direct compression (DC); it shows very good fluidity/flowability (IH, α, t”)
and correct lubrication/dosage (%Pf, Iθ). Given these characteristics API SX-325 is suitable
for compression with the addition of standardized formula of lubricant. The group of factors
with deficient incidence corresponds to lubricity/stability and, considering the parameters
HR and H, corrective measures can be taken to prevent its negative influence on direct
compression. These measures include drying the material and preparing the tablet in rooms
with controlled relative humidity below 25%.
Expert Systems for Human, Materials and Automation
26
The results given by the SeDeM method in this example demonstrate that it is reliable in
establishing whether powdered substances have suitable profiles to be subjected to direct
compression. Consequently, SeDeM is a tool that will contribute to preformulation studies
of medicines and help to define the manufacturing technology required. Indeed, the
application of the SeDeM Diagram allows the determination of the direct compression
behaviour of a powdered substance from the index of parametric profile (IPP) and the index
of good compression (IGC), in such a way that an IPP and an IGC equal or over 5 indicates
that the powder displays characteristics that make it suitable for direct compression, adding
only a small amount of lubricant (3.5% of the magnesium stearate, talc and Aerosil® 200).
Also, with IPP and IGC values between 3 and 5, the substance will require a DC diluent
excipient suitable for direct compression. In addition, it is deduced that techniques other
than direct compression (wet granulation or dry granulation) will be required for APIs with
IPP and IGC values below 3.
The SeDeM Diagram is not restricted to active products since it can also be used with new or
known excipients to assess their suitability for application as adjuvants in direct
compression. Thus, knowledge of excipient profiles, with their corresponding parameters,
will allow identification of the most suitable excipient to correct the characteristics of APIs
registering values under 5.
Of note, the greater the number of parameters selected, the greater the reliability of the
method, in such a way that to obtain a reliability of the 100%, the number of parameters
applied would have to be infinite (reliability factor = 1). The number of parameters could be
extended using additional complementary ones, such as the true density, the index of
porosity, the electrostatic charge, the specific surface, the adsorption power, % of
lubrication, % friability, and the index of elasticity. However, while improving the reliability
of the method, the inclusion of further parameters would be to the detriment of its
simplicity and rapidity, since complementary parameters are difficult to apply.
3.2 Application of the SeDeM method to determine the amount of excipient required
for the compression of an API that is not apt for direct compression
Experimental determination of the parameters of the SeDeM method for a range of APIs and
excipients allows definition of their corresponding compressibility profiles and their
subsequent mathematical treatment and graphical expression (SeDeM Diagram). Various
excipient diluents can be analyzed to determine whether a substance is appropriate for
direct compression and the optimal proportion of excipient required to design a suitable
formulation for direct compression based on the SeDeM characteristics of the API (Suñé et
al, 2008a). In this regard, the SeDeM method is a valid tool with which to design the
formulation of tablets by direct compression.
The mathematical equation can be applied to the 5 parameters (dimension, compressibility,
flowability/powder flow, lubricity/stability lubricity/dosage) considered deficient by the
SeDeM system. The mathematical equation is applied to correct a deficient parameter of the
API. The equation proposed (Equation 7) allows calculation of the amount of excipient
required to compress the API on the basis of the SeDeM radius considered minimum (5) for
each parameter of incidence that allows correct compression.
RE R
CP 100 100
RE RP
−
⎛⎞
=− ×
⎜⎟
−
⎝⎠
(7)
Where:
CP = % of corrective excipient
SeDeM Diagram: A New Expert System for the Formulation of Drugs in Solid Form
27
RE = mean-incidence radius value (compressibility) of the corrective excipient
R = mean-incidence radius value to be obtained in the blend
RP = mean-incidence radius value (compressibility) of the API to be corrected
The unknown values are replaced by the calculated ones required for each substance in
order to obtain R = 5 (5 is the minimum value considered necessary to achieve satisfactory
compression). For example, if a deficient compressibility parameter for an API requires
correction, Equation 7 is applied by replacing the terms RE and RP with the values
calculated for each substance with the purpose to obtain a R=5, thus obtaining the optimal
excipient to design a first drug formulation and the maximum amount required for a
comprehensive understanding of the proposed formula. From this first formulation,
research can get underway for the final optimization of the formulation, taking into
consideration the biopharmaceutical characteristics required in the final tablet
(disintegration, dissolution, etc). We thus present a method to establish the details of the
formulation of a given drug by direct compression.
3.2.1 Practical application of the mathematical equation to calculate the amount of
excipient required for a deficient API to be subjected to direct compression
technology
When an API requires an appropriate formula for the direct compression, it must be
characterized following the SeDeM Diagram. Furthermore, a series of excipients used for
DC are also characterized using the diagram. If the API has deficient compressibility
parameters (<5), it is mixed with an excipient with a satisfactory compressibility parameter
(>5), thereby correcting the deficiency. The excipient that shows the smallest amount to
correct this parameter should be used. The amount of excipient is determined by the
mathematical equation of the SeDeM system (Equation 7).
Here we describe an example using an API 842SD and 6 diluents used for DC. The
corresponding parameters and the radius mean values obtained with samples of this
substance are shown in Table 7 and the parameters and the radius mean values of six
excipient diluents used in DC are shown in Table 8 (Suñé et al, 2008a).
Incidence factor Parameter Symbol Unit Value (v) (r) Mean
incidence
Bulk Density Da g/ml 0.775 7.75 Dimension
Tapped Density Dc g/ml 1.140 10.00
8.88
Inter-particle Porosity Ie – 0.413 3.44
Carr Index IC % 32.018 6.40
Compressibility
Cohesion Index Icd N 7.330 0.37
3.40
Hausner Ratio IH – 1.98 5.10
Angle of Repose (α) ° 37.450 2.51
Flowability/Powder
Flow
Powder Flow t s 10.330 4.84
4.15
Loss on Drying %HR % 9.865 0.68 Lubricity/Stability
Hygroscopicity %H % 0.007 10.0
5.34
Particles < 50 μm %Pf % 12.000 7.60 Lubricity/Dosage
Homogeneity Index (Iθ) 0.0024 1.20
4.40
Parameter index 0.50
Parametric profile index (mean r of all parameters) 4.99
Good compression index (IGC) 4.75
Table 7. Parameters, mean incidence and parametric index for API 842SD
Expert Systems for Human, Materials and Automation
28
Table 8. Radius parameters, mean incidence and parametric index for excipients DC
PARAMETERS ( radius ) FACTOR INDEX
Excipient Da Dc Ie IC Icd IH α t" %HR %H %pf (Iθ)
Dimension.
Compressibility
Flowability/
Powder Flow
Lubricity/
Stability.
Lubricity/
Dosage
IP PP IGC
Avicel
PH 101
Batch 6410C
3.47 4.63 6.02 5.01 10.00 5.55 3.46 0.00 3.84 8.17 3.38 10.00 4.05 7.01 3.01 6.01 6.69 0.50 5.29 5.04
Isomalt®
Batch LRE 539
4.40 5.60 4.06 4.29 10.00 5.76 6.24 6.85 4.01 9.89 9.00 2.00 5.00 6.11 6.28 6.95 5.50 0.58 6.01 5.72
Kleptose®
Batch 774639
5.58 8.46 5.08 6.81 10.00 4.95 3.51 6.50 0.00 8.12 3.60 1.90 7.02 7.30 4.98 4.06 2.75 0.58 5.38 5.12
Kollindon®
VA64
Batch 28-2921
2.53 3.43 8.64 5.25 6.91 5.48 6.04 5.25 3.19 2.85 8.40 5.50 2.98 6.93 5.59 3.02 6.95 0.67 5.29 5.03
Plasdone
®S630
Batch 6272473
2.48 3.73 10.00 6.70 10.00 4.99 4.13 0.00 3.46 3.17 3.60 5.70 3.11 8.90 3.04 3.32 4.65 0.33 4.83 4.60
Prosolv®
HD90
Batch K950044
4.86 5.96 3.17 3.69 10.00 5.91 5.99 6.75 3.44 8.86 6.24 10.00 5.41 5.62 6.22 6.15 8.12 0.67 6.24 5.94
SeDeM Diagram: A New Expert System for the Formulation of Drugs in Solid Form
29
0
5
10
Da
Dc
Ie
IC
Icd
IH
(α)
t
%HR
%H
% Pf
(Iθ)
Fig. 4. SeDeM Diagram for API 842SD
The SeDeM Diagram for API 842SD (Figure 4, Table 7) indicates that this substance has
deficient compressibility (r=3.40), limited rheological characteristics (r=4.15) and low
lubricity/dosage (r=4.40). Consequently, to apply direct compression to API 842SD, it
requires formulation with an excipient that enhances the compressibility factor. This
excipient is identified by the SeDeM system.
In order to select the excipient and the concentration used to correct the deficiencies and, in
particular, the compressibility, we applied the mathematical equation of the SeDeM Expert
system (Equation 7): replacing the unknowns (RE and RP) with the values calculated for
each substance (RE for excipients and RP for API) with aim to obtain R=5. The results
obtained are shown in Table 9.
EXCIPIENT Avicel®
PH101
Kleptose® Koll
VA®
Plasdone®
S630
Prosolv®
HD90
Isolmalt®
721
7.01 7.30 6.93 8.90 5.62 6.11
3.40 3.40 3.40 3.40 3.40 3.40
5.00 5.00 5.00 5.00 5.00 5.00
RE
RP (API)
R
% excipient 44.32 41.03 45.33 29.09 72.07 59.04
Table 9. Amount of excipient required to be mixed with the API to obtain a compressibility
factor equal to 5.
Plasdone S630 was the most suitable excipient to correct the deficit (compressibility) of API
842SD with the lowest concentration (29.09 %). (Table 9)
To better understand the SeDeM system, the graphical representations of the profiles of the
API and the excipient can be superposed. Figure 5 shows how the deficiencies of an API
would be compensated when formulated. The green line corresponds to the excipient that
theoretically provides the final mixture the characteristics to be compressed. In this way,
the information provided by the SeDeM system allows the formulator to start working with
excipients that have a high probability to provide suitable formulations, thus reducing the
lead time of formulation.
Expert Systems for Human, Materials and Automation
30
0
5
10
Da
Dc
Ie
IC
Icd
IH
(α)
t
%HR
%H
% Pf
(Iθ)
0
5
10
Da
Dc
Ie
IC
Icd
IH
(α)
t
%HR
%H
% Pf
(Iθ)
0
5
10
Da
Dc
Ie
IC
Icd
IH
(α)
t
%HR
%H
% Pf
(Iθ)
Fig. 5. Green indicates the part that corresponds to the excipient that provides suitable
compressibility to the final mixture with the API (in yellow). Three excipients are shown, all
of them covering the deficiencies of the API.
3.3 Application of the SeDeM system to the quality control of batches of a single API
or excipient used for direct compression
The SeDeM system is also apt for verification of the reproducibility of manufacturing
standards between batches of the same powdered raw material (API or excipient). Indeed,
superposing the SeDeM Diagrams of each batch, the degree of similarity or difference
between the same API on the basis of the established parameters can determine its
appropriateness for compression.
LOTE 40008
0
5
10
Da
Dc
Ie
IC
Icd
IH
(α )
t
%HR
%H
% Pf
(Iθ )
LOTE 40009
0
5
10
Da
Dc
Ie
IC
Icd
IH
(α )
t
%HR
%H
% Pf
(Iθ )
LOTE 40011
0
5
10
Da
Dc
Ie
IC
Icd
IH
(α )
t
%HR
%H
% Pf
(Iθ )
Fig. 6. SeDeM Diagram of 3 batches of API FO130.
The SeDeM method is also a useful tool for the study of the reproducibility of a
manufacturing method used for a powdered substance and, thus of the validation of
systematic variation during elaboration. A manufacturing process gives rise to variations
in the final product and these variations must fall within limits or established
specifications. By applying the SeDeM method to study reproducibility between batches
of the same API or excipient, specifications in the different parameters can be established
to ensure the same quality of the product regardless of the batch analyzed. In addition,
these specifications must be used for the establishment of particular limits for quality
control applications. To achieve this goal it is necessary to study the parameters of the
SeDeM Diagram, applying the same statistic analyses required to establish the
SeDeM Diagram: A New Expert System for the Formulation of Drugs in Solid Form
31
pharmacotechnical equivalence between batches. Correct reproducibility between batches
will ensure the reproducibility and the quality of the tablets formulated with this API or
excipient, regardless of the batch used.
Figure 6 shows the SeDeM Diagrams of three batches from the same API (Perez et al, 2006).
In this case the mark and the indices were very similar. This control has the advantage that
the method has the capacity to detect variations in particle size between batches of the
product. This capacity thus contributes to the formulation of the pharmaceutical forms and
their correct dissolution.
3.4 Application of the SeDeM method to differentiate the excipient in the same
chemical family
The SeDeM system also allows differentiation between excipients of the same chemical
family but that differ in physical characteristics. These characteristics will determine their
use in a formulation for direct compression of a given API. In a previous study (Suñé et al,
2008b) several lactoses were characterized, and in figure 7 can be observed the clear
differentiation that makes the SeDeM methodology between the same chemical substances
(but different functionally).
0
5
10
Da
Dc
Ie
IC
Icd
IH
(α )
t
%HR
%H
% Pf
(Iθ )
0
5
10
Da
Dc
Ie
IC
Icd
IH
(α )
t
%HR
%H
% Pf
(Iθ )
0
5
10
Da
Dc
Ie
IC
Icd
IH
(α )
t
%HR
%H
% Pf
(Iθ )
Fig. 7. SeDeM Diagram for three kinds of lactose. On the left: Lactose anhydre IGC: 5.39. In
the center: Lactose monohydrate IGC: 4.83. On the right: Lactose fast-flow IGC: 6.30.
3.5 Application of the SeDeM Diagram to differentiate excipients of the same
functional type
Also, the SeDeM Expert system allows differentiation between excipients from the same
functional type, for example disintegrants or diluents. In the former, the SeDeM
characterization provides the information required to predict the difficulties encountered for
compression.
By quantifying the 12 tests provided by the system, the deficient values for their
compression can be defined; on the basis of these values, an adequate (applying the same
SeDeM Diagram) substance can be selected to improve the compressibility in the final
mixture of the disintegrants and the API. Figure 8 shows the characterization of several
disintegrants using the SeDeM technique, where the differences between each one in
relation to their major or minor compression capacity are shown, although all are used
because of their disintegrant function (Aguilar et al, 2009).
Expert Systems for Human, Materials and Automation
32
Fig. 8. SeDeM diagram for several disintegrant excipients.
3.6 The new model SeDeM-ODT to develop orally disintegrating tablets by direct
compression
This innovative tool is the new SeDeM-ODT model which provides the Index of Good
Compressibility & Bucodispersibility (IGCB index) obtained from the previous SeDeM method
(Aguilar et al, 2011). The IGCB index is composed by 6 factors that indicate whether a mixture
of powder lends itself to be subjected to direct compression. Moreover, the index
simultaneously indicates whether these tablets are suitable as bucodispersible tablet
(disintegration in less than 3 minutes). The new factor, disgregability (Table 10), has three
parameters that influence this parameter. The graph now comprises 15 parameters (Figure 9).
Factor Parameter Limit value (v) Radius
Effervescence 0-5 (minutes) 10-0
Disintegration Time with disc (DCD) 0-3(minutes) 10-0
Disgregability
Disintegration Time without disc (DSD) 0-3 (minutes) 10-0
Table 10. The new factor disgregability is added to the SeDeM expert system to achieve the
SeDeM-ODT expert system.
Fig. 9. SeDeM-ODT Diagram
SeDeM Diagram: A New Expert System for the Formulation of Drugs in Solid Form
33
4. Conclusions
Here we developed an original methodology for the preformulation and powder substance
characterization. This method facilitates studies on the design and development of
formulations for the production of tablets by direct compression. The SeDeM expert system
is a useful tool because, in addition to considering the type of components, it also provides
recommendations on intrinsic properties, such as the characteristics and morphology of the
particles. We propose that given the accuracy of the information provided by this system,
formulations will have a higher probability of being successfully compressed.
This method characterizes the individual components of a formulation and applies a
mathematical analysis to determine the exact amount of each in the final formulation.
The formulation provided will be valid for direct compression. This manufacturing
procedure offers many advantages from a production perspective. In addition to being
faster than other techniques, it is straightforward as it reduces the number of steps during
the manufacturing process.
In addition SeDeM has the advantage of providing formulation with the lowest amount of
excipients as it combines the API with only one excipient and the standard formula of
lubricants, thus avoiding the used of unnecessary excipients, such as diluents, binders and
agglutinants.
The information given by the SeDeM system contributes to a Quality by Design
Development. Consequently, this innovative tool is consistent with the current requirements
of regulatory health authorities such as the FDA and ICH.
5. References
Aguilar_Díaz, J.E.; García-Montoya, E.; Pérez-Lozano, P.; Suñé-Negre, J.M.; Miñarro, M. &
Ticó, J.R. (2009). The use of the SeDeM Diagram expert system to determine the
suitability of diluents-disintegrants for direct compression and their use
in formulation of ODT.
Eur J Pharm & Biopharm, 73, pp. 414-423, ISSN: 0939-6411
Aguilar_Díaz, J.E.; García_Montoya, E.; Pérez_Lozano, P.; Suñé_Negre, J.M.; Miñarro, M. &
Ticó, J.R. (2011). Contribution to development of ODT using an innovator tool:
SeDeM-ODT.
Proceedings of X Congreso de la Sociedad Española de Farmacia Industrial y
Galénica, Madrid, 2-4 febrero 2011.
Braidotti, L. & Bulgarelli, D. (1974)
Tecnica Farmaceutica. (1ª ed), Lleditrice Scientifica LG
Guadagni, Milan
Brittain, H.G. (1997). On the Physical Characterization of Pharmaceutical Solids.
Pharm
Techn
, 1, pp. 100-106, ISSN: 1543-2521
Casadio, S. (1972).
Tecnologia Farmaceutica. (2ª ed), Cisalpino-Goliardica Ed., Milan
Córdoba Borrego, M.; Moreno Cerezo, J.M.; Córdoba Díaz, M. & Córdoba Díaz, D. (1996).
Preformulación y desarrollo galénico de nuevas formulaciones por compresión
directa con agentes hidrotrópicos.
Inf Farm, 4, pp. 65-70, ISSN: 0213-5574
European Pharmacopeia. (2011) (7th ed), Council of Europe, ISBN: 978-92-871-6053-9,
Strasbourgh
Font Quer, P.
Medicamenta: guía teórico práctica para farmacéuticos y médicos. (1962) (6th ed),
Labor Ed., Barcelona (1): 340 - 341.
García Montoya, E.; Suñé Negre, J.M.; Pérez Lozano, P.; Miñarro Carmona, M. & Ticó Grau,
J.R. (2010). Metodología de preformulación galénica para la caracterización de
Expert Systems for Human, Materials and Automation
34
sustancias en relación a su viabilidad para la compresión: Diagrama SeDeM.
Farmespaña Industrial, enero/febrero, pp.58-62, ISSN: 1699-4205.
Helman, J.
Farmacotecnia teórica y práctica. (1981), Compañía Internacional Continental. ISBN:
950-06-5081-9, Méjico 6: 1721.
Kibbe, A.H.
Handbook of Pharmaceutical Excipients. (2006) (5
th
ed), American Pharmaceutical
Association. Pharmaceutical Press, ISBN: 0-85369-381-1, London
Muñoz Ruíz, A.; Muñoz Muñoz, N.; Monedero Perales, M.C.; Velasco Antequera, M.V. &
Jiménez Castellanos Ballesteros, M.R. (1993). Determinación de la fluidez de sólidos
a granel. Métodos (I).
Ind Farm, 1, pp. 49-55, ISSN: 0213-5574
Pérez Lozano, P.; Suñé Negre, J.M.; Miñarro, M.; Roig, M.; Fuster, R.; García Montoya, E.;
Hernández, C.; Ruhí, R. & Ticó, J.R. (2006). A new expert system (SeDeM Diagram)
for control batch powder formulation and preformulation drug products.
Eur J
Pharm & Biopharm
, 64, pp. 351-359, ISSN:0939-6411
Suñé Negre, Pérez Lozano, P.; J.M.; Miñarro, M.; Roig, M.; Fuster, R.; García Montoya, E.;
Hernández, C.; Ruhí, R. & Ticó, J.R. Optimization of parameters of the SeDeM
Diagram Expert System: Hausner index (HI) and Relative Humidity (%HR).
(2011). Approved April 2011
Eur J Pharm & Biopharm. ISSN: 0939-6411. DOI:
10.1016/J.EJPB.2011.04.002
Rubinstein, M.H.
Pharmaceutical Technology (Tabletting Technology). (1993), (1st Ed), SA de
Ediciones, ISBN:978-0136629580, Madrid
Suñé Negre, J.M.; Pérez Lozano, P.; Miñarro, M.; Roig, M.; Fuster, R.; García Montoya, E.;
Hernández, C.; Ruhí, R. & Ticó, J.R. Nueva metodología de preformulación
galénica para la caracterización de sustancias en relación a su viabilidad para la
compresión: Método SeDeM. (2005).
Cienc Tecnol Pharm, 15, 3, pp. 125-136,
ISSN:1575-3409
Suñé Negre JM, Pérez Lozano, P.; J.M.; Miñarro, M.; Roig, M.; Fuster, R.; García Montoya, E.;
Hernández, C.; Ruhí, R. & Ticó, J.R. (2008). Application of the SeDeM Diagram and
a new mathematical equation in the design of direct compression tablet
formulation.
Eur J Pharm & Biopharm, 69, pp.1029-1039, ISSN: 0939-6411.
Suñé Negre, J.M.; Pérez Lozano, P.; Miñarro, M.; Roig, M.; Fuster, R.; García Montoya, E. &
Ticó, J.R. (2008). Characterization of powders to preformulation studies with a new
expert system (sedem diagram).
Proceedings of 6th World Meeting on Pharmaceutics,
Biopharmaceutics and Pharmaceutical Technology,
Barcelona, April 2008.
Torres Suárez, A.I. & Camacho Sánchez MA. (1991). Planteamiento de un programa de
preformulación y formulación de comprimidos.
Ind Farm, 2, pp. 85-92, ISSN: 0213-
5574
Wong, L.W & Pilpel N. (1990). The effect of particle shape on the mechanical properties of
powders.
Int J Pharm, 59, pp.145-154, ISSN: 0378-5173
3
Parametric Modeling and Prognosis
of Result Based Career Selection Based
on Fuzzy Expert System and Decision Trees
Avneet Dhawan
Lovely Faculty of Technology and Sciences,
Lovely Professional University, Punjab,
India
1. Introduction
1.1 Expert system and its applications
An Expert System is a set of programs that manipulate encoded knowledge to solve
problems in a specialized domain that normally requires human expertise. The expert’s
knowledge is obtained from the specialists or other sources of expertise, such as texts,
journal articles and databases
Year # of expert systems developed
1985 50
1986 86
1987 1100
1988 2200
1992 12000
Table 1. Increase in number of expert systems developed yearly (based on Durkin, 1998)
Area systems % of Expert
Engineering & manufacturing 35
Business 29
Medicine 11
Environment & Energy 9
Agriculture 5
Telecommunications 4
Government 4
Law 3
Transportation 1
Table 2. Applications of expert systems in various fields.
Human computer interaction and web-based intelligent tutoring concepts come into play
while implementing an online educational tool whose target is mostly unskilled or novice
Expert Systems for Human, Materials and Automation
36
users. The users (the students in this context) have to be provided with tools that will be
helpful in improving their skills in the targeted area. A successful web based education
system should have intelligence to tackle the variation in student skills and backgrounds
and it should also be able to adapt its contents according to that variation. These mentioned
issues are the main concerns for web-based intelligent tutoring research area. For a robot
supported laboratory the skill building is both to learn and to gain experience about the
control of the robot involved in the experiment setup and to be successful in carrying out the
experimentation that is required for the student in order to gain practical knowledge in the
targeted area. In order to adapt the context of the experimentation to the variation in student
behaviors, students should be modeled according to their skills and knowledge
backgrounds. User modelling is an important aspect of both human computer interaction
and web-based intelligent tutoring research areas. AI techniques can be applied to the user
modelling for implementation of online experimentation framework to get useful
information about the student skill and knowledge level for providing help when necessary
and assessing his/her performance.
Examples of the early and famous expert systems
• DENDRAL - Stanford Univ. (1965)
• Analysis of chemical compunds
• Rule-based system
• CADACEUS - Univ. of Pittsburgh (1970)
• Diagnosis of human internal diseases
• MYCYSMA - MIT (1971)
• Symbolic mathematical analysis
ES are appropriate in domains when/where:
• there are no established theories
• human expertise is scarce or in high demand, but recognized experts exist
• the information is fuzzy, inexact or incomplete
• the domain is highly specific
Human computer interaction field deals with enhancing the ways in which users interact with
one or more computational machines through design, evaluation and implementation of
interactive computing systems. From the perspective of telerobotics or more specifically online
robotic experimentation, human computer interaction field deals with providing interfaces for
remote users which enable them to do the necessary manipulation successfully. There is a
strong need for an intelligent interface for a framework for remote access of robot supported
laboratories through the Internet. The two main reasons for that are:
1. The need for intelligently coaching the student to achieve the goals of the
experimentation successfully.
2. The need for evaluating student’s performance while carrying out the experiment.
Student evaluation, the first main issue mentioned above, is one of the key issues for a
remote experimentation framework. Students who are carrying out the experimentation,
online without a human assistant or a teacher, should all be evaluated according to their
varying success levels. The interface should possess suitable intelligence to categorize the
student according to his or her performance during the course of the experiment and
possibly to evaluate whether an increase or decrease in performance is present according to
the past performance of the users. Necessary grades can then be given to those students
according to the performance category in which they tend to fall.
Parametric Modeling and Prognosis of Result Based
Career Selection Based on Fuzzy Expert System and Decision Trees
37
Students, while doing the experiments online by themselves should be coached just as in the
case for a traditional laboratory work where the coach is a human assistant or a teacher.
They can be given useful directions and recommendations in the form of messages on the
interface. Another aspect of coaching is to adapt the level of the complexity of the
experiment to the level of the student. Skilled students can be excluded from some parts of
the experiment, where unskilled students or students showing a poor performance can be
directed to finish the fundamental parts or repeat the unsuccessful parts of the experiment.
This idea coincides with the aim of using adaptive hypermedia for intelligent web-based
tutoring tools, where the content of the tutor is changed adaptively to suit the student’s
individual needs and interests.
There are also other key aspects for a successful interface, which are:
- Having a layout that provides the student with all the necessary information about the
objectives and the states of the experiment, and visual displays for aiding the users to
see the state of the robot and the experimental setup.
- Providing a security mechanism that prevents unwanted and unauthorized access to
protect the system from possible malicious use. Another issue for the robot-supported
online experimentation is providing a scenario for the experiment. The experiment
should involve a useful scenario that is relevant to the educational context that it is
applied to and which must have tasks that have different levels of complexity to be
accomplished.
By this way, using an intelligent interface for an online robot-supported experimentation
will be justified. The educational contexts to benefit from remote experimentation can be
range from mechatronics laboratories to chemistry laboratories. According to the scenario,
the students can be directed to complete the levels of the experiment according to their skill
level and be coached without the actual presence of a human assistant or a teacher.
In accordance with the issues and the needs stated, the aim of the work given in this thesis is
to build a user assessment and coaching framework for an intelligent interface in use during
remote access of labs through the Internet involving telerobotics or teleoperation. The lab
setup can be assisted by either a robot or any device that is connected to the Internet.
The specific goals of the approach are that:
1. The interface should provide the student with "hands on" experimentation by using
visual feedback and give the user as much freedom as possible to control the
experiment;\
2. The system should evaluate the user performance, adapt the context to the level of
acquired knowledge and skill of the user, and thus intelligently coach him/her to
successfully do the experiment and get the most out of the experimentation.
The concepts and tools borrowed from fields such as web-based intelligent tutoring, human-
computer interaction, user-adapted interaction and Internet telerobotics are necessary for
the successful accomplishment of our goals in the education oriented lab access through the
Internet.
The main objective of this study is, thus, to develop an intelligent interface that can be used
for the Internet access of robot supported laboratory. The main differences from the
previously surveyed works that are already present in the literature are that the proposed
system learns how to assess based on the user behavior while providing online robotics-
enhanced experimentation, and coaches him/her towards the successful achievement of the
tasks while evaluating user performances. Thus, the proposed approach is behavior-based
task planning of online users by being a combination of concepts borrowed from intelligent
Expert Systems for Human, Materials and Automation
38
tutoring, student modeling and Internet robotics. Some important properties of the system
can be stated briefly as follows:
• From the nature of the Internet, the system serves to a diverse number of students each
having different knowledge and skill levels. The system is adaptive to these different
levels and provides each student with enough assistance for accomplishing the desired
experiment and getting the necessary knowledge and experience.
• Assistance provided to the student is in the form of generated messages or mandatory
commands such as the repetition of a previously failed step of the experiment.
• Students are assigned experiments having different complexity levels according to their
past and present performances.
• The system grades students according to their performances, and stores grades and
student profiles in a database.
• The system has an authentication module to ensure security and to recall a previous
user from the database.
Fuzzy approach is most suitable for modelling user behaviours from a pattern matching
point of view because of its abilities of generalization over the training data set to deal with
the fuzzy nature of the user behaviour data. A rule-based system only on its own would
require every combination of possible user behaviour data should be explicitly encoded
within. Therefore employing a neural network is a feasible solution to the problem of
modelling students while doing an online experimentation by using previously defined
behaviour stereotypes.
2. Fuzzy expert systems
A fuzzy expert system is an expert system that uses fuzzy logic instead of Boolean logic. In
other words, a fuzzy expert system is a collection of membership functions and rules that
are used to reason about data. Unlike conventional expert systems, which are mainly
symbolic reasoning engines, fuzzy expert systems are oriented toward numerical
processing. The rules in a fuzzy expert system are usually of a form similar to the following:
=if x is low and y is high then z medium
Where x and y are input variables (names for know data values), z is an output variable (a
name for a data value to be computed), low is a membership function (fuzzy subset) defined
on x, high is a membership function defined on y, and medium is a membership function
defined on z. The part of the rule between the "if" and "then" is the rule's premise or
antecedent. This is a fuzzy logic expression that describes to what degree the rule is
applicable. The part of the rule following the "then" is the rule's conclusion or consequent.
This part of the rule assigns a membership function to each of one or more output variables.
Most tools for working with fuzzy expert systems allow more than one conclusion per rule.
A typical fuzzy expert system has more than one rule. The entire group of rules is
collectively known as a rule base or knowledge base.
2.1 The inference process
With the definition of the rules and membership functions in hand, we now need to know
how to apply this knowledge to specific values of the input variables to compute the values
of the output variables. This process is referred to as inferencing. In a fuzzy expert system,
the inference process is a combination of four subprocesses: fuzzification, inference,
Parametric Modeling and Prognosis of Result Based
Career Selection Based on Fuzzy Expert System and Decision Trees
39
composition, and defuzzification. The defuzzification subprocess is optional. For the sake of
example in the following discussion, assume that the variables x, y, and z all take on values
in the interval [0, 10], and that we have the following membership functions and rules
defined.
()
()
Low t 1 t / 10
High t t / 10
Rule 1 : if x is low and y is low then z is hi
g
h
Rule 2 : if x is low and y is high then z is low
Rule 3 : if x is high and y is low then z is low
Rule 4 : if x is high and y i
=−
=
s hi
g
h then z is hi
g
h
Notice that instead of assigning a single value to the output variable z, each rule assigns an
entire fuzzy subset (low or high). In this example, low (t)+high (t)=1.0 for all t. This is not
required, but it is fairly common. The value of t at which low (t) is maximum is the same as
the value of t at which high (t) is minimum, and vice-versa. This is also not required, but
fairly common. The same membership functions are used for all variables.
A fuzzy rule based expert system contains fuzzy rules in its knowledge base and derives
conclusions from the user inputs and fuzzy reasoning process. A fuzzy controller is a
knowledge based control scheme in which scaling functions of physical variables are used to
cope with uncertainty in process dynamics or the control environment. They must usually
predefined membership function and fuzzy inference rules to map numeric data into
linguistic variable terms (e.g. very high, young,) and to make fuzzy reasoning work. The
linguistic variables are usually defined as fuzzy sets with appropriate membership
functions. Recently, many fuzzy systems that automatically derive fuzzy if-then rules from
numeric data have been developed. In these systems, prototypes of fuzzy rule bases can
then be built quickly without the help of human experts, thus avoiding a development
bottleneck. Membership functions still need to be predefined, however, and thus are usually
built by human experts or experienced users. The same problem as before then arises: if the
experts are not available, then the membership functions cannot be accurately defined, or
the fuzzy systems developed may not perform well. A recent methodology was developed
to automatically generate membership functions by Hong. et al. this methodology can be
applied to a set of data used for a speaker independent voice recognition application.
The conventional practice of student performance practices used globally is based on the
marks obtained in the courses opted. The marks are averaged for an overall estimation of
the show of the students. In an advanced system the cumulative assessment is done in a
group for awarding the grades based on the cumulative performance index (CPI) evaluated
on the statistical model, agreed upon by the Academic Council of the University.
The attendance is taken as variable A
1
to A
N
(Fig. 1.0) in the respective subjects, the overall
attendance A
O
is calculated on simple averaging function. The evaluated A
O
is then taken into
account for deciding whether the student will be allowed to appear in the examination or the
student will be detained. This is based on simple comparison operator of less than or equal to
the specified attendance. Once the student satisfies this condition of minimum attendance
required, the student is made to appear in the examination. On the basis of evaluation of the
answer sheets individualistic marks B
1
to B
N
are derived for subjects 1,2, 3 … N respectively.
As in case of attendance, the marks of individual subjects are also averaged to fetch overall
Expert Systems for Human, Materials and Automation
40
marks B
O
. On the basis of this B
O
the result of the student is formulated and a division based
on characterization of marks range is done. Mathematically on the basis of overall attendance
the students qualify to appear in the examination based on a crisp rule as
Fig. 1.
Where X is the eligibility percentage of overall attendance, if the overall attendance is > 65%,
f
A
(x) is 1, then the student is allowed to appear in the exam.
In an advanced conventional system a grading system is eviscerated which is based on the
cumulative indexing of the students. This is also a linear method reporting the output of
performance on the basis of comparative grading in a group.
The conventional system adopted by the academic institutions is well endeavored and is
time tested. The intelligence or the cognitive performance derivation is lacking. Moreover
the logical weaving of attendance and the marks obtained in a subject is not done, the
outcome of this results in a standalone performance rating and is also not amicable for the
parents to assimilate.
2.2 Architecture of a fuzzy expert system
Fig. 2 shows the basic architecture of a fuzzy expert system. Individual components are
illustrated as follows.
Fig. 2. Architecture of a fuzzy expert system
Parametric Modeling and Prognosis of Result Based
Career Selection Based on Fuzzy Expert System and Decision Trees
41
User interface: For communication between users and the fuzzy expert system. The interface
should be as friendly as possible.
Membership function base: A mechanism that presents the membership functions of different
linguistic terms.
Fuzzy rule base: A mechanism for storing fuzzy rules as expert knowledge.
Fuzzy inference engine: A program that executes the inference cycle of fuzzy matching, fuzzy
conflict resolution, and fuzzy rule firing according to given facts.
Explanation mechanism: A mechanism that explains the inference process to users.
Working memory: A storage facility that saves user inputs and temporary results.
Knowledge-acquisition facility: An effective knowledge-acquisition tool for conventional
interviewing or automatically acquiring the expert’s knowledge, or an effective machine-
learning approach to deriving rules and membership functions automatically from training
instances, or both. Here the membership functions are stored in a knowledge base (instead
of being put in the interface) since by our method, decision rules and membership functions
are acquired by a learning method. When users input, facts through the user interface, the
fuzzy inference engine automatically reasons using the fuzzy rules and the membership
functions, and sends fuzzy or crisp results through the user interface to the users as outputs.
In the next section, we propose a general learning method as a knowledge-acquisition
facility for automatically deriving membership functions and fuzzy rules from a given set of
training instances. Based on the membership functions and the fuzzy rules derived, a
corresponding fuzzy inference procedure to process user inputs is developed.
2.3 Data-driven fuzzy rule based approach
Reasoning based on fuzzy approaches has been successfully applied for the inference of
multiple attributes containing imprecise data; in particular, fuzzy rule-based systems (FRBS)
which provide intuitive methods of reasoning have enjoyed much success in solving real-
world problems. Recent developments in this area also show the availability of FRBS which
allow interpretation of the inference in the form of linguistic statements whilst having high
accuracy rates. The use of linguistic rule models such as "If assignment is very poor and
exam is average then the final result is poor" helps capturing the natural way in which
humans make judgements and decisions. Furthermore, historical data that is readily
available in certain application domains can be used to build fuzzy models which integrate
information from data with expert opinions. It is also important that the designed fuzzy
models are interpretable by, and explainable to, the user . This section describes a newly
proposed data-driven fuzzy rule induction method that achieves such objectives, and shows
how the method can be applied to the classification of student performance. Description of
Neuro-Fuzzy Classification (NEFCLASS) algorithm, which will be used later for
comparison, is also given briefly in this section.
2.4 Inducting primitive machine intelligence in performance analysis and reporting by
linear logic
The present scenario of performance evaluation is on the basis of a linear model where the
result of the process is in terms of the division or the grades obtained by the student. The
system is not capable of deriving cognitive inherence based on the attendance and the marks
obtained. It is left to the student, parent and the employer to derive the performance on the
division or the grades.
Expert Systems for Human, Materials and Automation
42
3. The logical engine
Several approaches using fuzzy techniques have been proposed to provide a practical
method for evaluating student academic performance. However, these approaches are
largely based on expert opinions and are difficult to explore and utilize valuable
information embedded in collected data. This paper proposes a new method for evaluating
student academic performance based on data-driven fuzzy rule induction. A suitable fuzzy
inference mechanism and associated Rule Induction Algorithm is given. The new method
has been applied to perform
Criterion-Referenced Evaluation (CRE) and comparisons are made
with typical existing methods, revealing significant advantages of the present work. The
new method has also been applied to perform
Norm- Referenced Evaluation (NRE),
demonstrating its potential as an extended method of evaluation that can produce new and
informative scores based on information gathered from data. The need of the hour is to
device a proposition where, an intelligent system sits inside the conventional system and
deduce decisions based on the attendance and the marks obtained. Two sets are formulated
Set A is for attendance and Set B is for marks obtained in the examination by the student.
()
{
}
()
()
()
()
()
: X 0, 1 , where
1 if x is totally in A; Eligible
0 if x is not in A; Not Eli
g
ible
0
A
A
A
A
µx
µx
µx
µx
→
=
=
< 1 if x is partly in A.<
3.1 The knowledge acquisition facility
A new learning method for automatically deriving fuzzy rules and membership functions
from a given set of training instances is proposed here as the knowledge acquisition facility.
3.1.1 Notation and definitions
In a training instance, both input and desired output are known. For a m-dimensional input
space, the ith training example can then be described as
()
,
, , ; ,
il i2 im i
xx x y
where x
ir
(1 < r < m) is the r
th
attribute value of the i
th
training example and y
i
is the output
value of the i
th
training example.
For example, assume an insurance company decides
insurance fees according to two
attributes:
age and property. If the insurance company evaluates and decides the insurance
fee for a person of age 20 possessing property worth $30000 should be $1000, then the
example is represented as (age = 20, property = $30 000, insurance fee = $1000).
3.1.2 The algorithm
The learning activity is shown in Fig. 3
A set of training instances is collected from the environment. Our task here is to generate
automatically reasonable membership functions and appropriate decision rules from these
training data, so that they can represent important features of the data set. The proposed
learning algorithm can be divided into five main steps:
Step 1. cluster and fuzzify the output data;
Parametric Modeling and Prognosis of Result Based
Career Selection Based on Fuzzy Expert System and Decision Trees
43
Step 2. construct initial membership functions for input attributes;
Step 3. construct the initial decision table;
Step 4. simplify the initial decision table;
Step 5. rebuild membership functions in the simplification process;
Step 6. derive decision rules from the decision table.
Fig. 3. Learning activity.
3.2 Weighted Subset Hood-Based Algorithm (WSBA)
Simplicity in generating fuzzy rules and the ability to produce high classification accuracy
are the main objectives in the development of WSBA. To achieve these objectives, fuzzy
subset hood measures and weighted linguistic fuzzy modelling are employed.
Fig. 4. Structure of WSBA Approach
Expert Systems for Human, Materials and Automation
44
This method does not require any threshold value and generates a fixed number of rules
according to the number of classes of interest (i.e. one rule will be created for each class). In
the process of generating fuzzy rules, linguistic terms that have a weight greater than zero
will automatically be promoted to become part of the antecedents of the resulting fuzzy
rules. Any linguistic term that has a weight equal to 0 will of course be removed from the
fuzzy rule. This will make the rules simpler than the original default rules. In running
WSBA for classification tasks, the concluding classification will be that of the rule whose
overall weight is the highest amongst all. The structure of WSBA approach is shown in
Figure 4. Example applications of WSBA can be found in.
3.3 Neuro-Fuzzy Classification (NEFCLASS)
Neuro-Fuzzy Classification (NEFCLASS) is an FRBS which combines a neural network
learning approach with a fuzzy rule-based inference method . NEFCLASS can be encoded as
a three-layer feedforward neural network. The first layer represents the fuzzy input
variables, the second layer represents the fuzzy rulesets and the third layer represents the
output variables. The functional units in this network implement t-norms and t-conorms,
replacing the activation functions that are commonly used in conventional neural networks.
NEFCLASS is a data-driven FRBS that has the ability to create fuzzy membership functions
and fuzzy rules automatically from training instances. Prior knowledge in the form of fuzzy
rules can also be added to the rule base and used alongside new rules created using the
training dataset.
Fuzzy rules are generated based on overlapping rectangular clusters that are created by the
grid representing fuzzy sets for the conditional attributes. Clusters that cover areas where
training data is located are added to the emerging rule-base. The system allows the user to
choose the maximum number of rules, otherwise the number of rules are restricted to that of
just the best performing ones. The firing strength of each rule is used to reach the conclusion
on the decision class of new observations.
The number of partitions and the shape of membership functions of the conditional
attributes are user-defined. The rule learning process can be started, for example, using a
fixed number of equally distributed triangular membership functions. A simple heuristic
method is used for the optimization of membership functions. The optimization process
results in changes to the membership function's shape by making the supports of the fuzzy
set larger or smaller. Constraints can be employed in the optimization process to make sure
that the fuzzy sets overlap each other.
NEFCLASS has undergone through several refinements over the years. For example, to
enhance the interpretability of the induced fuzzy rules, NEFCLASS offers additional
features such as rule pruning and variable pruning. The system has also been tested not
only for classification of benchmark datasets but also for real world problems such as
presented in.
3.4 Experimental results
The experiments presented in this section served as examples to illustrate the potential of
WSBA for the evaluation of student performance. Note that a wide range of assessment
methods are available and have been used (see for example ), depending on the purpose to
conduct the assessment. In this paper, only CRE and NRE are considered for the
Parametric Modeling and Prognosis of Result Based
Career Selection Based on Fuzzy Expert System and Decision Trees
45
implementation. The objective of the experiment involving CRE is to provide evidence that
the proposed algorithm will produce results similar to the original grades obtained using
statistical methods, if an ideal and representative training data is available.
The objective of the experiment involving NRE is to show that WSBA is able to produce
grades that can be used to provide additional information on the achievement of the
students. In conducting these experiments, the following aspects have been taken into
account:
In data-driven rule based systems, decision classes of the training instances are typically
those given by experts. In students' performance evaluation, such decisions are normally
given by experts based on an aggregation of numerical crisp scores. This method is used to
obtain the decision class for the training data.
The small training data (SAP50A and SAP50B) is used as an example and in the form of
numerical crisp scores, which is the most popular way to measure student performance.
Note that the fuzzy approach allows the possibility of utilizing data in the form of fuzzy
values such as those proposed in or in terms of linguistic labels that represent the fuzzy sets.
In such cases, the decision class for the training data is determined by fuzzy values (see for
example).
To avoid confusion, 'original score/grade' in this section will refer to the score and grade
obtained from the use of the standard statistical mean and 'new score/grade' will refer to
the score or grade obtained from existing fuzzy approaches, including WSBA and
NEFCLASS. Note that both datasets used include only numerical scores, to facilitate
comparison with other approaches. This need not be the case in general, the scores of
individual assessment components may be given in fuzzy terms (as often the case for
coursework grading for instances).
3.5 Criterion Referenced Evaluation (CRE)
NEFCLASS is used for further comparison, employing a fuzzy rule-based approach. The
dataset used for the purpose of training WSBA and NEFCLASS models is a set of student
performance records (labeled SAP50A). It consists of 50 instances, involving three
conditional attributes: assignment, test and final exam, and five possible classification
outcomes: Unsatisfactory (E), Satisfactory (D), Average (C), Good (B) and Excellent (A).
Note that the term 'Average' describing students' performance used in this paper is not
referring to the statistical average. For the sake of simplicity, only five linguistic labels
similar to the classification outcomes are used to represent student achievements. The fuzzy
partitions and labels are based on expert opinions representing the students' performance.
The primary assumption is that the partitions chosen by experts are those best possible to
represent the training data (SAP50A).
Clearly, better fuzzification, if available will help improve the experimental results reported
below. Note that the given definition of the fuzzy sets is obtained solely on the basis of the
normal distribution of the crisp marks given. This ensures their comparison with other
approaches.
The classification of the grades in this experiment is based on an interval that refers to the
level of performance given by experts. To facilitate a fair comparison, the same dataset
consisting of 15 instances and having the same features as the training dataset is used for all
of the methods. For instance: