Heat and Mass Transfer Modeling and Simulation Part 1 pptx
Bạn đang xem bản rút gọn của tài liệu. Xem và tải ngay bản đầy đủ của tài liệu tại đây (795 KB, 20 trang )
HEAT AND MASS
TRANSFER – MODELING
AND SIMULATION
Edited by Md Monwar Hossain
Heat and Mass Transfer – Modeling and Simulation
Edited by Md Monwar Hossain
Published by InTech
Janeza Trdine 9, 51000 Rijeka, Croatia
Copyright © 2011 InTech
All chapters are Open Access articles distributed under the Creative Commons
Non Commercial Share Alike Attribution 3.0 license, which permits to copy,
distribute, transmit, and adapt the work in any medium, so long as the original
work is properly cited. After this work has been published by InTech, authors
have the right to republish it, in whole or part, in any publication of which they
are the author, and to make other personal use of the work. Any republication,
referencing or personal use of the work must explicitly identify the original source.
Statements and opinions expressed in the chapters are these of the individual contributors
and not necessarily those of the editors or publisher. No responsibility is accepted
for the accuracy of information contained in the published articles. The publisher
assumes no responsibility for any damage or injury to persons or property arising out
of the use of any materials, instructions, methods or ideas contained in the book.
Publishing Process Manager Alenka Urbancic
Technical Editor Teodora Smiljanic
Cover Designer Jan Hyrat
Image Copyright Nejron Photo, 2010. Used under license from Shutterstock.com
First published September, 2011
Printed in Croatia
A free online edition of this book is available at www.intechopen.com
Additional hard copies can be obtained from
Heat and Mass Transfer – Modeling and Simulation, Edited by Md Monwar Hossain
p. cm.
ISBN 978-953-307-604-1
free online editions of InTech
Books and Journals can be found at
www.intechopen.com
Contents
Preface IX
Chapter 1 Modeling of Batch and Continuous
Adsorption Systems by Kinetic Mechanisms 1
Alice F. Souza,
Leôncio Diógenes T. Câmara
and Antônio J. Silva Neto
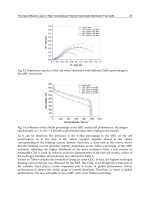
Chapter 2 The Gas Diffusion Layer in High Temperature
Polymer Electrolyte Membrane Fuel Cells 17
Justo Lobato, Pablo Cañizares,
Manuel A. Rodrigo and José J. Linares
Chapter 3 Numerical Analysis of Heat and Mass
Transfer in a Fin-and-Tube Air Heat Exchanger
under Full and Partial Dehumidification Conditions 41
Riad Benelmir and Junhua Yang
Chapter 4 Process Intensification of
Steam Reforming for Hydrogen Production 67
Feng Wang, Guoqiang Wang and Jing Zhou
Chapter 5 Heat and Mass Transfer in
External Boundary Layer Flows Using Nanofluids 95
Catalin Popa, Guillaume Polidori,
Ahlem Arfaoui and Stéphane Fohanno
Chapter 6 Optimal Design of Cooling Towers 117
Eusiel Rubio-Castro, Medardo Serna-González,
José M. Ponce-Ortega and Arturo Jiménez-Gutiérrez
Chapter 7 Some Problems
Related to Mathematical
Modelling of Mass Transfer Exemplified
of Convection Drying of Biological Materials 143
Krzysztof Górnicki and Agnieszka Kaleta
VI Contents
Chapter 8 Modeling and Simulation of
Chemical System Vaporization at High
Temperature: Application to the Vitrification of
Fly Ashes and Radioactive Wastes by Thermal Plasma 167
Imed Ghiloufi
Chapter 9 Nonequilibrium Fluctuations in
Micro-MHD Effects on Electrodeposition 189
Ryoichi Aogaki and Ryoichi Morimoto
Preface
This book covers a number of topics in heat and mass transfer processes for a variety
of industrial applications. The research papers provide information and guidelines in
terms of theory, mathematical modeling and experimental findings in many research
areas relevant to the design of industrial processes and equipment. The equipment
includes air heaters, cooling towers, chemical system vaporization, high temperature
polymerization and hydrogen production by steam reforming. Nine chapters of the
book will serve as an important reference for scientists and academics working in
research areas mentioned above, at least in the aspects of heat and/or mass transfer,
analytical/numerical solutions and optimization of the processes.
The first chapter deals with the description and mass transfer analysis of fixed-bed
chromatographic processes by kinetic adsorption. The second chapter focuses on the
effects of gas diffusion layer on the heat transfer process in high temperature
polymerization. Chapter 3 is concerned with the description and analysis of heat and
mass transfer processes in a fin-and-tube air heater. Hydrogen production by steam
reforming and the process intensification strategies are discussed in chapter 4. The
effects of external boundary layer in the analysis of heat and mass transfer processes
are presented in chapter 5, while optimization of these processes in the design of
cooling towers is discussed in chapter 6.
In the seventh chapter certain problems associated with the mathematical modeling of
chemical reactor processes are discussed with numerical calculations. Chapter 8 deals
with the modeling and simulation of chemical system vaporization with detail
description of the transport processes. Chapter 9 introduces the multiphase modeling
of complex processes: the effect of non equilibrium fluctuations in electrochemical
reactions such as electrodeposition.
Md Monwar Hossain, PhD
Associate professor in Chemical Engineering
Department of Chemical & Petroleum Engineering
United Arab Emirates University
United Arab Emirates
1
Modeling of Batch and Continuous
Adsorption Systems by Kinetic Mechanisms
Alice F. Souza
1
, Leôncio Diógenes T. Câmara
2
and Antônio J. Silva Neto
2
1
Universidade Federal do Rio de Janeiro-UFRJ, Rio de Janeiro-RJ,
2
Instituto Politécnico da Universidade do Estado do Rio de Janeiro, IPRJ-UERJ
Dep. Mechanical Eng. Energy - DEMEC, Nova Friburgo-RJ,
Brazil
1. Introduction
This chapter is related to the main aspects of the kinetic adsorption models by
heterogeneous mechanisms applied in the studies of mass transfer in chromatography. The
kinetic adsorption models are implemented and described according to the adsorption
mechanisms as in the next Figure 1. The illustrations as in Fig. 1 are a good way to show the
steps in the determination of the final models that represent the mass transfer between the
solid and liquid phase.
a) b)
Fig. 1. Mechanisms of heterogeneous kinetic adsorption of molecules A on sites s.
From Fig. 1a) can be observed that the mass transfer of molecules A and B between the
liquid (left) and solid (right) phase is related to the surface of the solid phase, so it depends
on number of active sites on the surface and the number of molecules in the liquid phase.
Such surface mechanism is called adsorption and it is represented in the Fig. 1b). In Fig. 1b)
the adsorption is related to a kinetic constant k
1
and the desorption is related to a kinetic
constant k
2
. The adsorption is the main phenomenology present in the chromatography
which provides different affinities of the molecules with the adsorbent phase leading to the
separation.
The kinetic modeling approach utilized in this work considers the total sum of the
adsorption sites which can be located on the internal and external active surface. The
Heat and Mass Transfer – Modeling and Simulation
2
modeling routines were implemented in Fortran 90 and the equations solved numerically
applying the 4
th
order Runge-Kutta method (time step of 10
-4
).
The rate of consumption of the molecules A (-r
A
) can be written as follow in terms of the
mass balance between the adsorbent solid phase and the liquid phase.
1212
() . .
AASASASA
rkCCkC kCCkq
(1)
in which C
A
, C
S
and q
A
corresponds, respectively, to the concentration of solute A in the
liquid phase, the concentration of active sites on the adsorbent phase and the concentration
of solute A in the solid phase.
Different types of adsorption processes can be considered in the separation as can be seen in
the Fig. 2. In the batch adsorption process (Fig. 2a) there is no flow entering and exiting the
system; In the continuous (Fig. 2b) there is flow entering and exiting and it is considered
perfect mixture (CSTR) inside the system in which the concentration inside is the same at
the exit; and in the plug flow (PFR) also there is flow entering and exiting and it is
considered an axial variation of concentration along the system.
Fig. 2. Types of adsorption processes: a) batch; b) continuous (CSTR) and c) plug flow (PFR).
In the case of batch adsorption process (Fig. 2a) the moles balance (N moles per time)
equation is applied without the terms of flow entering and exiting,
00
.
j
JJJ
dN
FFrV
dt
.
j
J
dN
rV
dt
(2)
leading to a final expression of rate of adsorption that can be substituted into Eq. 1.
.
j
J
dN
r
Vdt
j
J
dC
r
dt
(3)
The following final expression (Eq. 4) shows that the concentration of solute A in the liquid
phase decreases with the adsorption and increases with the desorption.
12
.
A
AS A
dC
kC C kq
dt
(4)
2. Continuous separation by reversible kinetic adsorption models
The chromatographic separation processes, which are involved by the adsorption
phenomena, correspond to a very important field for separating substances with high
Modeling of Batch and Continuous Adsorption Systems by Kinetic Mechanisms
3
aggregated value utilized mainly by the chemical and pharmaceutical industry. The
application of the modeling and simulation to study such separation mechanisms is a key
factor for the comprehension and therefore the improvement of the performance of the
chromatographic systems.
The modeling of the chromatographic separation processes can be done applying different
mathematical approaches, with advantages and limitations according to the method
assumed. A revision of the dynamic and mathematical modeling of the adsorption
isotherms and chromatography can be seen in the work of Ruthven, 1984. Among the
models of mass transfer kinetics in chromatography, the LDF and the Langmuir, are the
most utilized, being both related to a first order kinetic of mass transfer (Guiochon and Lin,
2003). The publication of Thomas (1944) corresponds to a precursor work following the
simple adsorption kinetic of Langmuir (kinetic of first order), which derived a solution for
the Riemann problem (i.e, for the breakthrough curve) of a model of chromatography
combined with the mass balance equation of an ideal model (no axial diffusion). Later,
Goldstein (1953) derived a solution of the Thomas model that is valid in the case of a
rectangular pulse injection. Wade et al. (1987) obtained a simple solution of the Thomas
model that is valid in the case of a Dirac injection. Following the same consideration of
adsorption order (kinetic of first order), Chase (1984) derived an analytical form for the
breakthrough curve, being it identical to the Thomas’s model.
The assumption of LDF or adsorption kinetic of first order is a way to reduce the complexity
of the chromatographic systems, being possible through this procedure achieve analytical
expressions that can represent the dynamic behavior of these processes as obtained by
Thomas (1944) and Chase (1984). The study of the chromatographic continuous systems by
the consideration of others adsorption orders is a possibility to understand the separation
mechanisms by adsorption, although this procedure can lead to more complex mathematical
models. The application of the continuous mass balance models of perfect mixture with the
kinetic mechanisms of adsorption with superior orders is an opportunity to analyze the
equations terms and parameters that are relevant to the adsorption mechanism involved
with the separation processes.
In this work different configurations of adsorption mechanisms combined with mixture
mass balance models of the chromatographic columns are analyzed to determine the
influence of the equation terms and parameters on the dynamic and equilibrium behavior of
the separation processes.
2.1 Modeling approach
The modeling of the chromatographic separation process was based on the adsorption
kinetic mechanisms over a solid surface as represented in the Fig. 3.
From the Fig. 3 it can be observed that the adsorption phenomena can follow different
mechanisms, as verified from the cases (a) to (c).From it, the rate of consumption of solute A,
represented by (-r
A
), is determined by the following expression
12
() .
A
AS A
rkCCk
q
(5)
in which C
A
, C
S
and q
A
represent the concentration of solute in the liquid phase, the
concentration of active sites of the adsorbent and the concentration of solute A adsorbed in
the solid phase, respectively. The parameters α, β and γ represent the stoichiometric
coefficients of the adsorption mechanism (See Fig. 3 case (a)).
Heat and Mass Transfer – Modeling and Simulation
4
Fig. 3. Mechanisms of adsorption of solute (A) on the adsorbent surface
The active sites concentration are obtained by the mass balance in the adsorbent
()
smA
Cqq
(6)
with the parameter q
m
representing the maximum capacity of adsorption or the maximum
concentration of active sites on the surface of the adsorbent.
From the mass transfer of the solute A from the liquid phase to the solid phase can be
established that (-r
A
=r
SA
), where (-r
A
) and (r
SA
), represent the rate of consumption of the
solute A in the liquid phase and the rate of adsorption of the solute A on the solid surface,
respectively. Figure 4a presents the chromatographic column configuration assumed in the
modeling, in which C
A0
and C
A
represent the initial concentration of solute (A) at the
entrance of the column and the solute concentration at the column exit, respectively. Figure
4b presents a typical experimental curve of rupture or breakthrough curve for a
chromatographic system, which was adapted from the experimental work of Cruz (1997),
which studied the adsorption of insulin by the resin Accel Plus QMA.
(a) (b)
Fig. 4. (a) Representation of the chromatographic column modeled; (b) typical curve of
rupture or breakthrough (adapted from Cruz, 1997).
Modeling of Batch and Continuous Adsorption Systems by Kinetic Mechanisms
5
Applying the mass balances in the chromatography column, according to the column
configuration presented in Fig. 4, we obtain the following expressions for the mass balance
of the solute in the liquid phase,
0
. .
A
AAA
dC
VQCQCrV
dt
(7)
and in the solid phase,
.
A
SA
dq
VrV
dt
(8)
in which the parameters
, V and Q correspond to the porosity, the volume and the
volumetric flow, respectively. The first term of Eq. 7 corresponds to the accumulation, being
the second, third and fourth the terms of solute entering, the solute exiting and the
consumption rate, respectively. The accumulation term of the Eq. 7 is proportional to the
rate of solute adsorption. These expressions correspond to mass balance models of perfect
mixture, in which the solute concentration is the same in all the positions of the system.
Assuming
=1, for a practical consideration, and substituting the Eqs. 5-6 into the Eqs. 7 and
8 we obtain
101 1 2
[ ().]
A
AAAmA A
dC
cC cC kC q q kq
dt
(9)
12
( ) .
A
AmA A
dq
kC q q kq
dt
(10)
In which the parameter c
1
is equals to Q/V.
The system of Eqs. 9 and 10, which represents, respectively, the mass balance of solute in the
liquid and solid phase, was solved numerically, applying a routine according to the 4th order
Runge-Kutta method (time step of 10-4) for different considerations of the separation process.
2.2 Results and discussion
2.2.1 Analysis of the separation process only by adsorption
In a first step the calculations were done assuming only the adsorption term of Eqs. 9 and
10, i.e. not considering the desorption term (k
2
=0). The stoichiometric coefficients were also
considered equal to the unit (α=β=1). For the above considerations Eqs. 9 and 10 are
transformed into
101 1
()
A
AAAmA
dC
cC cC kC q q
dt
(11)
1
( )
A
Am A
dq
kC q q
dt
(12)
Figure 5 presents the simulation results of the numerical solutions of the previous system
of ordinary differential equations (Eqs. 11 and 12). From Fig. 5 it can be observed that the
solute concentration in the liquid phase (C
A
) presented a different behavior if compared to
the concentration of solute adsorbed in the solid phase (q
A
). The solute concentration (C
A
)
Heat and Mass Transfer – Modeling and Simulation
6
showed a behavior similar to that for the chromatographic systems as can be verified by
the typical result of the experimental curve in Fig. 4b. This characteristical aspect (“s”
profile) for the chromatographic answer is called the rupture or breakthrough curve.
From Fig. 5 it can also be seen that the concentration on the solid surface (q
A
) is almost
linear, presenting a significant variation at the same time as the inflexion point of the
breakthrough curve. Note that the solute adsorption (q
A
) is higher at initial times, leading
to a high consumption of the solute in the liquid phase (the later appearance of solute at
the column exit).
Fig. 5. Profiles of the solute concentration in the liquid (C
A
) and solid phase (q
A
)
Simulation results with a similar behavior as that obtained in Fig. 4b were obtained from
conditions in which either the maximum capacity of adsorption (q
m
) was greater than the
initial concentration of solute at the entrance (C
A0
) and the kinetic constant of adsorption
was high. These parameters conditions led to higher values of the consumption term of
Eq. 11. This observation is coherent with the real processes of chromatographic separation,
which in general present high capacity of adsorption.
Figure 6 presents a result with the same behavior as that one observed in Fig. 4b. For this
case, the high adsorption rate is attributed to the high kinetic constant of adsorption. From
Fig. 6 it can be seen also the great variation of the solute concentration on the solid phase
(q
A
) at the same time of the inflexion point of the solute concentration in the liquid phase
(C
A
).
Simulation results showing the increase in the consumption rate of solute due to the
increase in the maximum capacity of adsorption (q
m
) are presented through the Fig. 7.
The rate of adsorption was increased increasing the capacity of adsorption of the
adsorbent from q
m=
10 mg/mL (Fig. 7a) to q
m=
40 mg/mL (Fig. 7b). From the case of low
adsorption capacity (Fig. 7a) it can be observed that the concentration of solute in the
solid phase increases slowly, allowing the appearance of solute in the liquid phase at
initial times. For a high capacity of adsorption (Fig. 7b), the concentration of solute in the
Modeling of Batch and Continuous Adsorption Systems by Kinetic Mechanisms
7
solid phase increases fast, allowing a latter appearance of solute at the column exit
(around 20 min).
Fig. 6. Profiles of C
A
and q
A
for a high value of the kinetic constant of adsorption
Fig. 7. Influence of q
m
in the profile of C
A
and q
A
2.2.2 Effects of the adsorption order
In this section, the effects of the stoichiometric coefficients or the order of adsorption on the
dynamic behavior were analyzed. From Eqs. 9 and 10 it was assumed, in a first case, only
the adsorption term (k
2
=0) with the following stoichiometric coefficients (α=1, β=5) which
lead to the next expressions
Heat and Mass Transfer – Modeling and Simulation
8
5
101 1
()
A
AAAmA
dC
cC cC kC q q
dt
(13)
5
1
( )
A
Am A
dq
kC q q
dt
(14)
A comparison is presented through Figs. 8a and 8b, which shows the simulation results
from the adsorption kinetic of first (α=1, β=1) and fifth (α=1, β=5) order, respectively,
with respect to the active sites concentration (solid phase). As can be seen from Fig. 8 the
increase in the adsorption order of the active sites increases the rate of adsorption, leading
to a steeper breakthrough curve. Another remark is the decrease in the capacity of
adsorption as the final concentration of solute A (q
A
) in the solid phase decreases. The
decrease in the final amount of solute adsorbed can be attributed to the number of active
sites that is necessary for the adsorption. From the adsorption kinetic of fifth order (α=1,
β=5) is necessary the presence of 5 (five) adsorption sites to interact and adsorb the solute.
At the end of the adsorption process the quantity of available sites is small and they must
be close to each other to promote the adsorption of the molecule (for example, by the
mechanism of fifth order, for five isolated sites it is not possible to have the adsorption of
one solute molecule). The condition of close sites becomes more important as the order of
adsorption increases, being necessary a higher quantity of close sites to promote the
adsorption of the molecule.
Fig. 8. Influence of the stoichiometric coefficients in the profile of C
A
and q
A
2.2.3 Analysis of the separation process by adsorption and desorption
In this part of the work, the desorption term of Eqs. 5 and 6 are considered, with the
stoichiometric coefficients equal to the unity (α, β and γ=1) Taking into account these
considerations Eqs. 9 and 10 are transformed into
101 1 2
().
A
A
AAmA A
dC
cC cC kC q q kq
dt
(15)
Modeling of Batch and Continuous Adsorption Systems by Kinetic Mechanisms
9
12
( ) .
A
Am A A
dq
kC q q kq
dt
(16)
The simulations from Eqs. 15 and 16 provided results with behavior equivalent to those
obtained by the previous condition without the desorption term.
The Fig. 9 shows the simulation results of the adsorbed phase (q
A
) varying the kinetic
constant of desorption (k
2
). From these results it can be observed that the higher the kinetic
constant of desorption the lower the real capacity of adsorption as the final amount of solute
adsorbed decreases. This information shows that although the adsorption can reach a
maximum capacity (q
m
), the real amount adsorbed will be determined by some parameters
like the kinetic constant of desorption (k
2
).
Fig. 9. Effect of the desorption parameter (k
2
) over the amount of solute adsorbed (q
A
)
Calculations using different adsorption and desorption orders were also performed,
showing a great influence of these parameters on the dynamic answer of the
chromatographic system. It is important to notice that higher values of the order of
desorption (γ>1) significantly decreases the final amount of solute adsorbed with the
increase in the kinetic constant of desorption (k
2
).
2.2.4 Protein chromatography by steps of adsorption and desorption
Simulations results obtained for a continuous feed for a time period into the protein
chromatography are shown in this part of the work. It is considered a flow of solute with a
specific concentration being introduced into the column over an initial period of time.
Figure 10 presents a typical result obtained with Eqs. 15 and 16, which correspond to a
system with a rate of solute adsorption and desorption, for a feed over a time period of 10
min. After the time of feed (10 min), the initial concentration of solute was considered null
(C
A0
=0), which led the system to decrease exponentially the solute concentration of the
liquid phase inside the column. Note that the concentration of solute adsorbed starts to
Heat and Mass Transfer – Modeling and Simulation
10
decrease after this point, although the kinetic constant of adsorption is higher than the
kinetic constant of desorption (the same parameters for the adsorption and desorption
steps). This is attributed to the solute concentration that becomes low, leading to a decrease
in the term of adsorption, which is not compensated by the high kinetic constant of
adsorption.
Fig. 10. Influence of feed in the steps of adsorption and desorption
A comparison between the simulation results and the experimental data from a
chromatographic procedure of protein separation is presented in Fig. 11. Figures 11a and
11b present the calculations and the experimental data from Silva (2000), respectively.
Fig. 11. Adsorption and desorption steps from simulation results (a) and experiments (b)