Human Musculoskeletal Biomechanics Part 8 doc
Bạn đang xem bản rút gọn của tài liệu. Xem và tải ngay bản đầy đủ của tài liệu tại đây (627.68 KB, 20 trang )
Cervical Spine Anthropometric and Finite Element Biomechanical Analysis
131
Static FE analyses focus on analysis of load response characteristics of cervical spine
segments. In an effort to represent the load response as accurately as possible, static FE
models are constructed with as much detail as possible. (Kallemeyn, Tadepalli and
Shivanna, 2009; Panzer and Cronin, 2009; Goel and Clausen, 1998; Ha, 2006). In contrast to
dynamic models, static models often focus on two to three vertebral bodies as opposed to
the complete cervical spine. These functional spinal units (FSU) can provide important
internal load and segment displacement data (Ng et al., 2003). Static analyses also allow for
corroboration of FE results with in vitro study load displacement results. Static analyses
have been used to analyze a variety of topics including spinal column biomechanics, soft
tissue effects on behavior, soft and hard tissue injuries, and even prosthetic disc
replacements (Zhang et al., 2006; Voo et al., 1997; Noailly et al., 2007; Ha, 2006; Galbusera et
al., 2008).
As stated, static element analyses lend themselves well to validation of cervical spine finite
element models. Validation of any finite element model is an extremely important process
the confirms that the model and assumptions there in, adequately represent that actual
physical spine. There have been in-vitro studies of the cervical spine and spine segments
that can act as comparison and validation cases for finite element studies (Moroney et al.,
1988; Panjabi et al., 2001; Richter et al., 2000). In order to use an in-vitro study as a
comparison case, test conditions including loading and constraints must be equivalent. This
does not however limit the loading cases applied to finite element studies to those already
employed in-vitro. By verifying a study under known in-vitro conditions investigators can
assume the response of the finite element model is valid for a certain range then continue to
test different scenarios (Ng et al., 2003). The following summary table, Table 21, provides
study types, load conditions and validation methods employed.
Author Year Study Type Spine Levels Loading BC Validation
Li et al. (Li and
Lewis, 2010)
2010 Static Surgery All Segment 0.33 - 2 Nm
Flexion
Extension
Lateral Bending
Axial Rotation
1 Nm + 73.6
Compression
Inferior
Endplate
Fully Fixed
Panjabi et al.
2001
Wheeldon et
al. 2006
Kallemeyn et al.
(Kallemeyn,
Tadepalli and
Shivanna, 2009)
2009 Static
Biomechanics
2 Segment 1 Nm Flexion
Extension
Lateral Bending
Axial Rotation
+ 73.6 N
Compression
600 N
Compression
Inferior
Endplate
Fully Fixed
(Moroney et
al., 1988;
Traynelis et
al., 1993;
Pintar et al.,
1995)
Panzer et al.
(Panzer and
Cronin, 2009)
Static
Biomechanics
2 Segment 0.3 – 3.5 Nm
Flexion
Extension
Lateral Bending
Axial Rotation
Inferior
Endplate
Fully Fixed
Goel et al.
1988
Voo et al. 1997
Maurel et al.
1997
Moroney et al.
1998
Human Musculoskeletal Biomechanics
132
Author Year Study Type Spine Levels Loading BC Validation
Galbuseara et al.
(Galbusera et al.,
2008)
2008 Static
Prosthesis
4 Segment 2.5 Nm
Flexion
Extension +
100 N
Compression
Inferior
Endplate
Fully Fixed
In-vitro
(Wheeldon et
al., 2006)
Greaves et al.
(Greaves, Gadala
and Oxland, 2008)
Static Injury 3 Segment Injury based
deflection
Injury
based
In-vivo
Hung et al.
1979
Maiman et al.
1989
Wheeldon et al.
(Wheeldon et al.,
2008)
Static
Biomechanics
4 Segment 0 – 2 Nm
Flexion
Extension
Axial Rotation
Inferior
Endplate
Fully Fixed
Gilad &
Nissan 1986
Panjabi et al.
1991
Teo et al. (Teo et
al., 2007)
Static Mesh
Generation
7 Segment N/A Inferior
Endplate
Fully Fixed
N/A
Ha (Ha, 2006) 2006 Static
Prosthesis
4 Segment 1 Nm
Flexion
Extension
Lateral Bending
Axial Rotation
Inferior
Endplate
Fully Fixed
Moroney et al.
1991
Pelker et al.
1987
Goel et al.
1998
Teo & Ng et
al. 2001
Zhang et al.
(Zhang et al., 2006)
Static
Biomechanics
8 Segment 1 Nm
Flexion
Extension
Lateral Bending
Axial Rotation
50 N
Compression
Inferior
Endplate
Fully
Fixed
Goel et al.
1984 Moroney
et al. 1988
Goel &
Clausen 1998
Panjabi et al.
2001
Haghpanahi &
Mapar
(Haghpanahi,
2006)
Static
Biomechanics
5 Segment 1.8 Nm
Flexion
Extension
Inferior
Endplate
Fully
Fixed
Lopez-Espinea
(FEA) 2004
Goel et al.
Voo et al.
Maurel et al.
Moroney et al.
Esat et al. (Esat,
2005)
2005 Dynamic
Biomechanics
3 Segment 1.6 Nm
Flexion
Extension
73.6 N
Compression
Inferior
Endplate
Fully
Fixed
Shea et al.
1991
Brolin et al. (Brolin
and Halldin, 2004)
2004 Static
Biomechanics
2 Segment 1.5, 10 Nm
Flexion
Extension
Lateral Bending
Axial Rotation
1500 N
Tension
Inferior
Endplate
Fully
Fixed
Panjabi et al.
1991
Panjabi et al.
1991
Van et al.
2000
Goel et al.
1990
Cervical Spine Anthropometric and Finite Element Biomechanical Analysis
133
Author Year Study Type Spine Levels Loading BC Validation
Ng et al. (Ng et al.,
2003)
2003 Static
Injury
3 Segment 1.8 Nm
Flexion
Extension
Lateral Bending
Axial Rotation
73.6 N
Compression
Inferior
Endplate
Fully
Fixed
Shea et al.
1991 Moroney
et al. 1988
Pelker et al.
1991 Maurel et
al. 1997 Goel
et al. 1998
Bozkus et al.
(Bozkus et al.,
2001)
2001 Static
Injury
1 Segment 200 – 1200 N
Compression
Inferior
Endplate
Fully
Fixed
Cadaver Study
Teo et al. (Teo and
Ng, 2001)
Static
Biomechanics
3 Segment 1 mm
Axial
Displacement
Inferior
Endplate
Fully
Fixed
Shea et al.
1991
Yoganandan
et al. 1996
(FEA)
Graham et al.
(Graham et al.,
2000)
2000 Static
Injury
1 Segment 1279, 1736 N
Compression
Inferior
Endplate
Fully
Fixed
Doherty et al
1993
Kumaresan et al.
(Kumaresan et al.,
2000)
Static
Biomechanics
3 Segment 0.5 Nm
Flexion
Extension
200 N
Compression
Inferior
Endplate
Fully
Fixed
FEA
Kumaresan et
al. 1997
Zheng et al.
(Zheng, Young-
Hing and Watson,
2000)
Static
Surgery
5 Segment 196 N
Compression
Injury
Case
Dependent
Kumaresan et al.
(Kumaresan et al.,
1999)
1999 Static
Biomechanics
3 Segment 0.5 – 1.8 Nm
Flexion
Extension
Lateral Bending
Axial
Rotation
Inferior
Endplate
Fully
Fixed
Cadaver Study
Pintar et al.
1995
Kumaresan et al.
(Kumaresan,
Yoganandan and
Pintar, 1999)
Static
Biomechanics
3 Segment 1.8 Nm
Flexion
Extension
Lateral Bending
Axial Rotation
125 – 800 N
Compression
Inferior
Endplate
Fully
Fixed
Moroney et al.
1988
Goel et al. (Goel
and Clausen, 1998)
1998 Static
Biomechanics
2 Segment 1.8 Nm
Flexion
Extension
Lateral Bending
Axial Rotation
73.5 N
Compression
Inferior
Endplate
Fully
Fixed
Moroney et al.
1988
Clausen et al.
1996
Goel et al.
1988
Teo et al.
(FEA) 1994
Human Musculoskeletal Biomechanics
134
Author Year Study Type Spine Levels Loading BC Validation
Kumaresan et al.
(Kumaresan et al.,
1998)
Static
Biomechanics
2 Segment Flexion
Extension
Lateral Bending
Compression
Inferior
Endplate
Fully
Fixed
N/A
Maurel et al.
(Maurel, Lavaste
and Skalli, 1997)
1997 Static
Biomechanics
5 Segment 0 – 1.6 Nm
Flexion
Extension
Lateral Bending
Axial Rotation
6 N
Compression
Inferior
Endplate
Fully
Fixed
Cressend 1992
Panjabi et al.
1986
Wen 1993
Wen et al.
1993
Moroney et al.
1984,
1998
Voo et al. (Voo et
al., 1997)
Static
Surgery
3 Segment 1.8 Nm
Flexion
Extension
Lateral Bending
Axial
Rotation
Inferior
Endplate
Fully
Fixed
Liu et al. 1982
Moroney et al.
1988
Yoganandan et al.
(Yoganandan et
al., 1996)
1996 Static
Biomechanics
3 Segment 1 mm
Compression
Inferior
Endplate
Fully
Fixed
Shea et al.
1991
Bozic et al. 1994
(Bozic et al., 1994)
1994 Static
Injury
1 Segment 3400 N
Compression
Inferior
Endplate
Fixed by
Spring
Table 21. Cervical Spine Finite Element Modeling Summary Table
The study by Esat et al. (Esat, 2005) combines both static and dynamic analysis methods.
The investigators aimed to simulate the response of the head and neck system under frontal
and rear impact scenarios. A multi-body dynamic head and neck computational model was
developed and validated using human volunteer experimental data. The investigators take
the analysis further by developing a finite element model of the cervical spine and
intervertebral discs. The finite element model was used to study the response of the
intervertebral discs to the dynamic load cases (Esat, 2005). The study illustrates the
flexibility of employing the finite element method in the analysis of the cervical spine. A
study by Sung Kyu Ha employed a finite element model of the cervical spine to study the
effects of spinal fusion and the implantation of a prosthetic disc on spine behavior (Ha,
2006). Spinal fusion was modeled by applying a graft with material properties of the cortical
bone between adjacent vertebral segments. The disc prosthesis was modeled by replacing
the entire intervertebral disc with an elastomer core. Efforts were made to select an
elastomer core with similar properties to that of the intervertebral disc. The analysis results
showed that spinal fusion led to a 50 – 70% reduction in range of motion for the fused spinal
segment. The introduction of a prosthetic disc did not change the range of motion seen in
the motion segment (Ha, 2006). Using a validated finite element model of the cervical spine,
the study was able to help predict the effect of two interventions that are often employed in
spinal injury cases.
Cervical Spine Anthropometric and Finite Element Biomechanical Analysis
135
2.3 Hard tissue modeling
As stated, the accuracy of an FE model at representing the cervical spine anatomy is of
extreme importance. There are two prominent modeling methods in the development of
cervical spine vertebral body models. Multi axis digitizers can be used to map points along
the vertebral bodies. The data set of points can then be used to create a model via a
computer aided drafting package. This approach can be applied to the development of two
dimensional (2D) and three dimensional (3D) models (Zhang et al., 2006; Esat, 2005;
Haghpanahi, 2006; Panzer and Cronin, 2009). Haghpanahi et al. used the data point
approach to create a parameterized 2D model of the C3 – C7 vertebral model. Intervertebral
discs were modeled in relation to adjacent vertebral pairs (Haghpanahi, 2006).
Digitizing the surface geometry of cervical spine segments is somewhat limited by the
number of points plotted. A look at the vertebral segment by Haghpanahi shows that
surfaces are somewhat linear. The vertebral endplates and posterior elements are
represented by straight line segments which do not convey the actual curvature and
undulations of the vertebra. An alternative hard tissue modeling approach is to use
computed tomography (CT) scan data. The process involves digitizing CT scans and using
the data to create a vertebral model. In a study by Yoganandan et al., investigators used
NIH-Image and an edge detection algorithm they developed to process the CT scans of the
spine. The data extracted from NIH-Image provided edge locations for the vertebral bodies
which were used to create wire frames of each vertebral body (Yoganandan et al., 1997). A
decade later, a study by Sung Kyu Ha used the Amira image processing software to digitize
CT scans, with 3D models and meshes generated in RapidForm and Ansys respectively (Ha,
2006). Though the two methods both yielded anatomically correct vertebral models, the
process employed by Ha involved much less manual tasks and offered a higher level of
refinement.
Regardless of the methods employed to develop the 3D model of the vertebral bodies, for
the purposes of finite element analysis, a finite element mesh of the part must be developed.
Element selection is of paramount importance in developing any finite element mesh.
Element selection is dependent on several factors including, the type of analysis to be
performed, and the geometry of the body to be meshed to name a few. Cervical spine
vertebral bodies can be adequately meshed with 4 noded solid tetrahedral elements;
however 8 noded hexahedral elements are preferred (Bozkus, 2001; Teo et al., 2007).
Vertebral bodies are made up of two bone regions, the cancellous core and cortical shell. The
cortical shell can be modeled as separate region of distinct thickness. The region can be
modeled with a separate set of solid or shell elements (Yoganandan, Kumaresan and Pintar,
2001). The final hard tissue areas that must be considered during modeling are the vertebral
body facet joints. The facet joints play an important role in stabilizing and constraining the
motion of adjacent vertebral bodies. There are a myriad of modeling methods employed in
approximating facet joints and their behavior. A summary of mesh methods employed in
vertebral body modeling is provided in Table 22.
Author Year Source Cancellous Cortical Facet Joints
Yuan et al. (Li and Lewis, 2010) 2010 CT 4 node
tetrahedral
3 node shell
element
Human Musculoskeletal Biomechanics
136
Author Year Source Cancellous Cortical Facet Joints
Kallemeyn et al. (Kallemeyn,
Tadepalli and Shivanna, 2009)
2009 CT 8 node
hexahedral
8 node
hexahedral
Pressure over
closure
relationship
Panzer et al. (Panzer and Cronin,
2009)
CAD 3D hexahedral 2D
quadrilateral
Squeeze film
bearing
relationship
Galbuseara et al. (Galbusera et al.,
2008)
2008 CT 8 node
hexahedral
8 node
hexahedral
Frictionless
surface-based
contact
Greaves et al. (Greaves, Gadala and
Oxland, 2008)
CT 8 node brick 8 node brick
Wheeldon et al. (Wheeldon et al.,
2008)
CT Solid Solid Solid / fluid
hydraulic
incompressibl
e
Teo et al. (Teo et al., 2007)
CT Hexahedral
Tetrahedral
Hexahedral
Tetrahedral
Ha (Ha, 2006) 2006 CT 20 node brick 8 node shell Non-linear
contact
element
Zhang et al. (Zhang et al., 2006) CAD 8 node brick 8 node brick Surface to
surface
contact
Haghpanahi & Mapar
(Haghpanahi, 2006)
CAD solid solid
Esat et al. (Esat, 2005) CAD 8 node brick 8 node brick
Brolin et al.
(Brolin and Halldin, 2004)
2004 CT 8 node brick 4 node shell Sliding
contact with
friction
Ng et al. (Ng et al., 2003) 2003 CAD 8 node solid 8 node solid Nonlinear
contact
Bozkus et al. (Bozkus et al., 2001) 2001 CT Solid / 4 node
tetrahedral
Teo et al. (Teo and Ng, 2001) CAD 8 node solid
Graham et al. (Graham et al., 2000) 2000 CT tetrahedral Tetrahedral
thin shell
Kumaresan et al. (Kumaresan et al.,
2000)
CT 8 node brick 8 node brick 8 node, fluid,
membrane
elements
Zheng et al. (Zheng, Young-Hing
and Watson, 2000)
CT 10 node
tetrahedral
10 node
tetrahedral
Kumaresan et al. (Kumaresan et al.,
1999)
1999 CT 8 node brick 8 node brick 8 node,
fluid,
membrane
elements
Cervical Spine Anthropometric and Finite Element Biomechanical Analysis
137
Author Year Source Cancellous Cortical Facet Joints
Kumaresan et al. (Kumaresan,
Yoganandan and Pintar, 1999)
CT 8 node brick 8 node brick 8 node, fluid,
membrane
elements
Goel et al. (Goel and Clausen, 1998) 1998 CT 8 node brick 8 node brick
Kumaresan et al. (Kumaresan et al.,
1998)
CT 8 node brick 8 node brick 8 node, fluid,
membrane
elements
Maurel et al. (Maurel, Lavaste and
Skalli, 1997)
1997 CT 8 node 8 node Gap element
Voo et al. (Voo et al., 1997) CT 8 node solid thin shell
Yoganandan et al. 1996 CT 8 node solid thins shell
Bozic et al. 1994 (Bozic et al., 1994) 1994 CT 8 node solid 8 node solid
Table 22. Cervical Spine Vertebral Modeling Methods
2.4 Intervertebral disc modeling
Intervertebral discs (IVD) are extremely important to the behavior of the spine.
Intervertebral discs act as dampers responding to compressive forces within the spine
(Yoganandan, Kumaresan and Pintar, 2001). Discs are made up of two distinct regions, the
outer annulus fibrosus ring, and an inner nucleus pulposus core (Ha, 2006). Both regions are
largely fluid based. The annulus fibrosus is made up of collagen fibers embedded in an
extracellular matrix composed of water and elastin fibers. Collagen fibers are arranged as a
structure of rings throughout the annulus region. Fibers are oriented between 25° and 45°
with respect to the horizontal plane. Collagen fibers provide primary stiffness to the
annulus region (Ambard and Cherblanc, 2009; Noailly, Lacoix and Planell, 2005). Discs
interact with adjacent vertebral bodies via the cartilaginous endplates.
Considerations must be made to accurately model IVD behavior. Modeling IVD must be
approached in a different manner than the vertebral bodies as CT scans do not provide soft
tissue data. Cryomicrotomy images can be used as an alternative to fill in the missing soft
tissue data (Yoganandan, Kumaresan and Pintar, 2001; Voo et al., 1997). An alternative to
employing cryomicrotomy is to model intervertebral discs in reference to their interaction
with related solid bodies (Yoganandan, Kumaresan and Pintar, 2001). An advantage of IVD
modeling is their relative simple geometry in comparison with vertebral bodies. An IVD can
be modeled with a CAD package as a cylindrical disc (Meakin and Huskins, 2001). For finite
element analysis purposes the intervertebral disc annulus is often modeled as a fiber
reinforced composite. Solid brick elements will be reinforced by a fiber or rebar element
matrix of alternating angular orientation. The reinforcing fibers often employ a nonlinear
response behavior unique to that of the solid annuls elements they are suspended within.
The nucleus has been modeled as an incompressible fluid (Eberlein, Holzapfel and Froelich,
2004). This approach can involve modeling the nucleus with specific incompressible fluid
elements. Though ideal, this approach presents a level of complexity that cannot be attained
in all studies. The alternative involves applying general modulus and poison’s ratio to the
nucleus region (Ha, 2006) Table 23. summarizes finite element modeling approaches
employed for the IVD.
Human Musculoskeletal Biomechanics
138
Author Year Disc Components Elements
Li et al. (Li and Lewis, 2010) 2010 Annulus fibrosus
Nucleus pulposus
8 node brick
4 node tetrahedral
Kallemeyn et al. (Kallemeyn, Tadepalli and
Shivanna, 2009)
2009 Annulus fibrosus
Nucleus pulposus
8 node tetrahedral
Hydrostatic fluid
Panzer et al. (Panzer and Cronin, 2009) Annulus fibrosus
Nucleus pulposus
Hexahedral element
Incompressible element
Galbuseara et al. (Galbusera et al., 2008) 2008 Annulus fibrosus
Nucleus pulposus
Hexahedral element
Tension only truss
Wheeldon et al. (Wheeldon et al., 2008) Annulus fibrosus
Nucleus pulposus
Solid element
Rebar element
Incompressible fluid
Palomar et al. (Palomar, Calvo and Doblare,
2008)
Annulus fibrosus
Nucleus pulposus
Solid element
Linear tetrahedral
Incompressible fluid
Schmidt et al. (Schmidt, 2007) 2007 Annulus fibrosus
Nucleus pulposus
8 node solid element
3D spring element
Incompressible Hyper
elastic
Ha (Ha, 2006) 2006 Annulus fibrosus
Nucleus pulposus
20 node solid element
Tension only spar
Zhang et al. (Zhang et al., 2006) Annulus fibrosus
Nucleus pulposus
8 node brick
Eberlin et al. (Eberlein, Holzapfel and Froelich,
2004)
2004 Annulus fibrosus
Nucleus pulposus
8 & 20 node hexahedral
Incompressible fluid
Meakin et al. (Meakin and Huskins, 2001) 2001 Annulus fibrosus
Nucleus pulposus
Solid element
Fluid element
Kumaresan et al. (Kumaresan et al., 2000) 2000 Annulus fibrosus
Nucleus pulposus
8 node solid
Tension only rebar
3D fluid element
Kumaresan et al. (Kumaresan et al., 1999) 1999 Annulus fibrosus
Nucleus pulposus
8nnode solid
Rebar element
ncompressible fluid
Maurel et al. (Maurel, Lavaste and Skalli, 1997) 1997 Annulus fibrosus
Nucleus pulposus
8 node element
Cable element
Voo et al. (Voo et al., 1997) Uniform disc
8 node element
Yoganandan et al. (Yoganandan et al., 1996) 1996 Uniform disc
8 node element
Bozic et al. 1994 (Bozic et al., 1994) 1994 Uniform disc
Springs element
Table 23. Cervical Spine Intervertebral Disc Modeling Methods
The IVD disc modeling summary table illustrates an acceptance of modeling the two distinct
regions, the nucleus pulposus and intervertebral disc. As stated, the approaches employed
do vary. In modeling the annulus fibrosus, the inclusion or exclusion of the fiber reinforcing
matrix is a key modeling point. A study by Palomar (Palomar, Calvo and Doblare, 2008)
illustrates the level of detail that can be employed in modeling the annulus fibrosus fiber
matrix. The authors used in-vitro data sourced from a specific analysis of the tensile
behavior of multiple layers of annulus under very slow strain (Ebara et al., 1996). The data
Cervical Spine Anthropometric and Finite Element Biomechanical Analysis
139
was used to adjust material properties of a strain energy function developed for annulus
fibers (Holzapfel, 2000). The mathematical model was then implemented via a UMAT user
subroutine in the Abaqus finite element software package (Palomar, Calvo and Doblare,
2008). It is clear that this approach focused on developing a realistic intervertebral disc
model. The model allowed for greater understanding of internal stress response of the
intervertebral discs.
2.6 Cervical spine ligament modeling
Ligaments are the supportive connective structures of the spine. Ligaments of the spine
include the ligamentum flavum (LF), interspinous ligament (ISL), capsular ligament (CL)
and intertransverse (ITL) ligaments. This set of ligaments function to support individual
vertebra. The anterior longitudinal (ALL), posterior longitudinal (PLL), and the
supraspinous ligament (SSL) act as supports for series of vertebra (Yoganandan, Kumaresan
and Pintar, 2001). Spinal ligaments are often modeled based on knowledge of their
anatomical makeup, locations, and relation to vertebra and intervertebral discs as they are
not represented in CT images. There is data available providing ligament cross sectional
area, length, and mechanical behavior. For finite element purposes, ligaments are most often
represented as non linear tension only entities. Spring, cable, truss, and tension only
elements have all been employed in the modeling of ligaments (Yoganandan, Kumaresan
and Pintar, 2001). A summary of some ligament modeling techniques applied is provided in
Table 24.
Author Year Ligaments Behavior Elements
Li et al. (Li and Lewis, 2010) 2010 ALL, PLL, CL, LF, ISL, TL,
APL
Nonlinear Tension-only
spar
Kallemeyn et al. (Kallemeyn,
Tadepalli and Shivanna, 2009)
2009 ALL, PLL, CL, LF, ISL Nonlinear 2 node truss
Panzer et al. (Panzer and
Cronin, 2009)
ALL, PLL, CL, LF, ISL Nonlinear 1D tension only
Galbuseara et al.
(Galbusera et al., 2008)
2008 ALL, PLL, CL, LF, ISL Nonlinear Spring element
Greaves et al. (Greaves, Gadala
and Oxland, 2008)
ALL, PLL, CL, LF, ISL Nonlinear 2 node link
Palomar et al. (Palomar, Calvo
and Doblare, 2008)
ALL, PLL, YL, ISL, ITL Nonlinear Tension only
truss
Wheeldon et al. (Wheeldon et
al., 2008)
ALL, PLL, LF, CL, ISL Nonlinear Spring element
Schmidt et al.
(Schmidt, 2007)
2007 ALL, PLL, CL, LF, ISL, SSL Force deflection
curve
Spring element
Ha (Ha, 2006) 2006 ALL, PLL, LF, ISL, CL Nonlinear Tension only
spar
Zhang et al.
(Zhang et al., 2006)
ALL, PLL, SSL, ISl, LF, CL,
AL, TL, NL, APL
Linear 2 node link
Brolin et al. (Brolin and
Halldin, 2004)
2004 ALL, PLL, TL, LF, CL, ISL Force deflection
curve
Tension only
spring
Eberlin et al.
(Eberlein, Holzapfel and
Froelich, 2004)
ALL, PLL, TL, LF, CL, ISL Nonlinear Membrane
element
Human Musculoskeletal Biomechanics
140
Author Year Ligaments Behavior Elements
Kumaresan et al. (Kumaresan
et al., 2000)
2000 ALL, PLL, CL, LF, ISL Nonlinear Tension only
element
Kumaresan et al. (Kumaresan,
Yoganandan and Pintar, 1999)
1999 ALL, PLL, CL, LF, ISL Nonlinear Tension only
element
Maurel et al. (Maurel, Lavaste
and Skalli, 1997)
1997 ALL, PLL, CL, Lf, ISl, SSL Nonlinear Tension only
cable element
Voo et al. (Voo et al., 1997) ALL, PLL, CL, LF, ISL Linear 2 node uniaxial
Yoganandan et al. 1996
(Yoganandan et al., 1996)
1996 N/A N/A N/A
Bozic et al. (Bozic et al., 1994) 1994 N/A N/A N/A
Table 24. Cervical Spine Ligament Modeling Methods
The summary table clearly illustrates that despite the difficulties of visualizing spinal
ligaments for modeling purposes; they are still included in most cervical spine finite element
models. It is also evident that the majority of investigators aim to capture the nonlinear
behavior of cervical spine ligaments. The degree to which ligament nonlinearity has been
captured does vary amongst studies. The use of finite elements with nonlinear
characteristics has been applied and deemed adequate (Ha, 2006). Non linearity can be
further implemented by employing strain dependent modulus of elasticity values to the
finite element model ligaments. Strain dependent moduli of elasticity are often sourced from
in vitro experimentation of cervical spine segments (Kallemeyn, Tadepalli and Shivanna,
2009; Yoganandan, Kumaresan and Pintar, 2000). Strain dependent moduli of elasticity
invariably add complexity to any mathematical analysis procedure. Additionally strain
limits are vary greatly depending on the in-vitro data sourced and are subject to variability
and questions of applicability to the current study. Despite the shortfalls it is clear from a
review of the literature that investigators are continually developing and applying
sophisticated modeling techniques to spinal ligaments.
2.7 Discussion
The review of cervical spine modeling techniques has illustrated the FEA can be a powerful
tool in the study of cervical spine behavior, injury, and treatment. There have been studies
the focus on finite element models of the as tools in the design of spine prostheses
(Galbusera et al., 2008; Ha, 2006; Meakin and Huskins, 2001). Ha et al. developed a multi
segment model of the cervical spine and continued to analyze its behavior with and without
an elastomer-type prosthetic disc. The study aimed to design the prosthetic disc that would
most closely reflect the behavior of the spinal unit with a disc present. The study found that
a disc with a modulus of 5.9 MPa would maintain biomechanical behavior of the complete
spine. The authors even note that the modulus value found could be achievable using
polyurethane. Determining a modulus value numerically provides a good basis for which to
start designing an IVD prosthesis that maintains biomechanical function (Ha, 2006).
Finite element analysis models have even begun to be applied to juvenile spinal models
including juvenile anatomical features such as joint plates (Wheeldon et al., 2008; Sairyo et
al., 2006; Sairyo et al., 2006). Models have also continued to better represent the spine not
only in geometry but in behavior. Studies have been undertaken to develop accurate
material and behavioral models based on extensive concurrent in-vitro testing (Yoganandan,
Kumaresan and Pintar, 2001; Eberlein, Holzapfel and Froelich, 2004).
Cervical Spine Anthropometric and Finite Element Biomechanical Analysis
141
In studying fracture in the atlas Teo et al. developed a single entity model of the atlas.
Material property data from the literature were employed and a series of load to failure FE
analyses were performed. The study predicted stress distributions along the atlas and
maximal loads. Though this data cannot be directly applied in a clinical sense, it can be
qualitatively applied to future in-vitro or mathematical modeling (Teo and Ng, 2001).
Models have progressed from going without ligaments (Yoganandan et al., 1996; Bozic et al.,
1994), to focusing specifically on calibrating ligament material properties (Brolin and
Halldin, 2004). Similar advances can be seen in IVD disc modeling which has gone from a
simple spacer of uniform material properties (Bozic et al., 1994) to highly advanced
nonlinear constitutive models of IVD behavior (Palomar, Calvo and Doblare, 2008). The
variation in study types and analysis methods underscore the effectiveness, and flexibility of
applying FE methods to the study of the cervical spine.
3.1 Finite element analysis of superior C3 cervical vertebra endplate and cancellous
core under static loads
Subsidence is a failure mechanism that can occur after implantation of an intra vertebral
implant device. Subsidence is clinically defined as the loss of postoperative intervertebral
disc height and has been shown to occur in as many as 77% of patients after fusion surgeries
(Choi and Sung, 2006). According to actuarial rates subsidence occurs at 63.4 and 70.7
percent at 12 and 16 weeks respectively (Choi and Sung, 2006). Occurrences of subsidence
could be due to bone failure, which may be attributed to compressive stresses, or a failure of
the implanted device specifically bone graft material (Jost et al., 1998). While a loss of height
is common, measuring it may be contentious. Identifying the edge of the device proves
difficult due to bone in-growth and the shadow of the apophyseal ring. Significant
subsidence has been defined differently for the lumbar and cervical regions of the spine.
Losses of disc height of 2mm in the lumbar spine and 3mm in the cervical spine have been
considered relevant benchmarks (Choi and Sung, 2006; Van Jonbergen et al., 2005; Kulkarni
et al., 2006). Another indication of subsidence is the change in lordic curve of the cervical
spine. Changes in angle between the endplates, at the surgical level in the case of fusion,
would indicate that the device is sinking into the vertebral bodies. Angle changes have been
measured at a lordic increase of 1.6 degrees postoperatively to a follow up lordic decrease of
2.5 degrees (Kulkarni et al., 2006). The reduction in angle indicates that either the anterior or
posterior part of the implanted device had subsided into the vertebral body. This failure is
also a localized failure that is initiated by high contact forces generated by implanted disc
devices.
Understanding the endplate morphology and biomechanics is crucial to the future success
rates of implanted devices. The previous section of this chapter talked extensively about the
type of data collected and measured. Several studies have been aimed at determining the
thickness, strength and density of the vertebral endplates of the cervical spine by directly
measuring cadaver specimens. The thickest regions are in the posterior region of the
superior endplate and the anterior region of the inferior endplate with the central region
being the thinnest area (Panjabi et al., 2001; Pitzen, 2004; Edwards et al., 2001). Mechanically
the thicker regions of the endplate are stronger than the thinner areas (Grant et al, 2001;
Oxland, 2003). Oxland showed that the thinner, middle lumbar region had a mean failure
load between approximately 60-100 N, and increased toward the endplate’s periphery,
thicker regions, to a load of approximately 175 N (Grant et al, 2001). Locations of thicker
endplate bone are indicative of other factors that affect the biomechanical quality of the
Human Musculoskeletal Biomechanics
142
endplate. Density scans of the endplate, as measured by peripheral quantitative computed
tomography (pQCT) scans, reveal that the endplate bone is denser in thicker regions
(Ordway et al., 2007). Results show that an increase in bone density from 150 to 375
mg/mm
3
equates to an approximate stiffness increase from 100 to 200 N/mm. These same
regions, which have a greater density and are thicker, also have an increased mineral
deposition than thinner regions of the cervical endplates (Muller-Gerbl et al., 2008; Panzer et
al., 2009). The increased mineral deposits were located in areas of the endplate that typically
have the highest indentation test results and therefore higher failure limits (Grant et al, 2001;
Oxland, 2003; Muller-Gerbl et al., 2008; Panzer et al., 2009).
Causes of subsidence can be modeled using finite element models. As previously discussed
finite element modeling allows the investigation of several parameters like stress strain and
deformations of irregularly shaped objects. The complex anatomical features previously
discussed can be modeled with finite element methods to create a theoretical model that can
be validated using experimental methods. This should increase the reproducibility of the
model in many different scenarios to analyze different aspects of the cervical spine, in this
case specifically the vertebral bodies. Frequently theoretical vertebral geometry is
constructed from anthropometric data (Polikeit et al., 2003; Denoziere and Ku, 2006). The
anthropometric data is typically compiled from measurements taken on a large sample
group of cadavers. Theoretical models usually assume geometric properties of parameters
that are difficult to measure directly and cost effectively, for example cortical shell thickness.
Experimental models built from CT’s also have material property limitations but are well
suited for replicating anthropometric geometry for a single user. In both cases some
assumptions need to be made concerning shell thicknesses. Several studies simplify the
cortical shell and endplates as a shell with constant or only a slight variation in the endplate.
The goal of the following study is to determine if an endplate thickness of a half-millimeter
is an adequate approximation for the vertebral endplate by comparing endplate stresses.
3.2 Methods
A 3-dimensional linear elastic model of the C3 vertebrae was constructed from CT images of
a 25-year old female that consisted of the vertebrae’s bony structure. MIMICS 13.0
(Materialise, Ann Arbor, Michigan, USA) was used to convert the CT images to a 3-D model.
The 3D model was smoothed and meshed using 3-Matic (Materialise, Ann Arbor, Michigan,
USA). From 3-Matic an orphan mesh was imported into Abaqus 6.9 (Simulia, Providence,
Rhode Island, USA) finite element design suite for post-processing. This experiment
considers the thickness of the superior vertebral endplate. The superior endplate was
modeled in four different ways, labeled Model 1 through Model 4. The first model, Model 1,
used half-millimeter thick shell elements as an approximation for the superior endplate.
Model 2 assumes the endplate has been completely removed. The removal was modeled by
the actual removal of the shell elements exposing the volume elements of the core. Model 3
had a superior endplate that is divided into three regions (Panjabi et al., 2001). Model 4 had
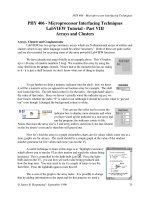
a superior endplate divided into seven regions (Pitzen et al., 2004). The thickness and region
distributions are presented in Figure 10.
The finite element model was constructed with 60697 tetrahedral elements and 13651 nodes.
The cortical shell was created with 4552 offset shell elements, less for the model with the
removed endplate. The shells of the inferior endplate and the radial cortical shell were set to
a half-millimeter thickness and used the same offset shell method. Figure 10 shows how the
endplates were sectioned. The cartilaginous endplate was not considered in this analysis
Cervical Spine Anthropometric and Finite Element Biomechanical Analysis
143
because it is often removed during surgery and does not contribute significantly to the
stiffness of the endplates (Polikeit et al., 2003(2)).
Assigned material properties have been previously well documented in literature and are
presented in Table 25.
Fig 10. Finite element models of the C3 vertebrae. Left image is Model 3 and the right is
Model 4. Below each model is the thickness of the endplate in each region. The thickness
regions of the endplate correspond to the colored regions below
Modulus of Elasticity (MPa) Poisson’s Ratio
Cortical Shell
1
10,000 .3
Cancellous Core
2
Ezz = 344, G1,2 = 63 .11
Eyy = 144, G1,3 = 53 .17
Exx = 100, G2,3 = 45 .23
Superior Endplate
3,4
1,000 .3
Inferior Endplate
3,4
1,000 .3
Posterior
Elements
3,4
3,500 .25
1 – Li and Lewis, 2010
2 - Rohlmann et al., 2006
3 – Polikeit
1
et al., 2003
4 – Polikeit
2
et al., 2003
Table 25. List of material properties applied to the finite element model. This list was
compiled from a large group of finite element studies
Human Musculoskeletal Biomechanics
144
Material properties were considered to be homogenous. This is not physiologically accurate.
The assumption was made that on the macro level the irregularities would be evenly
distributed throughout the material sections and represented by the assigned values. The
properties were made continuous from point to point and assigned in a hierarchical
structure, which separates different bone categories, i.e. cortical and cancellous, into
different material groups. This is clinically relevant since the material property definitions
simulate bone’s various material distributions and can be adapted to replicate disease or
injury. The entire vertebra was broken down into posterior elements, cancellous core, radial
cortical shell and the superior and inferior endplates. All elements were assigned linear
elastic element types. The cancellous core of the vertebral body was assumed to be
anisotropic. The axial direction is the strongest due to the difference in cortical bone
structure and alignment in the axial direction along lines of stress (Panjabi and White, 1990;
Boos and Aebi, 2008).
The models were statically loaded with an axial force of 1000 N and flexion and extension
moment of 7.5 Nmm. To avoid the concentration of stress from point loads a pressure
distribution was applied to the superior endplate. In this scenario, a higher stress peak
develops in the same direction as an applied moment. For example a flexion moment would
have a resultant distributed load with a compressive stress peak in the anterior region of the
vertebral body. The boundary conditions consisted of fixing the inferior endplate in
translation and rotation.
3.3 Results
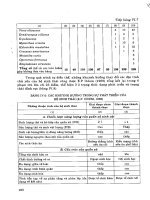
The results show that the endplate stresses are all approximately the same in magnitude and
location. The values of stress calculated in this analytical model are presented in the Table 26
and Figure 11.
Endplate
Flexion
(MPa)
Endplate
Extension
(Mpa)
Percent
Diff,
Model 1 vs.
Model 3,4
Core Stress
Flexion
(Mpa)
Core Stress
Extension
(Mpa)
Model 1 24.6 25.57 N/A 17.1 34.5
Model 2 N/A N/A N/A 74.8 38.2
Model 3 20.7 15.7 17.2, 47.8 13.12 8.5
Model 4 19.5 19.5 22.5, 26.9 20.5 30.14
Table 26. Max stress values in MPa in the core and the endplate from flexion, extension and
axial loading
The von Mises stresses range from a minimum of 15.7 MPa, Model 3 in extension, to a
maximum of 25.57 MPa, Model 1 in extension. These values are consistent with other
studies listed in Table 27. The endplate stresses are also well under the failure stress for
cortical bone. The cancellous core stresses are less consistent. A stress range of 8.5 MPa,
Model 3 in extension, to 34.5 MPa, Model 1 in extension, was recorded in cases with
endplates present. These values are greater than that of the listed failure stress for cancellous
bone of 4 MPa, but are in line with some of the previously modeled vertebra in Table 27. In
the models with the removed endplate, core stresses reach a maximum of 74.8 MPa, which is
much greater than the 4 MPa failure limit.
Cervical Spine Anthropometric and Finite Element Biomechanical Analysis
145
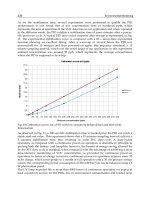
The von Mises stresses were also analyzed at various depths of the vertebral core. This was
done to examine how the stress propagated through the cancellous core. Measurements
were taken in 4 spots in the axial plane and at 4 different depths in the sagittal or coronal
plane for a total of 16 measurements. The locations of the stress chosen in the axial plane
were measured where the stress should have been highest in the cases of flexion and
extension. The first set of measurements was taken directly beneath the vertebral endplate.
The second set was taken at approximately 1/3 of the height of the vertebral body beneath
the superior endplate. The third set was measured at approximately 1/3 of the height of the
vertebral body above the inferior endplate. Partial results are presented in the Figure 12
with the complete set of figures in the appendix.
Fig. 11. Stress comparisons between models focusing on endplates and cancellous cores
Researcher Study Topic Loads
Max Endplate
Stress (MPa)
Max Core
Stress
(MPa)
Study
Level
Galbusera,
2008
Anterior
Cervical
Fusion
100 N Axial,
2.5 Nmm
Bending
2.80 N/A C5-C6
Denoziere,
2006
Fusion/Mobile
Disc
720-1300 N
Axial, 11.45
Nmm Axial
rotation
90 3.5 L3-L4
Polikeit,
2003
Fusion
1000 N Axial,
12 Nm m
Bending
Stress values recorded as
percentage increases
L2-L3
Human Musculoskeletal Biomechanics
146
Langrana,
2006
Curvature N/A 40 N/A L4-L5
Zhang, 2010
Bone Filling
Material
400 N Axial,
7.5/3.75
Nmm flex,
ext
9.503 .584 L1-L2
Zander, 2002
Bone Graft
Location with
Fixators
250 N Axial,
7.5 Nmm
flex, ext, lat
bend
25 N/A L2-L5
Dai, 1998 Osteoporosis
1200 N Axial,
30 Nmm flex,
ext
5.17 24.03 Lumbar
Adams, 2003 Fusion 1310 N Axial 25 N/A L5
Table 27. The first listed researcher and the emphasis of the study are in columns one and
two. The loading condition is in column three and the stress results in the core and endplate
are in columns four and five. The level of the spinal column modeled is in column six
Fig. 12. Each figure represents the cancellous core stress through the height of the vertebral
core. The entire chart is present in the appendix. Position 1 is posterior/right, Position 4 is
anterior/left. The X-axis represents the percentage of height from top down. The Y-axis is
the von Mises stress at each level
Cervical Spine Anthropometric and Finite Element Biomechanical Analysis
147
The stress results from this test were compared to studies conducted examining the stress in
the endplate and vertebral body, and the loads used to obtain these stresses. These results
are presented in Table 27. Direct comparisons are difficult because of the wide range of
loading conditions, vertebral levels, and different study conditions i.e. fusion, curvature and
bone grafts. The results of this study are however within these investigated ranges, which
suggest the model is representative of the C3 cervical level.
The differences in reported von Mises stresses can be attributed to different loading
conditions and boundary conditions among other things. Few studies go into detail about
exactly how loads are applied to finite element models or how the models are bounded.
Both factors can have large effects on the outcomes of stress maximums. Research has
shown that a stress of 4 MPa is the failure limit for trabecular bone and 131-224 for cortical
bone (Linde, 1994; Nigg and Herzog, 1994). These limits can be assumed as a benchmark for
the onset of bone failure in the endplates and cancellous core.
The stresses developed in this study indicate that a half-millimeter approximation for the
vertebral endplate is adequate. The half-millimeter approximation in Model 1 has a
maximum/minimum percent difference from the anthropometric models of 47.8% and
17.2% respectively (percent differences presented in Table 26). The stress generated in
Model 1 is also greater than the other models lending to a conservative design if these
values are used for mechanical design considerations. The ability to model the endplate
with a constant thickness saves time ultimately making the analysis more efficient.
While the endplate stresses were well under its failure limit of 133 MPa the maximum
cancellous core stresses in the Model 2 (removed endplate) were much greater than its
failure stress of 2 MPa. For example under flexion the core experienced a maximum stress of
74.8 MPa, which is approximately 35 times its failure limit. Subchondral failure was not
investigated in this study so its contribution to failure cannot be addresses at this time.
Von Mises values were also recorded through the height of the vertebral core to examine
stress propagation. For all cases the 2 MPa core failure stress was not reached except in the
case of Model 1, extension, in the posterior right region of the vertebral body where the
stress reached 3.98 MPa. This stress is slightly under the upper failure limit of 4 MPa. Table
4 shows average values for stress in each level of the vertebral body under each loading
condition: flexion or extension, while also ignoring Model 2 since it does not have an
endplate. Table 5 charts stresses associated with flexion and extension in either the posterior
or anterior areas of the vertebral core.
Height (as percentage from
bottom)
Average von Mises Stress
in Flexion (MPa)
Average von Mises Stress
in Extension (MPa)
100% .129 .900 (.620)
66% .180 .561
33% .229 .510
0% .054 .351
Table 28. Average stress propagation through the vertebral body in flexion and extension.
The number in parentheses is not considering the highest possibly outlying stress value
Human Musculoskeletal Biomechanics
148
Position Flexion Extension
1,2 .191 .691
3,4 .105 .467
Table 29. Average stress in the posterior or anterior areas of the vertebral body in flexion
and extension. The number in parentheses is not considering the highest possibly outlying
stress value
A general trend, in Figure 12, can be seen that the stress is increases towards the center of
the vertebral core. In the upper endplate under extension the trend does not hold even if the
highest stressed element is not considered. It’s likely that there is some load sharing
between the endplate and the vertebral core that redistributes load away from the core at
the top and bottom near the endplates. The middle the vertebral body seems sufficiently
removed from the endplates thus the higher reported stresses. Table 28 also indicates that
the posterior of the vertebral body is stressed higher than the anterior portion under both
flexion and extension.
3.4 Discussion
Removal of the cortical endplate has a significant effect on the cancellous core stress. Ideally
the endplate should be left intact as much as possible. From the evidence above the
minimum cancellous core stress was 38.2 MPa. This stress is almost 10 times that of failure
limit for cancellous bone using a upper failure limit.
This investigation only analyzes a pressure load that is evenly distributed on the vertebral
body. Unless a cage or artificial disc fits perfectly in the disc space with continuous contact,
stresses will greatly increase at areas of contact (Adam et al., 2003). Curvature is particularly
important in the cervical spine. Unlike the lumbar region that has large flat endplates the
cervical spine has a large curvature in the coronal plane that comes from the uncanate
processes (Bogduk and Mercer, 2006; Langrana et al., 2006).
The previous analysis shows that a half-millimeter endplate approximation can be used to
adequately represent the cortical endplate experimentally. When compared to
morphologically complex models the resulting half-millimeter endplate stress was 25.57
MPa and core stresses were 34.5 MPa similar to stresses in other research. It was found that
the vertebral body can be modeled analytically without experimentation and can use
simplified modeling parameters to save time and cost. Further understanding of regional
stress characteristics will be valuable for the design of implantable devices.
4. Appendix
Appendix. Each graph is a specific position in the axial plane of the vertebral body. Position
1 is posterior/right, Position 2 is posterior/left, Position 3 is anterior/right, Position 4 is
anterior/left. The X-axis on each chart is the height position in the vertebral body with 100
percent being just under the superior endplate. The Y-Axis is the resulting von Mises stress
in MPa.
Cervical Spine Anthropometric and Finite Element Biomechanical Analysis
149
Human Musculoskeletal Biomechanics
150