Hydrodynamics Natural Water Bodies Part 8 pot
Bạn đang xem bản rút gọn của tài liệu. Xem và tải ngay bản đầy đủ của tài liệu tại đây (4.58 MB, 25 trang )
Hydrodynamics – Natural Water Bodies
162
Indefinite tracks: where one set of particles was tracked for as long as they remained in
the reefal bay system - their paths plotted for every three hours they remained.
Hourly plotted tracks were used to predict the duration of a reef gyre. Three-hourly tracks
were plotted to capture the full horizontal extent of the circulation.
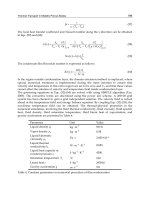
Fig. 3. Diagram of the reefal bay dimensions used in calculating the circulatory extent of the
bay. The extent (BC) is calculated as a fraction of the AC distance normal to a line (DE)
joining the land projections. AC is derived from an elliptical approximation of the outer,
seaward curve of the looping currents.
Extents were measured from these plots as a proportion of the linear distance, from the shore
to the elliptical arc, normal to a straight line joining the land projections at the ends of the bay
indentation (Figure 3). The ellipse best approximates the seaward edge of the gyre. The
elliptical major axis is always equal to or greater than the length of the straight line joining the
land projections. Therefore, the reef circulation lateral extension, L
c
, is given as the percentage:
100
c
BC
L
AB
(3)
Indefinite tracks allowed predictions of the retention ability of gyres. The number of
particles remaining around the reef was counted after each 3-hr track run.
5. Results
5.1 General current flow description based on field measurements
Results from fixed S4 current measurements in Wreck Bay (Figure 4) showed water flowing
through the channel generally exited in a south-south-eastward direction, with a deflection
southwards when current speeds were high.
Mean speed values for channel currents peaked at 22 cm s
-1
, and flow directions were
southward from 173° to 181°. On the western arm speeds averaged 28 cm s
-1
with a mean
flow direction of 102°, and on the eastern arm mean speed was 22 cm s
-1
with a flow
direction of 290°. Flow persisted southwards out through the channel from the back-reef
currents continuously, except during very rare occasions of in-flow at mid-depth when
velocities were at their lowest (mean of 2.9 cm s
-1
). Channel currents in Wreck Bay were
greatly influenced by the back-reef feeder currents, more than the direct influence of wind
and tides. Correlations of channel and back reef flow components showed that the western
arm current magnitude was almost five times more strongly correlated (cross correlation r =
The Hydrodynamic Modelling of Reefal Bays –
Placing Coral Reefs at the Center of Bay Circulation
163
0.62) than the eastern arm currents (cross correlation r = 0.18) with channel currents. The west
reef feeder currents therefore contributed much more to channel flow than the east reef.
Multiple regression values showed that the back-reef currents combined accounted for 47% of
the variability in the channel currents, compared to wind and tides accounting for 29%.
Fig. 4. Current component plots are shown for the east back-reef (a), the west back-reef (b)
and channel (c) of Wreck Bay, collected from long-term deployment of S4 current meters
moored at all three sites at the same time. This field data compared favorably with RMA
model results.
Accountability by winds and tides of the overall variability in the current magnitude
decreased from highs of 55-56% for the spring and winter data to 29% for the summer
currents. During this summer period the lowest recorded mean channel current speed (7.7
cm s
-1
) was observed as well as an equality of the relative contributions of tides and winds to
the overall variability.
5.2 RMA model simulations
5.2.1 Current flow
Velocity results from S4 current meters compared well with RMA model results (depth
averaged) for the dominant north (Y) component of the channel site at Wreck Bay (Figure 5),
giving no significance for difference by t-test. For the month of August (2000) , S4 north
component readings averaged -7.8 cm s
-1
while the RMA model averaged slightly lower at -
8.2 cm s
-1
(Table 2). The north component was used to represent the channel flow given its
high cross-correlation value of -0.99 with the channel flow magnitude.
Hydrodynamics – Natural Water Bodies
164
Depth-averaged velocity results from hydrodynamic modelling showed that currents
circulated the reef arms constantly. This circling of the reef was strongest during the combined
condition of a rising tide with prevalent sea-breeze (Figure 6). This particular condition
generated some of the strongest currents on the west reef of Wreck Bay (the 28 to 32 cm s
-1
category) and the corresponding south reef of Sand Hills Bay. Back reef current highs by the
model, however, were less than measured in the field. Field-measured monthly average for the
Wreck Bay east back reef current magnitude was 22 cm s
-1
and agrees with model averages,
however, the variation in flow is not replicated and spikes in back reef speeds (up to 38 cm s
-1
)
not captured. In Sand Hills Bay, model currents strongly circulated the south reef at up to 28
cm s
-1
on the southern curve of the gyre. Engine Head Bay showed no formation of looping
currents. The combination of a prevalent sea-breeze with falling tide strengthened the east reef
circulation in Wreck Bay (Figure 7). Horizontal current fields depicted velocities of up to 32 cm
s
-1
in this gyre, the fastest speeds occurring on the western side of the gyre. For Sand Hills Bay,
the north reef gyre was pronounced with a central inner gyre showing closed circulation.
Horizontal current fields depicted velocities of the 18 to 20 cm s
-1
category around the north
reef. Engine Head Bay again showed no formation of horizontal circulatory currents.
Fig. 5. RMA model and S4 field north component current data comparisons for the Wreck
Bay Channel area. A t-test reported no significance for difference when both current data
sets were input as independent samples (t = 1.46; p = 0.15).
Y-COMP VELOCITY RESULTS (cm s
-1
)
RMA Model Data S4 Field Data
Average:
-8.2 -7.8
Maximum:
-0.7 0.3
Minimum:
-24.5 -24.7
Range:
23.8 25.0
Table 2. RMA model and S4 field north component current data statistics and comparisons
for Wreck Bay Channel.
The Hydrodynamic Modelling of Reefal Bays –
Placing Coral Reefs at the Center of Bay Circulation
165
Fig. 6. Depth-averaged current field maps for (a) Wreck Bay and (b) Sand Hills Bay during a
dominant rising tide combined with sea-breeze regime. Current vectors depict well-formed,
closed looping circulation on the down-shore reef arm (circled), causing both bays to be
expanded beyond the reef.
Hydrodynamics – Natural Water Bodies
166
Fig. 7. Depth-averaged current field maps for (a) Wreck Bay and (b) Sand Hills Bay during a
dominant falling tide combined with sea-breeze regime. Current vectors depict well-formed,
closed looping circulation on the up-shore reef arm (circled), causing both bays to be
expanded beyond the reef.
The Hydrodynamic Modelling of Reefal Bays –
Placing Coral Reefs at the Center of Bay Circulation
167
5.2.2 Particle tracking and retention
Under only the rising tide regime, 19 % particles remained in Sand Hills Bay after 9 hrs. The
rising tide combined with land-breeze regime increased the remaining particles to 22 % after
9 hrs. When the sea-breeze dominated, however, combined with the rising tide the retention
dropped to 2 % in 9 hrs. Therefore particles were likely to remain trapped in Sand Hills Bay
the longest when introduced at the beginning of the rising tide cycle during a land-breeze
regime and were likely to be flushed out the quickest if introduced during the sea-breeze
with mid-falling tide.
Fig. 8. Reef gyre extension measurements for Wreck Bay and Sand Hills Bay during 18 hrs
(1.5 tidal cycles) of highest Y-component current speeds recorded in Wreck Bay. Tracks are
displayed as time progresses in 3-hr increments for new particles introduced into the bay
every three hours. Gyres undergo expansion and contraction but are always present.
Under only the falling tide regime, 36 % particles remained in Wreck Bay after 6 hrs. The
falling tide combined with land-breeze or sea-breeze regime decreased the remaining
particles to 6 % and 10 % respectively after 6 hrs. Therefore particles were likely to remain
trapped in Wreck Bay the longest if introduced at the beginning of the falling tide cycle and
were likely to be flushed out the quickest if introduced at the beginning of the rising tide.
5.3 Gyre extension assessment
Gyres expanded and contracted around reefs as the forcing conditions changed (Figure 8).
As the gyre on one reef arm strengthened the other weakened. Wreck Bay had its largest
extension (L
c
= 112 %) during the falling tide phase and when the sea-breeze emanated. The
largest extensions were produced by the east reef circulation and coincided with the greatest
current component speeds flowing out of the channel. This channel current formed the
Hydrodynamics – Natural Water Bodies
168
western edge of the east gyre. When the west reef circulation emanated, gyre extensions
were smaller and did not exceed 75 %. West reef gyres were most developed at low-to-rising
tide during land-breeze emanation and coincided with the lowest current component speeds
recorded in the channel at that time. The longest duration of this closed western gyre was
observed during 15 hrs of some of the smallest tidal changes recorded.
Sand Hills Bay had its largest extension at 198 % during the combination of a rising tide and
when the sea-breeze emanated. This was due to the south reef gyre that also tended to be
more closed than the north reef’s. The north reef gyre was most developed at the rising-to-
high tide (also when the sea-breeze emanated) and had its largest extension at 154 %. In the
absence of large tidal changes and developed wind regimes, the south gyre dominated the
extension.
6. Discussion
6.1 Circum-reef circulation defining the reefal bay
Hydrodynamic modelling showed that circulation around the Wreck Bay and Sand Hills
Bay reef parabola continuously looped the reef as circum-reef circulation (CRC). The CRC
was considered “closed” when fore-reef currents fed water back into the back-reef and
“open” when main fore-reef flow continued along-shore (Figure 9). Channel surge currents
were responsible for the propagation of inner bay waters seawards, and encouraged open
CRC. Tracking models revealed the longevity and spatial spread of this flow, simulating the
patterns first observed in these bays by field drogues and fixed measurements that depicted
continuous current flow around reef arms at surface and depth (Maxam & Webber, 2010).
The presence of the reef induced this persistence and localized the (CRC). The lack of reefs
in Engine head bay supported this premise as gyre formation and localization was not
evident in the non-reefal bay. This was confirmation that open bays did not facilitate
recycling of their inside waters from the outside as reefal bays do. In the absence of
prominent reef arms, the CRC cannot exist.
6.2 Reef arm crc dominance and cycling
Simulations of new particles introduced into the bay on an hourly basis revealed that under
particular tide and wind regimes, one reef’s circulation was strengthened while the other
abated in the same bay (Figures 10, 11). This simulated the dynamics that prevented field
drogues from entering the weaker reef gyre while trapped in the dominant one (Maxam &
Webber, 2010). The dominant gyre was responsible for the greatest extensions of the bay
system, and so the presence of two prominent reef arms resulted in regular switching of
dominance.
Full development of both reef arm gyres occurred in one tidal cycle. The reef gyre down-
stream the main long-shore flow appeared strengthened on the rising tide while the adjacent
reef up-shore was strengthened by the falling tide. It is important to note that these
simulations accurately portray the importance of the tidal influence in a micro-tidal
environment where it was otherwise expected to be overwhelmed by wind- and wave-
induced stresses. In the absence of large tidal fluctuations, as during a neap tide, the up-
shore gyre was too weak to be developed and the down-shore gyre dominated. Up-shore
reef arms were more reliant on tidal changes to effect gyre formation than down-shore reefs.
The sea-breeze aided in strengthening both gyres during simulation, agreeing with long-
term field data that showed this correlation (Maxam & Webber, 2010). This wind regime
The Hydrodynamic Modelling of Reefal Bays –
Placing Coral Reefs at the Center of Bay Circulation
169
Fig. 9. Diagrams depicting closed and open circum-reef circulation (CRC) simulated from
RMATRK discrete particle tracking modelling. The closed CRC displaying recirculation
were evident for Wreck Bay west reef (A) and east reef (B) arms, as well as Sand Hills Bay
south reef (C) and north reef (D) arms particularly during wind calms. Open CRC is also
displayed in Wreck Bay west reef (E) and east reef (F) arms, and again around Sand Hills
Bay south reef (G) and north reef (H) arms particularly during increased channel flow.
Hydrodynamics – Natural Water Bodies
170
induced more flow over the reef due to increased heights of waves impinging on the reef
and at higher frequencies (Roberts et al., 1992). Breaking would occur and the rapid energy
transferred caused an increase in water level, driving strong back-reef surge currents and
increasing current speeds in the northern part of the gyre. These surges, however, reduced
the retention times of these gyres.
This cycle of emanation and contraction is characteristic of the reefal bay system, giving the
reefal bay a spatial pulse that is dependent on prevailing wind and tidal regimes. The reefal
bay does not have a static bay area but instead will be at a minimum when the CRC is most
contracted and at a maximum when the CRC is most extended. At its minimal spatial extent,
the horizontal area of the hydrodynamic reefal bay is dependent on the size of the reef. The
larger reef in Wreck Bay, the east reef arm, gave the lager dominant gyre resulting in the
greater seaward extensions of the bay. The same was observed in Sand Hills Bay where the
south reef was the larger reef and therefore gave the greater extensions (Figure 12).
Fig. 10. Dominant east reef CRC in Wreck Bay due to large falling tide range is displayed in
A and B as circled area in model particle tracks (A) and model vectors (B). CRC formation
on the opposing reef arm is weakened during dominance of the other.
The Hydrodynamic Modelling of Reefal Bays –
Placing Coral Reefs at the Center of Bay Circulation
171
Fig. 11. Dominant west reef CRC in Wreck Bay is shown here typically occurring during
neap periods when bay extension was due primarily to wind and over-the-reef forcing. CRC
is displayed as circled area in model particle tracks (A) and model vectors (B). CRC
formation on the opposing reef arm is weakened during dominance of the other.
Hydrodynamics – Natural Water Bodies
172
Fig. 12. RMTRK Tracking model outputs depicting gyre dominance cycling in Wreck Bay
and Sand Hills Bay. Closed gyre formation is dominant on the down-shore reef during
rising tide regimes, abate at high tide, then re-form on the up-shore reef during falling tide.
The larger reef in both bays produced the larger dominant gyre resulting in the greater
seaward extensions of the bay. The east reef for Wreck Bay and the south reef at Sand Hills
Bay therefore expanded the bays the most.
6.3 Reef CRC persistence between paired reef arms
Persistence of one reef CRC over another was observed with the reef pairs and was
characteristic of one reef only, unlike reef dominance that alternated between reefs.
Persistence of a reef arm CRC occurred when, during conditions that caused the least
change in current flow, the CRC was continuously propagated on that reef. This was
observed during a combination of decreased over-the-reef flow and small changes in tidal
amplitude, when the Wreck Bay west reef arm and the Sand Hills Bay south reef arm
displayed continuous CRC while the other reef arms in the pair showed none, even during
changing tidal cycles. This persistence, along with the larger west reef flow, has led to the
west reef contributing more than the east reef overall to the channel flow in Wreck Bay.
6.4 Variability in retention
Sand Hills Bay retained particles longer than Wreck Bay in model simulations, with
retention controlled mostly by the dominant reef gyre. The dominant reef gyre is
maintained in Sand Hills Bay during the rising tide, while that of Wreck Bay is well-formed
during the falling tide. This presents the likelihood that waterbourne particles flushed out of
The Hydrodynamic Modelling of Reefal Bays –
Placing Coral Reefs at the Center of Bay Circulation
173
Kingston Harbour to the north during a flood event undergo retention along the Hellshire
shoreline all through the tidal cycle, particularly during wind clams, but alternating in these
reefal bays depending on the stage of the cycle prevailing. The longest retention time
derived from field data was 9 hrs (Maxam & Webber, 2010) and compares well with model
results that showed the longer retention of particles ranging from 6 to 9 hrs.
Simulations also show that CRC presence is characterized by increased fluctuations in the
retention of particles. Model simulations depicted that after 6 hrs, Wreck Bay and Sand Hills
Bay showed the greatest variation in number of particles remaining and Engine Head Bay
the least variation across all conditions. Therefore, those conditions that facilitated greater
particle retention in the reefal bays, particularly wind calms (Maxam & Webber, 2010),
significantly increased retention times over that of the open Engine Head Bay. The same is
true for those conditions that facilitated decreased particle retention in the reefal bays where
these were significantly lower than in the non-reefal bay.
Provided wind conditions did not dominate, Engine Head Bay produced similar retention
times as particles oscillated back and forth inside the bay arc with the change of the tidal
regime. This oscillation, however, did not extend outside the bay arc, unlike with the reefal
bays. Reefal bays therefore display the ability to not only trap particles throughout tidal
cycles, but also create a wider trapping area (extended seawards) than open bays along the
Hellshire shoreline.
CRC strengthening was therefore evident
i. with the closure of the looping circulation;
ii. in the increased recirculation rate of particles resulting from increased gyre current
speeds; and
iii. in the broad spatial extent of the CRC occupying a greater portion of the bay area.
Hence, the CRC is considered persistent because it continuously loops the reef, and is
strengthened when gyres are closed and it broadens horizontally. This closing re-
circulation demonstrates very well the connectivity and continuity of the channel outflow
re-entering the bay over the reef, and therefore best confirms the reef as the circulatory
centre of the bay. Model simulations did not produce a reversal in back-reef currents at
any time, evidence that the CRC is never completely reversed but instead may become
severely weakened, usually coinciding with very rare events of channel reversal at depth
(recorded by field instruments in Maxam & Webber, 2010). The functional bay is therefore
seen to exist around the reef such that the reef parabola are the center of the system.
Increased flow over the reef, especially during the sea-breeze regime, caused surges in
channel currents that would increase the speed of the current loop and result in faster
flushing times. Reefal bay flushing and retention regimes have direct implications on the
dynamics of vulnerable planktonic species important to reef establishment (Wolanksi &
Sarsenski, 1997), and the ability of these bays to draw in, retain and flush pollutants (Black
et al., 1990; Lasker & Kapela, 1997).
6.5 Bathymetric characteristics necessary for promoting CRC
The topography of the reefal bay allows it to produce signature dynamics driven primarily
by over-the-reef flow, wind and tidal forcings. Waves break over the reef and the generated
flow feed reef-parallel currents that in turn supply a major channel outflow. The channel
(Figure 13) features significantly in this system and its prominence is the main bathymetric
difference from other more popularly studied reef systems such as atolls, platform and
Hydrodynamics – Natural Water Bodies
174
ribbon reef. The channel in the reefal bay is the main conduit of back-reef water exiting to
the sea, and therefore sets up the hydrodynamics to produce jet currents that help complete
the circum-reef current. This CRC has been shown to either close in on itself , which is when
gyres are formed that cause particles to re-circulate on the reef, or to flow along the fore-reef
and join the general long-shore flow, causing particles to leave the system.
Fig. 13. Spatial 3D model of Wreck Bay (A) and Engine Head Bay (B) revealing their
differences in topography. In Wreck Bay, reef arms are emergent at high tide and the
deepest part of the system is its prominent channel. This is topographically more complex
than the open, non-reefal Engine Head Bay (spatial 3D Models are exaggerated vertically).
Bathymetric characterization includes the reef arms, where their presence localizes the CRC
and relative size becomes an important factor. The larger reef arm generates the more
expansive gyres and therefore greatest emanations of the bay. This geomorphology is
typical of many Caribbean reefal bays. By over-generalization, however, bays have been
classified geomorphologically by variations in their coastlines’ indented shape (Rea &
Komar, 1975; Silvester et al., 1980). This has been applied to systems for which the
circulation can be persistent or temporary. Gently-sloping shorelines, for example, exposed
to wave action may contain gyre circulations, similar to the CRC, that comprise a seaward
rip current diffusing beyond the breaker zone and returning landward as slow mass drift
under wave action (Carter 1988). Unlike the reefal-bay system, however, the stability of
these gyres is heavily dependent on high energy wave action and so rip features are hardly
permanent or in the same location. Ultimately, the bathymetry unique to these reefal-bay
systems is principal in forming and maintaining the CRC, as seen in the simulation of the
longer-lasting gyres when both the wind and tidal contributions are reduced.
6.6 Reliability of the hydrodynamic model
The hydrodynamic model used flow over-the-reef along a boundary line to simulate wave
breaking and captured the effects of shorter period wind-wave driven flow important in
driving channel currents. Current simulations in the channel were therefore in good
agreement with S4 field data and are considered most important in these models since they
form the main link in the CRC formation, in addition to being the direct driver of CRC
emanation and contraction. Simulations, however, fell short in capturing some effects
caused by the reef flat (Cetina-Heredia et al., 2008), and the contribution of longer period
swell, seiching and infra-gravity waves (Lugo-Fernandez et al., 1998; Pequignet, 2008). This
affected the back-reef outputs where currents were faster and less variable than simulated
by the RMA model. Results from the model, however, were sufficient for simulating the
The Hydrodynamic Modelling of Reefal Bays –
Placing Coral Reefs at the Center of Bay Circulation
175
bay circulation around the reef, revealing signature patterns, and deriving the contributions
of wind and tide regimes to driving gyre emanations.
7. Conclusion
The hydrodynamic modelling and tracking simulations were able to reproduce field
observations, allowing the following signatures to be developed for characterizing the reefal
bay system:
A characteristic bathymetry comprised of reef arms broken by prominent channel,
giving rise to a persistent circulation;
A reef-centered circulation driven by wind, tides and over-the-reef flow;
A reef-centered circulation that continuously looped the reef (circum-reef circulation or
CRC) to form either a closed gyre (closed CRC) or to flow along the fore-reef as open
loop (open CRC);
A CRC that was persistent because it is always present and localized;
A CRC with a spatial pulse indicated by cycles of expansion and contraction;
The dominance of the CRC alternating between reef arms and dictating which reef arm
was primarily responsible for bay extension;
The persistence of particularly one reef arm’s CRC regardless of the wind or tidal
regime.
These signatures are now identified with the reefal bay system, where the reef is shown to
be central to inducing the circum-reef circulation or CRC that encourages re-circulation of
inner bay waters, and that this CRC formation is not found in non-reefal bays, where there is
an absence of emergent reef between headlands. Driving forces such as wind, over-the-reef
flow and tidal changes were responsible for maintaining the CRC including its contractions
and emanations. These findings are important in their implications for stabilizing and
protecting these systems as well as the shoreline of which they are a part. Incorporating the
reef-parabola geomorphology as the centre of circulation gives predictability to other bay
features such as the physicochemical, geo-physical and biological dynamics, which are all
affected in greater part by local circulation. Many of these bays, for example, function as
nurseries for marine and terrestrial species where their planktonic stages are directly
influenced by current patterns and regimes. Identifying the CRC will aid in locating and
protecting habitats conducive to plankton viability and survival, including reef growth and
expansion.
8. Summary
Research on reefal bays revealed that inner bay waters exiting the channel between reefs re-
circulated into the back-reef, and that this circulation was localized and permanent around
reefs as the signature circulation. The distinctive topology of reef arms subtending the
headland and separated by a prominent channel induced particles to circulate the reef in
expanding and contracting gyres. Gyres expanded by as much as 98% of the horizontal
distribution, with expansion and contraction linked to cyclical wind and tidal regimes,
giving the reefal system a signature pulse in circulation. Strengthening of the circulation
around the reef resulted in closure of looping circulation, increased recirculation rate of
particles, increased gyre current speeds and broadening of the circulation’s spatial extent.
Hydrodynamics – Natural Water Bodies
176
One reef arm’s circulation would dominate over the other at the peaks of these cycles,
exhibiting gyre dominance. Increased variability of particle retention was also characteristic.
These signatures were not evident in an adjacent open, non-reefal bay used as a comparison.
The stability, spatial spread and localization of the circulation therefore defined this circum-
reef circulation and identifies its association with reefal bays in particular, where the reef
functions as the centre of a dynamic bay.
9. Acknowledgements
The authors are grateful to the Port Royal Marine Lab, the Center for Marine Sciences, the
Japan International Corporation Agency and the Mona Geoinformatics Institute for
providing funding, technical support and equipment to carry out this study. The
Environmental Foundation of Jamaica in partnership with the Life Sciences Department,
University of the West Indies, was significant in providing funding for training in
hydrodynamic modelling. We acknowledge Christopher Burgess for guidance in the
oceanographic statistics and modelling. Acknowledgement also goes to the dedication of
Sean Townsend and the many student volunteers from the Department of Life Sciences,
University of the West Indies, in assisting with the field work.
10. References
Black, K.P.; Gay, S.L. & Andrews, J.C. (1990). Residence times of neutrally-buoyant matter
such as larvae, sewage or nutrients on coral reefs. Coral Reefs 9: 105-114.
Burgess, P.; Irwin, M.; Maxam, A. & Townsend, S. (2005). Oceanographic Study of Sand
Hills Bay. Civil Environmental and Coastal Solutions Engineer’s Report to the
UDC, 79 pp, Kingston Jamaica.
Carter, R.W.G. (1988). Coastal Environments: an introduction to the physical, ecological and
cultural systems of coastlines. Academic Press. Great Britain.
Cetina-Heredia, P.; Connolly, S. & Herzfeld, M. (2008). Modeling larval retention around
reefs by local scale circulation features, Proceedings of the 11
th
International Coral Reef
Symposium, July, 2008, Florida.
Douillet, P.; Ouillon, S. & Cordier, E. (2001). A numerical model for fine suspended
sediment transport in the southwest lagoon of New Caledonia. Coral Reefs 20: 361-
372.
Feddersen, F. & Trowbridge, J. H. (2005). The effect of wave breaking on surf-zone
turbulence and alongshore currents: A modelling study. Journal of Physical
Oceanography. 35: 2187 – 2203.
Foreman, M.G.G. (1977). Manual for Tidal Heights Analysis and Prediction. Pacific Marine
Science Report 77-10, Institute of Ocean Sciences, Patricia Bay, Sidney, B.C., 58 pp.
Goodbody, I.; Bacon, P.; Greenaway, A.; Head, S.; Hendry, M. & Jupp, B. (1989). Caribbean
Coastal Management Study: The Hellshire Coast, St. Catherine, Jamaica. Marine
Science Unit Research Report no.1. Ed. I. Goodbody. University of the West Indies.
pp 176.
Gourlay, M.R. & Colleter, G. (2005). Wave-generated flow on coral reef – an analysis for
two-dimensional horizontal reef-tops with steep faces. Coastal Engineering. 52: 353 –
387.
The Hydrodynamic Modelling of Reefal Bays –
Placing Coral Reefs at the Center of Bay Circulation
177
Gunaratna, P.P.; Justesen, P. & Abeysirigunawardena, D.S. (1997). Mathematical modeling
of hydrodynamics in a reef protected coastal stretch. 2
nd
DHI Software User
Conference, Denmark. Paper C7-1.
Hasselmann, K.; Barnett, T. P.; Bouws, E.; Carlson, H.; Cart-wright, D. E.; Enke, K.; Ewing, J.
A.; Gienapp, H.; Hasselmann, D. E.; Kruseman, P.; Meerburg, A.; Muller, P.; Olbers,
D. J.; Richter, K.; Sell, W. & Walden, H. (1973). Measurements of wind-wave growth
and swell decay during the Joint North Sea Wave Project (JONSWAP),
Erganzungsheft zur Deutschen Hydrographischen Zeitschrift, Reihe A. 12. 95 pp,
Deutsches Hydrographisches Institut, Hamburg, Germany.
Hearn, C. J. (1999). Wave-breaking hydrodynamics within coral reef systems and the effect
of changing relative sea level. Journal of Geophysical Research, Series C 104, 30007 –
30019.
Hearn, C.J. (2001). Introduction to the special issue of Coral Reefs on “Coral Reef
Hydrodynamics”. Coral Reefs 20: 327-329.
Hendry, M.D. (1983). The influence of the sea-land breeze regime on beach erosion and
accretion : an example from Jamaica. Caribbean Geography, 1 (1), 13-23.
King, I.P. (2003). A finite element model for stratified flow; RMA-10 version 7.1B. 66 pp,
Resource Modelling Associates, Sydney, Australia.
King, I.P. (2005). A particle tracking model compatible with the RMA series of finite element
surface water models; RMATRK version 3.2, 19 pp, Resource Modelling Associates,
Sydney, Australia.
Kirby, J.T. & Dalrymple, R.A. (1991). User's Manual -Combined Refraction/Diffraction
Model: REF/DIF 1 Version 2.3. Center for Applied Coastal Research. University of
Delaware. Newark, Delaware.
Kraines, S.B.; Yanagi, T.; Isobe, M. & Komiyama, H. (1998). Wind-wave driven circulation on
the coral reef at Bora Bay, Miyako Island. Coral Reefs. 17: 133-143.
Lasker, H.R. & Kapela, W.J. Jr. (1997). Heterogeneous water flow and its effects on the
mixing and transport of gametes. Proceedings of the 8
th
International Coral Reef
Symposium. 2: 1109-1114.
Lugo-Fernandez, A.; Roberts, H.H. & Wiseman, W.J. (1998). Water level and currents of tidal
and infragravity periods at Tague Reef, St. Croix (USVI). Coral Reefs, 17 (4), 343-349.
Maxam, A.M. & Webber, D.F. (2009). Using the distribution of physicochemical variables to
portray reefal bay waters. Journal of Coastal Research, 25 (6), 1210-1221.
Maxam, A.M. & Webber, D.F. (2010). The influence of wind-driven currents on the
circulation and bay dynamics of a semi-enclosed reefal bay, Jamaica. Estuarine,
Coastal and Shelf Science, 87, 535-544.
Mellor, G.L. & Yamada, T. (1982). Development of a Turbulence Closure Model for
Geophysical Fluid Problems. Reviews of Geophysics and Space Physics, 20 (4), pp 851-
875.
Nwogu, O.; Demirbilek, Z. & Merrifield, M. (2008). Non-linear wave transformation over
shallow fringing reefs, Proceedings of the 11
th
International Coral Reef Symposium, July,
2008. Florida.
Nybakken, J.W. (1997). Marine Biology: An Ecological Approach, 4
th
ed. Addison-Wesley
Educational Publishers Inc.
Pequignet, A. (2008). Importance of infragravity band in the wave energy budget of a
fringing reef, Proceedings of the 11
th
International Coral Reef Symposium, July, 2008.
Florida.
Prager, E.J. (1991). Numerical simulation of circulation in a Caribbean-type back reef lagoon,
Coral Reefs, 10, 177-182.
Hydrodynamics – Natural Water Bodies
178
Rea, C.C. & Komar, P.D. (1975). Computer simulation models of a hooked beach’s shoreline
configuration. Journal of Sedimentology and Petrology 45: 866-872.
Roberts, H.H. (1980). Physical processes and sediment flux through reef-lagoon systems,
Proc 17
th
Int. Coastal Engineering Conf. , ASCE, Sydney, Australia, pp 946-962.
Roberts, H.H. & Suhayda, J.N. (1983). Wave-current interactions on a shallow reef. Coral
Reefs, 1, 209-214.
Roberts, H.H.; Lugo, A.; Carter, B. & Simms, M. (1988). Across reef flux and shallow
subsurface hydrology in modern coral reefs, Proceedings of the 6
th
International Coral
Reef Symposium, 2, 509-515. Townsville, Australia.
Roberts, H.H.; Wilson, P.A. & Lugo-Fernandez, A. (1992). Biologic and geologic responses to
physical processes: examples from modern reef systems of the Caribbean-Atlantic
region, Continental Shelf Research, 12 (7/8), 809-834.
Sammarco, P.W. & J.C. Andrews (1989). The Helix experiment: differential localised
dispersal and recruitment patterns in Great Barrier Reef corals, Limnolology and
Oceanography, 34, 898-914.
Silvester, R., Tsuchiya, Y., & Shibano, Y. (1980). Zeta bays, pocket beaches and headland
control. Proceedings in the 17th International Conference of Coastal Engineering., ASCE
2: 1306-1319.
Smith, N.P. (1985). The decomposition and simulation of the longitudinal circulation in a
coastal lagoon. Estuarine Coastal Shelf Science 21: 623-632.
Symonds, G.; Black, K.P. & Young, I.R. (1995). Wave driven flow over shallow reefs. Journal
of Geophysical Research 100 (C2): 2639-2648.
Tartinville, B.; Deleersnijder, E. & Rancher, J. (1997). The water residence time in the
Mururoa atoll lagoon: sensitivity analysis of a three-dimensional model. Coral Reefs
16: 193-203.
Van der Meer, J.W. (2002). Wave run-up and wave overtopping on dikes. (in Dutch; original
title: Golfoploop en golfoverslag bij dijken). WL Delft Hydraulics, Report
H2458/H3051, June 1997.
Webber, D.F. (1990). Phytoplankton populations of the coastal zone and nearshore waters of
Hellshire: St. Catherine, Jamaica. Ph.D. Thesis, 285 pp, University of the West
Indies, Mona.
White, M. (1982). Ground water lenses in Hellshire Hills (East), a minor source of water for
Hellshire Bay. Hydrology Consultants Ltd., Kingston MS Report. 34 pp.
Wolanski, E. & Sarsenski, J. (1997). Larvae dispersion in coral reefs and mangroves. American
Science. 85: 236-243.
0
Astronomical Tide and Typhoon-Induced Storm
Surge in Hangzhou Bay, China
Jisheng Zhang
1
,ChiZhang
1
, Xiuguang W u
2
and Yakun Guo
3
1
State Key Laboratory of Hydrology-Water Resources and Hydraulic Engineering,
Hohai University, Nanjing, 210098
2
Zhejiang Institute of Hydraulics and Estuary, Hangzhou, 310020
3
School of Engineering, University of Aberdeen,
Aberdeen, AB24 3UE
1,2
China
3
United Kingdom
1. Introduction
The Hangzhou Bay, located at the East of China, is widely known for having one of the
world’s largest tidal bores. It i s connected with the Qiantang River and the Eastern C hina
Sea, and contains lots of small islands collectively referred as Zhoushan Islands ( see Figure
1). The estuary mouth of the Hangzhou Bay is about 100 km wide; however, the head of
bay (Ganpu) which is 86 km away from estuary mouth is significantly narr owed to only
21 km wide. The tide in the Hangzhou Bay is an anomalistic semidiurnal tide due to the
irregular geometrical shape and shallow depth and is mainly controlled b y the M
2
harmonic
constituent. The M
2
tidal constituent has a period about 12 hours and 25.2 minutes, exactly
half a tidal lunar day. The Hangzhou Bay faces frequent threats from tropical cyclones and
suffers a massive damage from its resulting strong wind, s torm surge and inland flooding.
According to the 1949-2008 statistics, about 3.5 typhoons occur in this area every year. When
typhoon generated in tropic open sea moves towards the estuary mouth, lower atmospheric
pressure in the typhoon center causes a relatively high water elevation in adjacent area and
strong surface wind pushes huge volume of seawater into the estuary, making water elevation
in the Hangzhou Bay significantly increase. As a result, the typhoon-induced external forces
(wind stress and p ressure deficit) above sea surface make the tidal hydrodynamics in the
Hangzhou Bay further co mplicated.
In the recent years, some researches have been done to study the tidal hydrodynamics in the
Hangzhou Bay and its adjacent areas. For example, Hu et al. (2000) simulated the current
field in the Hangzhou Bay based on a 2D model, and their simulated surface elevation and
current field preferably compared with the field observations. Su e t al. (2001), Pan et al. (2007)
and Wang (2009) numerically investigate the formulation, propagation and dissipation of the
tidal bore at the head of Hangzhou Bay. Also, Cao & Zhu (2000), Xie et al . (2007), Hu et al.
(2007) and Guo et al. (2009) performed numerical simulation to study the typhoon-induced
9
2 Will-be-set-by-IN-TECH
Fig. 1. Global location and 2005’s bathymetry of the Hangzhou Bay and its adjacent s helf
region
storm surge. However, most of them mainly focused on the 2D mathematical model. The
main objective o f this study is to understand the characteristics of (i) astronomical tide and
(ii) typhoon-induced storm surge in the Hangzhou Bay based on the field observation and 3D
numerical simulation.
2. Field observation
To understand the astronomical tides in the Hangzhou Bay, a five-month in situ measurement
was carried out by the Zhejiang Institute of Hydraulic and Estuary from 01 April 2005 to 31
August 2005. There were eight fixed stations (T1-T8) along the banks of the Hangzhou Bay,
at which long-term tidal elevations were measured every 30 minutes using ship-mounted
WSH meter with the accuracy of
±0.03 m. The tidal current velocity was recorded every
30 minutes at four stations H1-H4 using SLC9-2 meter, manufactured by Qiandao Guoke
Ocean Environment and Technology Ltd, with precisions of
±4
◦
in direction and ±1.5% in
magnitude. The topography investigation in the Hangzhou Bay was also carried out in the
early April 2005. Figure 2 shows the tidal gauge positions and velocity measurement points,
together with the measured topography us ing different colors.
On 27/08/1981, a tropical depression named Agnes was initially formed about 600 km
west-northwest of Guam in the early morning and it rapidly developed as a tropical storm
moving west-northwestward (towards to Zhejiang Province) in the evening. Agnes became a
typhoon in the morning of 29/08/1981, 165 km southwest of Okinawa next day. Agnes started
to weaken after e ntering a region of hostile northerly vertical wind s hear. The cyclonic center
was almost completely disappeared by the morning of 02/09/1981. During Typhoon Agnes
180
Hydrodynamics – Natural Water Bodies
Astronomical Tide and Typhoon-Induced Storm Surge in Hangzhou Bay, China 3
Fig. 2. A sketch o f measurement stations and topography
(No.8114), which resulted in one of extremely recorded high water levels in the Hangzhou
Bay, wind fields were observed every hour and storm tides were recorded every three hours
at Daji station and Tanxu station (see Figure 1). Only the surge e levations were recorded and
no current velocity was measured.
3. Numerical simulation
3.1 Governing equations
A 3D mathematical model based on FVCOM (an unstructured grid, Finite-Volume Coastal
Ocean Model) (Chen et al., 2003) is developed f or this study. The model uses an unstructured
triangular grid in horizontal plane and a terrain-following σ-coordinate in vertical plane
(see Figure 3), having a great ability to capture irregular shoreline and uneven seabed.
The most sophisticated turbulence closure sub-model, Mellor-Yamada 2.5 turbulence model
(Mellor & Yamada, 1982), is applied to c ompute the vertical mixing coefficients. More details
of FVCOM c an be found in Chen et al. (2003). Only the governing equations of the model are
given here for completeness and convenience.
∂ζ
∂t
+
∂Du
∂x
+
∂Dv
∂y
+
∂ω
∂σ
= 0(1)
181
Astronomical Tide and Typhoon-Induced Storm Surge in Hangzhou Bay, China
4 Will-be-set-by-IN-TECH
Fig. 3. Coordinate transformation of the vertical co mputational domain. Left: z-coordinate
system; Right: σ-coordinate system
∂uD
∂t
+
∂u
2
D
∂x
+
∂uvD
∂y
+
∂uω
∂σ
= fvD−
D
ρ
o
∂P
atm
∂x
− gD
∂ζ
∂x
−
gD
ρ
o
[
∂
∂x
(D
0
σ
ρdσ
)+σρ
∂D
∂x
]+
∂
∂σ
(
K
m
D
∂u
∂σ
)+DF
u
(2)
∂vD
∂t
+
∂uvD
∂x
+
∂v
2
D
∂y
+
∂vω
∂σ
= − fuD−
D
ρ
o
∂P
atm
∂y
− gD
∂ζ
∂y
−
gD
ρ
o
[
∂
∂y
(D
0
σ
ρdσ
)+σρ
∂D
∂y
]+
∂
∂σ
(
K
m
D
∂v
∂σ
)+DF
v
(3)
∂TD
∂t
+
∂TuD
∂x
+
∂TvD
∂y
+
∂Tω
∂σ
=
∂
∂σ
(
K
h
D
∂T
∂σ
)+DF
T
(4)
∂SD
∂t
+
∂Su D
∂x
+
∂SvD
∂y
+
∂Sω
∂σ
=
∂
∂σ
(
K
h
D
∂S
∂σ
)+DF
S
(5)
ρ
= ρ(T, S) (6)
∂q
2
D
∂t
+
∂uq
2
D
∂x
+
∂vq
2
D
∂y
+
∂ω q
2
∂σ
=
2K
m
D
[(
∂u
∂σ
)
2
+(
∂v
∂σ
)
2
]+
2g
ρ
o
K
h
∂ρ
∂σ
−
2Dq
3
B
1
l
+
∂
∂σ
(
K
q
2
D
∂q
2
∂σ
)+DF
q
2
(7)
∂q
2
lD
∂t
+
∂uq
2
lD
∂x
+
∂vq
2
lD
∂y
+
∂ω q
2
l
∂σ
=
lE
1
K
m
D
[(
∂u
∂σ
)
2
+(
∂v
∂σ
)
2
]+
lE
1
g
ρ
o
K
h
∂ρ
∂σ
−
Dq
3
B
1
W
+
∂
∂σ
(
K
q
2
D
∂q
2
l
∂σ
)+DF
q
2
l
(8)
182
Hydrodynamics – Natural Water Bodies
Astronomical Tide and Typhoon-Induced Storm Surge in Hangzhou Bay, China 5
where x, y and σ are the east, north and upward axes of the σ-coordinate system; u, v and
w are the x, y and σ velocity components, respectively; t is the time; ζ is the water elevation;
D is the total water depth (=H+ζ, in which H is the bottom depth); P
atm
is the atmospheric
pressure; ρ is the seawater density being a polynomial function of temperature T and salinity
S (Millero & Poisson, 1981); f is the local Coriolis parameter (dependent on local latitude
and the angular s peed of the Earth’s rotation); g i s the acceleration due to gravity (=9.81
m/s
2
); ρ
0
is the mean seawater density ( =1025 kg/m
3
); K
m
and K
h
are the vertical eddy
viscosity coefficient and thermal vertical eddy diffusion coefficient; F
u
,F
v
,F
T
and F
S
are the
horizontal u-momentum, v-momentum, thermal and salt diffusion terms, respectively; q
2
is
the turbulent kinetic energy; l is the turbulent macroscale; K
q
2
is the vertical eddy diffusion
coefficient of the turbulent kinetic energy;
W is a wall proximity function ( =1+E
2
(
l
κL
)
2
,where
the parameter L
−1
=(ζ-z)
−1
+(H+z)
−1
); F
q
2
and F
q
2
l
represent the horizontal diffusion terms
of turbulent k inetic energy and turbulent macroscale; and B
1
,E
1
and E
2
are the empirical
constants assigned as 16.6, 1.8 and 1.33, respectively.
Mode splitting technique is applied to permit the separation of 2D depth-averaged external
mode and 3D internal mode, allowing the use of large time s tep. 3D internal mode
is num erically integrated using a second-order Runge-Kutta time-stepping scheme, while
2D external mode is in tegrated using a modified fourth-order Runge-Kutta time-stepping
scheme. A schematic solution procedure of this 3D model is illustrated in Figure 4. The
point wetting/drying treatment technique is included to predict the water covering and
uncovering process in the inter-tide zone. In the case of typhoon, the accuracies of the
atmospheric pressure and wind fields are crucial to the simulation of storm surge. In this
study, an analytical cyclone model developed by Jakobsen & Madsen (2004) is applied to
predict pressure gradient and wind stress. The shape parameter and cyclonic regression
parameter are determined by the f ormula suggested by Hubbert et al. (1991) and the available
field observations in the Hangzhou Bay (Chang & Pon, 2001), respectively. Please refer to
Guo et al. (2009) for more information.
3.2 Boundary conditions
The moisture flux and net heat flux can be imposed on the sea surface and bottom boundaries,
but are not considered in this study. The method o f Kou et al. ( 1996) is u sed to estimate
the bottom shear stress induced by bottom boundary friction, accounting for the impact o f
flow acceleration and non-constant stress in tidal estuary. A river runoff (Q=1050 m
3
/s)
from the Qiantang River according to long-term field observation is applied on the land side
of the model domain. The elevation clamped open boundary condition and atmospheric
force (wind stress and pressure gradient) above sea surface are the main driving forces of
numerical simulation. In modeling astronomical tide, the time-dependent open-sea elevations
are from field observation at stations T7-T8 and zero atmospheric force i s given. In modeling
typhoon-induced storm surge, the time-dependent open-sea elevations are from FES2004
model (Lyard et al., 2006) and typhoon-generated water s urface variations and atmospheric
force is estimated by the analytical cyclone model. In this study, the external time step is
Δt
E
=2 s ec and the ratio of internal time step to external time step is I
S
=5.
183
Astronomical Tide and Typhoon-Induced Storm Surge in Hangzhou Bay, China
6 Will-be-set-by-IN-TECH
Fig. 4. A schematic solution procedure of 3D estuarine modeling
184
Hydrodynamics – Natural Water Bodies
Astronomical Tide and Typhoon-Induced Storm Surge in Hangzhou Bay, China 7
3.3 Mesh generation
As shown in Figures 1 and 2, the Hangzhou Bay has a very irregular shoreline. Therefore,
to accurately represent the computational domain of the Hangzhou Bay, unstructured
triangular meshes with arbitrarily spatially-dependent size were generated. The area of
the whole solution domain defined for astronomical tide modeling is about 5360 km
2
.The
computational meshes were carefully adapted and refined, especially in the inter-tide zone,
until no significant changes in the solution we re achieved. The final unstructured grid having
90767 nodes and 176973 elements in the horizontal plane (each σ-level) was used with minimal
distance of 20 m in the cells (see Figure 5). In the vertical direction, 11 σ-levels (10 σ-layers)
compressing the σ mesh near the wate r surface and sea b ottom symmetrically about the
mid-depth are applied.
In modeling typhoon-induced storm surge, a large domain-localized grid resolution strategy
is applied in mesh generation, defining very large computational domain covering the main
area of typhoon and locally refining the concerned regions with very small tr iangular meshes.
The whole co mputational d omain covers an extensive range of 116-138
o
E in longitude and
21-41
o
N in latitude. The final unstructured grid having 111364 nodes and 217619 e lements in
the horizontal plane (each σ-level) was used with the minimal 100 m grid size n ear shoreline
and the maximal 10000 m grid s ize in open-sea boundary (see Figure 6) . In the vertical
direction, 6 σ-levels (5 σ-layers) is uniformly applied.
4. Results and discussion
The results from field observation and numerical simulation are compared and further used
to investigate the characteristics of tidal hydrodynamics in the Hangzhou Bay with/without
the presence o f typhoon.
4.1 Astronomical tide
4.1.1 Tidal elevation
Figures 7 and 8 are the comparison of simulated and observed tidal elevations at 5 stations
(T2, T3, T4, T5 and T6) in spring tide and neap tide, respectively. The x-coordinate of these
figures is in the unit of day, and, for example, the label ’21.25 August 2005’ indicates ’6:00am of
21/08/2005’. Both the numerical simulation and field observation for spring and neap tides
show that the tidal range increases significantly as it travels f rom the lower estuary (about
6.2 m in spring tide and 3.1 m in neap tide at T6) towards the middle estuary (about 8.1 m
in spring tide and 3. 7 m in neap tide at T4), mainly due to rapid narrowing of the estuary.
The tidal range reaches the maximum at Ganpu station (T4) and decreases as it continues
traveling towards the upper e stuary (about 4.4 m in spring tide and 2.5 m in neap tide at T2).
In general, very good agreement between the simulation and observation is obtained. T h ere
exists, however, a slight discrepancy between the computed and observed tidal elevations
at T2 (Yanguan). The reason for this may be ascribed to that the numerical model does not
consider the tidal bore, which m ay have significant effect on the ti dal elevations at the upper
reach. Such impact on tidal elevations, however, decreases and becomes negligible at the
lower reach of the estuary.
185
Astronomical Tide and Typhoon-Induced Storm Surge in Hangzhou Bay, China
8 Will-be-set-by-IN-TECH
Fig. 5. A sketch o f triangular grid (upper) and locally zoomed in mesh near Ganpu station
(lower) for modeling astronomical tide
186
Hydrodynamics – Natural Water Bodies