Heat Transfer Engineering Applications Part 8 pot
Bạn đang xem bản rút gọn của tài liệu. Xem và tải ngay bản đầy đủ của tài liệu tại đây (2.26 MB, 30 trang )
Thermal Transport in Metallic Porous Media
199
lsw
()
r
Ja
cTT
. (57)
The local heat transfer coefficient and Nusselt number along the x direction can be obtained
in Eqs. (59) and (60):
ee
ll
ws ws
0
0
1
/
y
y
kk
TT
hx
TTy xTT
yx
. (58)
e
x
Nu x h x
k
. (59)
The condensate film Reynolds number is expressed as follows:
ll
4hx
Re x
cJa
. (60)
In the region outside condensation layer, the domain extension method is employed, where
special numerical treatment is implemented during the inner iteration to ensure that
velocity and temperature in this extra region are set to be zero and T
s
, and that these values
cannot affect the solution of velocity and temperature field inside condensation layer.
The governing equations in Eqs. (52)-(54) are solved with using SIMPLE algorithm (Tao,
2005). The convective terms are discritized using the power law scheme. A 200×20 grid
system has been checked to gain a grid independent solution. The velocity field is solved
ahead of the temperature field and energy balance equation. By coupling Eqs. (52)-(55), the
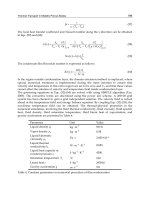
non-linear temperature field can be obtained. The thermal-physical properties in the
numerical simulation, involving the fluid thermal conductivity, fluid viscosity, fluid specific
heat, fluid density, fluid saturation temperature, fluid latent heat of vaporization, and
gravity acceleration are presented in Table 4.
Parameter Unit Value
Liquid density
l
-3
kg m
977.8
Vapor density
v
-3
k
g
m
0.58
Liquid kinematic
viscousity
l
Pa s
2.825×10
-4
Liquid thermal
conductivity
l
k
11
Wm K
0.683
Liquid heat capacity at
constant pressure
l
c
11
Jk
g
K
4200
Saturation temperature
s
T
C
100
Latent heat r
-1
Jk
g
297030
Gravity acceleration
g
2
ms
9.8
Table 4. Constant parameters in numerical procedure of film condensation
Heat Transfer – Engineering Applications
200
For a limited case of porosity being equal to 1, the present numerical model can predict film
condensation on the vertical smooth plate for reference case validation. The distribution of
film condensate thickness and local heat transfer coefficient on the smooth plate predicted
by the present numerical model with those of Nusselt (Nusselt, 1916) and Al-Nimer and Al-
Kam (Al-Nimer and Al-Kam, 1997) are shown in Fig. 19. It can be seen that the numerical
solution is approximately consistent with either Nusselt (Nusselt, 1916) or Al-Nimer and Al-
Kam (Al-Nimer and Al-Kam, 1997). The maximum deviation for condensate thickness and
local heat transfer coefficient is 14.5% and 12.1%, respectively.
0.0 0.2 0.4 0.6 0.8 1.
0
0.0
5.0x10
-5
1.0x10
-4
1.5x10
-4
2.0x10
-4
2.5x10
-4
3.0x10
-4
3.5x10
-4
(m)
y (m)
numerical solution
Al-Nimer and Al-Kam, 1997
Nusselt, 1916
Fig. 19. Distribution of condensate thickness for the smooth plate (
=0.9, 10 PPI)
Figure 20(a) exhibits the temperature distribution in condensate layer for three locations in
the vertical direction (
x/L=0.25, 0.5, and 0.75) with porosity and pore density being 0.9 and
10 PPI, respectively. Evidently, the temperature profile is nonlinear. The non-linear
characteristic is more significant, or the defined temperature gradient
l
//Tyx
is
higher in the downstream of condensate layer since the effect of heat conduction thermal
resistance of the foam matrix in horizontal direction becomes more obvious.
0.0 0.2 0.4 0.6 0.8 1.0
65
70
75
80
85
90
95
100
x/L=0.75
x/L=0.5
T (℃)
y/
x/L=0.25
Fig. 20. Temperature distribution in condensate layer for different
x (
=0.9, 10 PPI)
Effects of parameters involving Jacobi number, porosity, and pore density are discussed in
this section. Super cooling degree can be controlled by changing the value of
Ja. The effect of
Ja on the condensate layer thickness is shown in Fig. 21(a). It can be seen that condensate
Thermal Transport in Metallic Porous Media
201
layer thickness decreases as the Jacobi number increases. This can be attributed to the fact
that the super cooling degree, which is the key factor driving the condensation process, is
reduced as the
Ja number increases, leading to a thinner liquid condensate layer. For a
limited case of zero super cooling degree, condensation cannot occur and the condensate
layer does not exist.
The effect of porosity on the condensate film thickness is shown in Fig. 21(b). It is found that
in a fixed position, increase in porosity can lead to the decrease in the condensate film
thickness, which is helpful for film condensation. This can be attributed to the fact that the
increase in porosity can make the permeability of the metallic foams increase, decreasing the
flow resistance of liquid flowing downwards. The effect of pore density on the condensate
film thickness is shown in Fig. 21(c). It can be seen that for a fixed x position, the increase in
pore density can make the condensate film thickness increase greatly, which enlarges the
thermal resistance of the condensation heat transfer process. The reason for the above result
is that the increasing pore density can significantly reduce metal foam permeability and
substantially increase the flow resistance of the flowing-down condensate. Thus, with either
an increase in porosity or a decrease in pore density, condensate layer thickness is reduced
for condensation heat transfer coefficient.
0.00.20.40.60.81.
0
0.0
1.0x10
-4
2.0x10
-4
3.0x10
-4
4.0x10
-4
5.0x10
-4
(m)
x
(
m
)
Ja=2
Ja=7
Ja=14
Ja=35
0.0 0.2 0.4 0.6 0.8 1.
0
0.0
1.0x10
-4
2.0x10
-4
3.0x10
-4
4.0x10
-4
5.0x10
-4
6.0x10
-4
(m)
x
(
m
)
=0.80
=0.85
=0.90
=0.95
0.0 0.2 0.4 0.6 0.8 1.0
0.0
2.0x10
-4
4.0x10
-4
6.0x10
-4
8.0x10
-4
1.0x10
-3
1.2x10
-3
1.4x10
-3
1.6x10
-3
(m)
x(m)
5 PPI
20 PPI
40 PPI
60 PPI
(a) (b) (c)
Fig. 21. Effects of important parameters on condensate thickness distribution: (a) effect of
Jacobi number (
=0.9, 10 PPI); (b) effect of porosity (10PPI); (c) pore density (
=0.9)
5. Conclusion
Metallic porous media exhibit great potential in heat transfer area. The characteristic of high
pressure drop renders those with high porosity and low pore density considerably more
attractive in view of pressure loss reduction. For forced convective heat transfer, another
way to lower pressure drop is to fill the duct partially with metallic porous media.
In this chapter, natural convection in metallic foams is firstly presented. Their enhancement
effects on heat transfer are moderate. Next, we exhibit theoretical modeling on thermal
performance of metallic foam fully/partially filled duct for internal flow with the two-
equation model for high solid thermal conductivity foams. Subsequently, a numerical model
for film condensation on a vertical plate embedded in metallic foams is presented and the
effects of advection and inertial force are considered, which are responsible for the non-
linear effect of cross-sectional temperature distribution. Future research should be focused
on following areas with metallic porous media: implementation of computation and
parameter optimization for practical design of thermal application, phase change process,
turbulent flow and heat transfer, non-equilibrium conjugate heat transfer at porous-fluid
Heat Transfer – Engineering Applications
202
interface, thermal radiation, experimental data/theoretical model/flow regimes for two-
phase/multiphase flow and heat transfer, and so on.
6. Acknowledgment
This work is supported by the National Natural Science Foundation of China (No.
50806057), the National Key Projects of Fundamental R/D of China (973 Project:
2011CB610306), the Ph.D. Programs Foundation of the Ministry of Education of China
(200806981013) and the Fundamental Research Funds for the Central Universities.
7. References
Alazmi, B. & Vafai, K. (2001). Analysis of Fluid Flow and Heat Transfer Interfacial
Conditions Between a Porous Medium and a Fluid Layer. International Journal of
Heat and Mass Transfer, Vol.44, No.9, (May 2001), pp. 1735-1749, ISSN 0017-9310
Al-Nimer, M.A. & Al-Kam, M.K. (1997). Film Condensation on a Vertical Plate Imbedded in
a Porous Medium. Applied Energy, Vol. 56, No.1, (January 1997), pp. 47-57, ISSN
0306-2619
Banhart, J. (2001). Manufacture, characterisation and application of cellular metals and metal
foams, Progress in Materials Science, Vol.46, No.6, (2001), pp. 559-632, ISSN 0079-
6425
Boomsma, K. &Poulikakos, D. (2001). On the Effective Thermal Conductivity of a Three-
Dimensionally Structured Fluid-Saturated Metal Foam. International Journal of Heat
and Mass Transfer, Vol.44, No.4, (February 2001), pp. 827-836, ISSN 0017-9310
Calmidi, V.V. (1998). Transport phenomena in high porosity fibrous metal foams. Ph.D. thesis,
University of Colorado.
Calmidi, V.V. & Mahajan, R.L. (2000). Forced convection in high porosity metal foams.
Journal of Heat Transfer, Vol.122, No.3, (August 2000), pp. 557-565, ISSN 0022-1481
Chang, T.B. (2008). Laminar Film Condensation on a Horizontal Wavy Plate Embedded in a
Porous Medium. International Journal of Thermal Sciences, Vol. 47, No.4, (January
2008), pp. 35–42, ISSN 1290-0729
Cheng, B. & Tao, W.Q. (1994). Experimental Study on R-152a Film Condensation on Single
Horizontal Smooth Tube and Enhanced Tubes. Journal of Heat Transfer, Vol.116,
No.1, (February 1994), pp. 266-270, ISSN 0022-1481
Cheng, P. & Chui, D.K. (1984). Transient Film Condensation on a Vertical Surface in a
Porous Medium. International Journal of Heat and Mass Transfer, Vol.27, No.5, (May
1984), pp. 795–798, ISSN 0017-9310
Churchil S.W. & Ozoe H. (1973). A Correlation for Laminar Free Convection from a Vertical
Plate. Journal of Heat Transfer, Vol.95, No.4, (November 1973), pp. 540-541, ISSN
0022-1481
Dhir, V.K. & Lienhard, J.H. (1971). Laminar Film Condensation on Plane and Axisymmetric
Bodies in Nonuniform Gravity. Journal of Heat Transfer, Vol.93, No.1, (February
1971), pp. 97-100, ISSN 0022-1481
Du, Y.P.; Qu, Z.G.; Zhao, C.Y. &Tao, W.Q. (2010). Numerical Study of Conjugated Heat
Transfer in Metal Foam Filled Double-Pipe. International Journal of Heat and Mass
Transfer, Vol.53, No.21, (October 2010), pp. 4899-4907, ISSN 0017-9310
Thermal Transport in Metallic Porous Media
203
Du, Y.P.; Qu, Z.G.; Xu, H.J.; Li, Z.Y.; Zhao, C.Y. &Tao, W.Q. (2011). Numerical Simulation of
Film Condensation on Vertical Plate Embedded in Metallic Foams. Progress in
Computational Fluid Dynamics, Vol.11, No.3-4, (June 2011), pp. 261-267, ISSN 1468-
4349
Dukhan, N. (2009). Developing Nonthermal-Equilibrium Convection in Porous Media with
Negligible Fluid Conduction. Journal of Heat Transfer, Vol.131, No.1, (January 2009),
pp. 014501.1-01450.3, ISSN 0022-1481
Fujii T. & Fujii M. (1976). The Dependence of Local Nusselt Number on Prandtl Number in
Case of Free Convection Along a Vertical Surface with Uniform Heat-Flux.
International Journal of Heat and Mass Transfer, Vol. 19, No.1, (January 1976), pp. 121-
122, ISSN 0017-9310
Incropera, F.P.; Dewitt, D.P. & Bergman, T.L. (1985). Fundamentals of heat and mass transfer
(2
nd
Edition), ISBN 3540295267, Springer, New York, USA
Jain, K.C. & Bankoff, S.G. (1964). Laminar Film Condensation on a Porous Vertical Wall with
Uniform Suction Velocity. Journal of Heat Transfer, Vol. 86, (1964), pp. 481-489, ISSN
0022-1481
Jamin Y.L. & Mohamad A.A. (2008). Natural Convection Heat Transfer Enhancements From
a Cylinder Using Porous Carbon Foam: Experimental Study. Journal of Heat
Transfer, Vol.130, No.12, (December 2008), pp. 122502.1-122502.6, ISSN 0022-1481
Lee, D.Y. & Vafai, K. (1999). Analytical characterization and conceptual assessment of solid
and fluid temperature differentials in porous media. International Journal of Heat and
Mass Transfer, Vol.42, No.3, (February 1999), pp. 423-435, ISSN 0017-9310
Lienhard, J.H. IV & Lienhard J.H.V (2006). A heat transfer textbook (3rd Edition), Phlogiston,
ISBN 0-15-748821-1, Cambridge in Massachusetts, USA
Lu, T.J.; Stone, H.A. & Ashby, M.F. (1998). Heat transfer in open-cell metal foams. Acta
Materialia, Vol.46, No.10, (June 1998), pp. 3619-3635, ISSN 1359-6454
Lu, W.; Zhao, C.Y. & Tassou, S.A. (2006). Thermal analysis on metal-foam filled heat
exchangers, Part I: Metal-foam filled pipes. International Journal of Heat and Mass
Transfer, Vol.49, No.15-16, (July 2006), pp. 2751-2761, ISSN 0017-9310
Mahjoob, S. & Vafai, K. (2009). Analytical Characterization of Heat Transport through
Biological Media Incorporating Hyperthermia Treatment. International Journal of
Heat and Mass Transfer, Vol.52, No.5-6, (February 2009), pp. 1608–1618, ISSN 0017-
9310
Masoud, S.; Al-Nimr, M.A. & Alkam, M. (2000). Transient Film Condensation on a Vertical
Plate Imbedded in Porous Medium. Transport in Porous Media, Vol. 40, No.3,
(September 2000), pp. 345–354, ISSN 0169-3913
Nusslet, W. (1916). Die Oberflachenkondensation des Wasserdampfes. Zeitschrift des Vereines
Deutscher Ingenieure, Vol. 60, (1916), pp. 541-569, ISSN 0341-7255
Ochoa-Tapia, J.A. & Whitaker, S. (1995). Momentum Transfer at the Boundary Between a
Porous Medium and a Homogeneous Fluid-I: Theoretical Development.
International Journal of Heat and Mass Transfer, Vol.38, No.14, (September 1995), pp.
2635-2646, ISSN 0017-9310
Phanikumar, M.S. & Mahajan, R.L. (2002). Non-Darcy Natural Convection in High Porosity
Metal Foams. International Journal of Heat and Mass Transfer, Vol.45, No.18, (August
2002), pp. 3781–3793, ISSN 0017-9310
Heat Transfer – Engineering Applications
204
Popiel, C.O. & Boguslawski, L. (1975). Heat transfer by laminar film condensation on sphere
surfaces. International Journal of Heat and Mass Transfer, Vol.18, No.12, (December
1975), pp. 1486-1488, ISSN 0017-9310
Poulikakos, D. & Kazmierczak, M. (1987). Forced Convection in Duct Partially Filled with a
Porous Material. Journal of Heat Transfer, Vol.109, No.3, (August 1987), pp. 653-662,
ISSN 0022-1481
Sparrow E.M. & Gregg, J.L. (1956). Laminar free convection from a vertical plate with
uniform surface heat flux. Transactions of ASME, Vol. 78, (1956), pp. 435-440
Sukhatme, S.P.; Jagadish, B.S. & Prabhakaran P. (1990). Film Condensation of R-11 Vapor on
Single Horizontal Enhanced Condenser Tubes. Journal of Heat Transfer, Vol. 112,
No.1, (February 1990), pp. 229-234, ISSN 0022-1481
Tao, W.Q. (2005). Numerical Heat Transfer (2
nd
Edition), Xi’an Jiaotong University Press, ISBN
7-5605-0183-4, Xi’an, China.
Wang, S.C.; Chen, C.K. & Yang, Y.T. (2006). Steady Filmwise Condensation with Suction on
a Finite-Size Horizontal Plate Embedded in a Porous Medium Based on Brinkman
and Darcy models. International Journal of Thermal Science, Vol.45, No.4, (April 2006),
pp. 367–377, ISSN 1290-0729
Wang, S.C.; Yang, Y.T. & Chen, C.K. (2003). Effect of Uniform Suction on Laminar Film-Wise
Condensation on a Finite-Size Horizontal Flat Surface in a Porous Medium.
International Journal of Heat and Mass Transfer, Vol.46, No.21, (October 2003), pp.
4003-4011, ISSN 0017-9310
Xu, H.J.; Qu, Z.G. & Tao, W.Q. (2011a). Analytical Solution of Forced Convective Heat
Transfer in Tubes Partially Filled with Metallic Foam Using the Two-equation
Model. International Journal of Heat and Mass Transfer, Vol. 54, No.17-18, (May 2011),
pp. 3846–3855, ISSN 0017-9310
Xu, H.J.; Qu, Z.G. & Tao, W.Q. (2011b). Thermal Transport Analysis in Parallel-plate
Channel Filled with Open-celled Metallic Foams. International Communications in
Heat and Mass Transfer, Vol.38, No.7, (August 2011), pp. 868-873, ISSN 0735-1933
Xu, H.J.; Qu, Z.G.; Lu, T.J.; He, Y.L. & Tao, W.Q. (2011c). Thermal Modeling of Forced
Convection in a Parallel Plate Channel Partially Filled with Metallic Foams. Journal
of Heat Transfer, Vol.133, No.9, (September 2011), pp. 092603.1-092603.9, ISSN 0022-
1481
Zhao, C.Y.; Kim, T.; Lu, T.J. & Hodson, H.P. (2001). Thermal Transport Phenomena in Porvair
Metal Foams and Sintered Beds. Technical report, University of Cambridge.
Zhao, C.Y.; Kim, T.; Lu, T.J. & Hodson, H.P. (2004). Thermal Transport in High Porosity
Cellular Metal Foams. Journal of Thermophysics and Heat Transfer, Vol.18, No.3,
(2004), pp. 309-317, ISSN 0887-8722
Zhao, C.Y.; Lu, T.J. & Hodson, H.P. (2004). Thermal radiation in ultralight metal foams with
open cells. International Journal of Heat and Mass Transfer, Vol. 47, No.14-16, (July
2004), pp. 2927–2939, ISSN 0017-9310
Zhao, C.Y.; Lu, T.J. & Hodson, H.P. (2005). Natural Convection in Metal Foams with Open
Cells. International Journal of Heat and Mass Transfer, Vol.48, No.12, (June 2005), pp.
2452–2463, ISSN 0017-9310
Zhao, C.Y.; Lu, W. & Tassou, S.A. (2006). Thermal analysis on metal-foam filled heat
exchangers, Part II: Tube heat exchangers. International Journal of Heat and Mass
Transfer, Vol.49, No.15-16, (July 2006), pp. 2762-2770, ISSN 0017-9310
9
Coupled Electrical and Thermal Analysis of
Power Cables Using Finite Element Method
Murat Karahan
1
and Özcan Kalenderli
2
1
Dumlupinar University, Simav Technical Education Faculty,
2
Istanbul Technical University, Electrical-Electronics Faculty,
Turkey
1. Introduction
Power cables are widely used in power transmission and distribution networks. Although
overhead lines are often preferred for power transmission lines, power cables are preferred
for ensuring safety of life, aesthetic appearance and secure operation in intense settlement
areas. The simple structure of power cables turn to quite complex structure by increased
heat, environmental and mechanical strains when voltage and transmitted power levels are
increased. In addition, operation of existing systems at the highest capacity is of great
importance. This requires identification of exact current carrying capacity of power cables.
Analytical and numerical approaches are available for defining current carrying capacity of
power cables. Analytical approaches are based on IEC 60287 standard and there can only be
applied in homogeneous ambient conditions and on simple geometries. For example,
formation of surrounding environment of a cable with several materials having different
thermal properties, heat sources in the vicinity of the cable, non constant temperature limit
values make the analytical solution difficult. In this case, only numerical approaches can be
used. Based on the general structure of power cables, especially the most preferred
numerical approach among the other numerical approaches is the finite element method
(Hwang et al., 2003), (Kocar et al., 2004), (IEC TR 62095).
There is a strong link between current carrying capacity and temperature distributions of
power cables. Losses produced by voltage applied to a cable and current flowing through its
conductor, generate heat in that cable. The current carrying capacity of a cable depends on
effective distribution of produced heat from the cable to the surrounding environment.
Insulating materials in cables and surrounding environment make this distribution difficult
due to existence of high thermal resistances.
The current carrying capacity of power cables is defined as the maximum current value that
the cable conductor can carry continuously without exceeding the limit temperature values
of the cable components, in particular not exceeding that of insulating material. Therefore,
the temperature values of the cable components during continuous operation should be
determined. Numerical methods are used for calculation of temperature distribution in a
cable and in its surrounding environment, based on generated heat inside the cable. For this
purpose, the conductor temperature is calculated for a given conductor current. Then, new
calculations are carried out by adjusting the current value.
Heat Transfer – Engineering Applications
206
Calculations in thermal analysis are made usually by using only boundary temperature
conditions, geometry, and material information. Because of difficulty in identification and
implementation of the problem, analyses taking into account the effects of electrical
parameters on temperature or the effects of temperature on electrical parameters are
performed very rare (Kovac et al., 2006). In this section, loss and heating mechanisms were
evaluated together and current carrying capacity was defined based on this relationship. In
numerical methods and especially in singular analyses by using the finite element method,
heat sources of cables are entered to the analysis as fixed values. After defining the region
and boundary conditions, temperature distribution is calculated. However, these losses are
not constant in reality. Evaluation of loss and heating factors simultaneously allows the
modeling of power cables closer to the reality.
In this section, use of electric-thermal combined model to determine temperature
distribution and consequently current carrying capacity of cables and the solution with the
finite element method is given. Later, environmental factors affecting the temperature
distribution has been included in the model and the effect of these factors to current
carrying capacity of the cables has been studied.
2. Modelling of power cables
Modelling means reducing the concerning parameters’ number in a problem. Reducing the
number of parameters enable to describe physical phenomena mathematically and this
helps to find a solution. Complexity of a problem is reduced by simplifying it. The problem
is solved by assuming that some of the parameters are unchangeable in a specific time. On
the other hand, when dealing with the problems involving more than one branch of physics,
the interaction among those have to be known in order to achieve the right solution. In the
future, single-physics analysis for fast and accurate solving of simple problems and multi-
physics applications for understanding and solving complex problems will continue to be
used together (Dehning et al., 2006), (Zimmerman, 2006).
In this section, theoretical fundamentals to calculate temperature distribution in and around
a power cable are given. The goal is to obtain the heat distribution by considering voltage
applied to the power cable, current passing through the power cable, and electrical
parameters of that power cable. Therefore, theoretical knowledge of electrical-thermal
combined model, that is, common solution of electrical and thermal effects is given and
current carrying capacity of the power cable is determined from the obtained heat
distribution.
2.1 Electrical-thermal combined model for power cables
Power cables are produced in wide variety of types and named with various properties such
as voltage level, type of conductor and dielectric materials, number of cores. Basic
components of the power cables are conductor, insulator, shield, and protective layers
(armour). Conductive material of a cable is usually copper. Ohmic losses occur due to
current passing through the conductor material. Insulating materials are exposed to an
electric field depending on applied voltage level. Therefore, there will be dielectric losses in
that section of the cable. Eddy currents can develop on grounded shield of the cables. If the
protective layer is made of magnetic materials, hysteresis and eddy current losses are seen
in this section.
Coupled Electrical and Thermal Analysis of Power Cables Using Finite Element Method
207
Main source of warming on the power cable is the electrical power loss (R·I
2
) generated by
flowing current (I) through its conductor having resistance (R). The electrical power (loss)
during time (t) spends electrical energy (R·I
2
·t), and this electric energy loss turns into heat
energy. This heat spreads to the environment from the cable conductor. In this case,
differential heat transfer equation is given in (1) (Lienhard, 2003).
θ
( θ) ρkWc
t
(1)
Where;
θ : temperature as the independent variable (
o
K),
k : thermal conductivity of the environment surrounding heat source (W/Km),
ρ : density of the medium as a substance (kg/m
3
),
c : thermal capacity of the medium that transmits heat (J/kg
o
K),
W : volumetric heat source intensity (W/m
3
).
Since there is a close relation between heat energy and electrical energy (power loss), heat
source intensity (W) due to electrical current can be expressed similar to electrical power.
dxd
y
dzPJE
(2)
Where J is current density, E is electrical field intensity; dx.dy.dz is the volume of material
in the unit. As current density is J =
E and electrical field intensity is E = J/, ohmic losses
in cable can be written as;
2
1
dxd
y
dz
σ
PJ
(3)
Where is electrical conductivity of the cable conductor and it is temperature dependent. In
this study, this feature has been used to make thermal analysis by establishing a link
between electrical conductivity and heat transfer. In equation (4), relation between electrical
conductivity and temperature of the cable conductor is given as;
00
1
σ
ρ (1 α(θθ))
(4)
In the above equation ρ
0
is the specific resistivity at reference temperature value θ
0
(Ω·m); α
is temperature coefficient of specific resistivity that describes the variation of specific
resistivity with temperature.
Electrical loss produced on the conducting materials of the power cables depends on current
density and conductivity of the materials. Ohmic losses on each conductor of a cable
increases temperature of the power cable. Electrical conductivity of the cable conductor
decreases with increasing temperature. During this phenomenon, ohmic losses increases
and conductor gets more heat. This situation has been considered as electrical-thermal
combined model (Karahan et al., 2009).
In the next section, examples of the use of electric-thermal model are presented. In this
section, 10 kV, XLPE insulated medium voltage power cable and 0.6 / 1 kV, four-core PVC
insulated low voltage power cable are modeled by considering only the ohmic losses.
However, a model with dielectric losses is given at (Karahan et al., 2009).
Heat Transfer – Engineering Applications
208
2.2 Life estimation for power cables
Power cables are exposed to electrical, thermal, and mechanical stresses simultaneously
depending on applied voltage and current passing through. In addition, chemical changes
occur in the structure of dielectric material. In order to define the dielectric material life of
power cables accelerated aging tests, which depends on voltage, frequency, and
temperature are applied. Partial discharges and electrical treeing significantly reduce the life
of a cable. Deterioration of dielectric material formed by partial discharges particularly
depends on voltage and frequency. Increasing the temperature of the dielectric material
leads to faster deterioration and reduced cable lifetime. Since power cables operate at high
temperatures, it is very important to consider the effects of thermal stresses on aging of the
cables (Malik et al., 1998).
Thermal degradation of organic and inorganic materials used as insulation in electrical
service occurs due to the increase in temperature above the nominal value. Life span can be
obtained using the Arrhenius equation (Pacheco et al., 2000).
a
B
E
k θ
dp
Ae
dt
(5)
Where;
dp/dt : Change in life expectancy over time
A : Material constant
k
B
: Boltzmann constant [eV/K]
θ : Absolute temperature [
o
K]
E
a
: Excitation (activation) energy [eV]
Depending on the temperature, equation (6) can be used to estimate the approximate life of
the cable (Pacheco et al., 2000).
a
Bii
E
Δθ
k θθΔθ
i
ppe
(6)
In this equation, p is life [days] at temperature increment; p
i
is life [days] at
i
temperature; is the amount of temperature increment [
o
K]; and
i
is operating
temperature of the cable [
o
K].
In this study, temperature distributions of the power cables were obtained under electrical,
thermal and environmental stresses (humidity), and life span of the power cables was
evaluated by using the above equations and obtained temperature variations.
3. Applications
3.1 5.8/10 kV XLPE cable model
In this study, the first electrical-thermal combined analysis were made for 5.8/10 kV, XLPE
insulated, single core underground cable. All parameters of this cable were taken from
(Anders, 1997).
The cable has a conductor of 300 mm
2
cross-sectional area and braided copper conductor
with a diameter of 20.5 mm. In Table 1, thicknesses of the layers of the model cable are given
in order.
Coupled Electrical and Thermal Analysis of Power Cables Using Finite Element Method
209
Layer Thickness (mm)
Inner semiconductor 0.6
XLPE insulation 3.4
Outer semiconductor 0.6
Copper wire shield 0.7
PVC outer sheath 2.3
Table 1. Layer thicknesses of the power cable.
Fig. 1. Laying conditions of the cables.
Figure 1 shows the laying conditions taken into account for the cable. Here, it has been
accepted that three exactly same cables having the above given properties are laid side by
side at a depth of 1 m underground and they are parallel to the surface of the soil. The
distance between the cables is left up to a cable diameter. Thermal resistivity of soil
surrounding cables was taken as the reference value of 1 Km/W. The temperature at far
away boundaries is considered as 15
o
C.
3.1.1 Numerical analysis
For thermal analysis of the power cable, finite element method was used as a numerical
method. The first step of the solution by this method is to define the problem with
geometry, material and boundary conditions in a closed area. Accordingly the problem has
been described in a rectangle solution region having a width of 10 m and length of 5 m,
where three cables with the specifications given above are located. Description and
consequently solution of the problem are made in two-dimensional Cartesian coordinates.
In this case the third coordinate of the Cartesian coordinate system is the direction
perpendicular to the solution plane. Accordingly, in the solution region, the axes of the
cables defined as the two-dimensional cross-section will be parallel to the third coordinate
axis. In the solution, the third coordinate, and therefore the cables are assumed to be infinite
length cables.
Thermal conductivity (k) and thermal capacity (c) values of both cable components and soil
that were taken into account in analysis are given in Table 2. The table also shows the
density values considered for the materials. These parameters are the parameters used in the
heat transfer equation (1). Heat sources are defined according to the equation (3).
After geometrical and physical descriptions of the problem, the boundary conditions are
defined. The temperature on bottom and side boundaries of the region is assumed as fixed
(15
o
C), and the upper boundary is accepted as the convection boundary. Heat transfer
coefficient h is computed from the following empirical equation (Thue, 1999).
Soil
1 m
71.4 mm
Air
71.4 mm
Heat Transfer – Engineering Applications
210
Material
Thermal Conductivity
k (W/K.m)
Thermal Capacity
c (J/kg.K)
Density
(kg/m
3
)
Copper conductor 400 385 8700
XLPE insulation 1/3.5 385 1380
Copper wire screen 400 385 8700
PVC outer sheath 0.1 385 1760
Soil 1 890 1600
Table 2. Thermal properties of materials in the model.
0.75
7.371 6.43hu
(7)
Where u is wind velocity in m/s at ground surface on buried cable. In the analysis, wind
velocity is assumed to be zero, and the convection is the result of the temperature
difference.
Second basic step of the finite element method is to discrete finite elements for solution
region. Precision of computation increases with increasing number of finite elements.
Therefore, mesh of solution region is divided 8519 triangle finite elements. This process is
applied automatically and adaptively by used program.
Changing of cable losses with increasing cable temperature requires studying loss and
warm-up mechanisms together. Ampacity of the power cable is determined depending on
the temperature of the cable. The generated electrical-thermal combined model shows a
non-linear behavior due to temperature-dependent electrical conductivity of the material.
Fig. 2 shows distribution of equi-temperature curve (line) obtained from performed analysis
using the finite element method. According to the obtained distribution, the most heated
cable is the one in the middle, as a result of the heat effect of cables on each side. The current
value that makes the cable’s insulation temperature 90
o
C is calculated as 626.214 A. This
current value is calculated by multiplying the current density corresponding to the
temperature of 90
o
C with the cross-sectional area of the conductor. This current value is the
current carrying capacity of the cable, and it is close to result of the analytical solution of the
same problem (Anders, 1997), which is 629 A.
Fig. 2. Distribution of equi-temperature curves.
Equi-temperature curves
Coupled Electrical and Thermal Analysis of Power Cables Using Finite Element Method
211
In Fig. 3, variation of temperature distribution depending on burial depth of the cable in the
soil is shown. As shown in Fig. 3, the temperature of the cable with the convection effect
shows a rapid decline towards the soil surface. This is not the case in the soil. It can be said
that burial depth of the cables has a significant impact on cooling of the cables.
3.1.2 Effect of thermal conductivity of the soil on temperature distribution
Thermal conductivity or thermal resistance of the soil is seasons and climate-changing
parameter. When the cable is laid in the soil with moisture more than normal, it is easier to
disperse the heat generated by the cable. If the heat produced remains the same, according
to the principle of conservation of energy, increase in dispersed heat will result in decrease
in the heat amount kept by cable, therefore cable temperature drops and cable can carry
more current. Thermal conductivity of the soil can drop up to 0.4 W/K·m value in areas
where light rainfall occurs and high soil temperature and drying event in soil are possible.
In this case, it will be difficult to disperse the heat generated by the cable; the cable current
carrying capacity will drop. The variation of the soil thermal resistivity (conductivity)
depending on soil and weather conditions is given in Table 3 (Tedas, 2005).
Fig. 3. Variation of temperature distribution with buried depth of the cable in soil.
Thermal
Resistivity
(K.m/W)
Thermal
Conductivity
(W/K.m)
Soil
Conditions
Weather Conditions
0.7 1.4 Very moist Continuous moist
1 1 Moist Regular rain
2 0.5 Dry Sparse rain
3 0.3 Very dry too little rain or drought
Table 3. Variation of the soil thermal resistivity and conductivity with soil and weather
conditions.
Surface: Temperature [K]; Hei
g
ht: Temperature [K]
Heat Transfer – Engineering Applications
212
As can be seen from Table 3, at the continuous rainfall areas, soil moisture, and the value of
thermal conductivity consequently increases.
While all the other circuit parameters and cable load are fixed, effect of the thermal
conductivity of the surrounding environment on the cable temperature was studied.
Therefore, by changing the soil thermal conductivity, which is normally encountered in the
range of between 0.4 and 1.4 W/Km, the effect on temperature and current carrying capacity
of the cable is issued and results are given in Fig. 4. As shown in Fig. 4, the temperature of the
cable increases remarkably with decreasing thermal conductivity of the soil or surrounding
environment of the cable. This situation requires a reduction in the cable load.
Fig. 4. Effect of variation in thermal conductivity of the soil on temperature and current
carrying capacity (ampacity) of the cable.
When the cable load is 626.214 A and thermal conductivity of the soil is 1 W/Km, the
temperature of the middle cable that would most heat up was found to be 90
o
C. For the
thermal conductivity of 0.4 W/Km, this temperature increases up to 238
o
C (511.15
o
K). In this
case, load of the cables should be reduced by 36%, and the current should to be reduced to
399.4 A. In the case of thermal conductivity of 1.4 W/Km, the temperature of the cable
decreases to 70.7
o
C (343.85
o
K). This value means that the cable can be loaded %15 more
(720.23 A) compared to the case which the thermal conductivity of soil is 1 W/Km.
3.1.3 Effect of drying of the soil on temperature distribution and current carrying
capacity
In the numerical calculations, the value of thermal conductivity of the soil is usually
assumed to be constant (Nguyen et al., 2010) (Jiankang et al., 2010). However, if the soil
surrounding cable heats up, thermal conductivity varies. This leads to form a dry region
around the cable. In this section, effect of the dry region around the cable on temperature
distribution and current carrying capacity of the cable was studied.
In the previous section, in the case of the soil thermal conductivity is 1.4 W/Km, current
carrying capacity of the cable was found to be 720.23 A. In that calculation, the thermal
conductivity of the soil was assumed that the value did not change depending on
temperature value. In the experimental studies, critical temperature for drying of wet soil
was determined as about 60
o
C (Gouda et al., 2011). Analyses were repeated by taking into
300
350
400
450
500
550
200
400
600
800
0.4
0.6
0.8
1
1.2
1.4
Sicaklik (K)
Ampasite (A)
Isil iletkenlik (W/Km)
Temperature (K)
Ampacit
y
(A)
Thermal conductivity (W/Km)
Coupled Electrical and Thermal Analysis of Power Cables Using Finite Element Method
213
account the effect of drying of the soil and laying conditions. When the temperature for the
surrounding soil exceeds 60
o
C, which is the critical temperature, this part of the soil was
accepted as the dry soil and its thermal conductivity was included in the calculation with
the value of 0.6 W/Km.
The temperature distribution obtained from the numerical calculation using 720.23 A cable
current, 1.4 W/Km initial thermal conductivity of soil, as well as taking into account the
effect of drying in soil is given in Fig. 5. As shown in Fig. 5, considering the effect of soil
drying, temperature increased to 118.6
o
C (391.749
o
K). The cable heats up 28.6
o
C more
compared to the case where the thermal conductivity of the soil was taken as a constant
value of 1.4. The boundary of the dried soil, which means the temperature is higher than
critical value of 60
o
C (333.15
o
K), is also shown in the figure. Then, how much cable current
should be reduced was calculated depending on the effect of drying in the soil, and this
value was calculated as 672.9 A.
Fig. 5. Effect of drying in the soil on temperature distribution.
The new temperature distribution depending on this current value is given in Fig. 6. As a
result of drying effect in soil, the current carrying capacity of the cable was reduced by
about 7 %.
3.1.4 Effect of cable position on temperature distribution
In the calculations, the distance between the cables has been accepted that it is up to a cable
diameter. If the distances among the three cables laid side by side are reduced, the cable in
the middle is expected to heat up more because of two adjacent cables at both sides, as
shown in Fig. 7(a). In this case, current carrying capacity of the middle cable will be
reduced. Table 4 indicates the change in temperature of the middle cable depending on the
distance between cables and corresponding current carrying capacity, obtained from the
numerical solution.
Heat Transfer – Engineering Applications
214
Fig. 6. Effect of the soil drying on temperature distribution.
Fig. 7. Laying conditions of the cables.
As shown in Table 4, if there is no distance between the cables, temperature of the cable in
the middle increases 10
o
C. This situation requires about 6% reduction in the cable load. The
case where the distance between the cables is a diameter of a cable is the most appropriate
case for the current carrying capacity of the cable.
Distance between the
cables (mm)
Cable temperature
(
o
C)
Current carrying
capacity (A)
0 100.03 591.51
10 96.14 604.16
20 93.35 613.85
30 91.12 622.00
36 90.00 626.21
Table 4. Variation of temperature and current carrying capacity of the cable in middle with
changing distance between the cables.
(
a
)
1 m
35.7 mm
Soil
Air
Soil
Air
35.7 mm
1 m
(
b
)
Coupled Electrical and Thermal Analysis of Power Cables Using Finite Element Method
215
Triangle shaped another type of set-up, in which the cables contact to each other, is shown
in Fig. 7(b). Each cable heats up more by the effect of two adjacent cables in this placement.
The temperature distribution of a section with a height of 0.20 m and width of 0.16 m, which
was obtained from the numerical analysis by using the same material and environmental
properties given in section 3.1.1, is shown in Fig 8. As a result of this analysis, cables at the
bottom heated up more when compared with the cable at the top but, the difference has
been found to be fairly low. The current value that increases the temperature value of the
bottom cables to 90
o
C was found to be 590.63 A. This value is the current carrying capacity
for the cables laid in the triangle shaped set-up.
Fig. 8. Temperature distribution for the triangle-shaped set-up.
3.1.5 Single-cable status
In the studies conducted so far, the temperature distribution and current carrying capacity
of 10 kV XLPE insulated cables having the triangle shaped and flat shaped set-up with a
cable diameter distance have been determined. Other cables lay around or heat sources in
the vicinity of the cable reduce the current carrying capacity remarkably. In case of using a
single cable, the possible thermal effect of other cables will be eliminated and cable will
carry more current. In this section, as shown in Fig. 9, the current carrying capacity of a
Fig. 9. A power cable buried in different depths.
Wind [1-10 m/s]
0.5 m
0.7 m
1 m
Soil
Air [θ
∞
]
Surface: Temperature [K]
Contour: Temperature [K]
Heat Transfer – Engineering Applications
216
single cable was calculated for different burial depths and then the impact of wind on the
current carrying capacity of the cable has been examined.
In the created model, it is assumed that one 10 kV, XLPE insulated power cable is buried in
soil and burial depth is 1 m. Physical descriptions and boundary conditions are the same as
the values specified in section 3.1.1. The temperature distribution obtained by numerical
analysis is shown in Fig. 10.
Fig. 10. Three-dimensional temperature distribution in the cable.
According to this distribution, current value which makes the temperature of the cable
insulation is 90
o
C is calculated as 890.97 A. This value is the current carrying capacity for the
configuration of stand-alone buried cables and it is 264 A more than that of the side by side
configuration and 300 A more than that of triangle shaped set-up. The laying of the cable as
closer to the ground surface changes the temperature distribution in and around the cable.
For example, at 0.5, 0.7, and 1 m deep-buried case for the cable, the temperatures of the cable
insulation depending on the current passing through the cable are shown in Fig. 11.
From the Fig. 11, it is shown that the current carrying capacity increases with the laying of
the cable closer to the ground surface. When the cable was laid at a depth of 0.7 m, the
current value that makes insulation temperature 90
o
C was found to be 906.45 A. Current
value for a depth of 0.5 m is 922.63 A. Current carrying capacity of the buried cable to a
depth of 0.5 m is about 32 A more than current carrying capacity of the buried cable to a
depth of 1 m.
So far, it was assumed in the calculations that the wind speed was zero and the convection is
the result of the temperature difference. In this section, the effect of change in wind speed on
temperature distribution of buried cables has been investigated. Insulator temperatures
have been calculated for the different wind speeds changing in the range of 1-10 m/s at each
of burial depth by considering the current values that make the insulator temperature 90
o
C
as constant value. As shown in Fig. 12, the increasing wind speed contributes to the cooling
of the cables. In this case, the cable temperature will drop and small increase will be seen in
the current carrying capacity.
Surface: Temperatue [K]; Vertical: Temperature [K]
Contours: Temperature [K]
Coupled Electrical and Thermal Analysis of Power Cables Using Finite Element Method
217
Fig. 11. Variation of temperature as a function of current in different buried depth.
The average wind speed for Istanbul is 3.2 m/s. (Internet, 2007). By taking into account this
value, the temperature of the cable buried at 1 m depth will decrease about 0.8
o
C, while the
temperature of the cable buried at 0.5 m depth will decrease about 2
o
C. This decrease for the
cable buried at a depth of 0.5 m means the cable can be loaded 11 A more.
3.1.6 Relationship between cable temperature and cable life
In this section, the life of three exactly same cables laid side by side at a depth of 1 m has
been calculated by using the temperature values determined in section 3.1.2 and 3.1.3.
Decrease in the value of thermal conductivity of the soil and distance between the cables
results in significant increase in temperature of the cables and consequently significant
decrease in their current carrying capacities. This condition also reduces the life of the cable.
Fig. 12. Variation of temperature of the cable insulation with wind velocity.
Temperature [K] & Current [A]
Current [A]
Temperature [K]
1 m
0.7 m
0.5 m
Heat Transfer – Engineering Applications
218
In order to see the borders of this effect, cable life has been calculated for both cases by using
the equation (6) and the results are indicated in Fig. 13 and Fig. 14. Activation energy of 1.1
eV for XPLE material, Boltzmann constant of 8.617·10
-5
eV/K was taken for the calculations
and it is assumed that the life of XPLE insulated power cable at 90
o
C is 30 years. The
relationship between the cable distances and life of cables for three different soil thermal
conductivities has been shown in Fig. 13. As it is seen from the figure, cable life decreases
Fig. 13. Variation of the cable life as a function of distance between the cables in different
thermal conductivities of the soil.
Fig. 14. Variation of the cable life as a function of thermal conductivity of the soil.
linearly depending on decrease in distance between the cables. In this analysis, the currents
in the cables were assumed to be constant values and the cable temperatures (changing with
0.4 0.5 0.6 0.7 0.8 0.9 1
0
1000
2000
3000
4000
5000
6000
7000
8000
9000
10000
11000
12000
Isil iletkenlik [W/Km]
Kablo Ömrü [gün]
Thermal conductivity [W/Km]
Cable life [days]
0 0.005 0.01 0.015 0.02 0.025 0.03 0.035 0.04
0
1000
2000
3000
4000
5000
6000
7000
8000
9000
10000
11000
12000
Kablolar arasi mesafe [m]
Kablo ömrü [gün]
k = 1 W/Km
k = 0.9 W/Km
k = 0.8 W/Km
Distance between the cables [m]
Cable life [days]
Coupled Electrical and Thermal Analysis of Power Cables Using Finite Element Method
219
the cable distances) obtained from the numerical solution, were used for the calculation of
cable’s life. A decrease of 0.5 cm at cable distances leads to loss of 1000 days in the cable life
when the thermal conductivity is 1 W/Km, as it is seen from the figure.
The life of cables laid side by side with a one diameter distance has been calculated in
another analysis, depending on the change in the thermal conductivity of soil and given in
Fig. 14. As a result of this analysis, in which the current values were assumed to be constant,
it was seen that cable life increases logarithmically depending on the increase in the thermal
conductivity of the soil. As it is seen from the figure, 10% decrease in the thermal
conductivity of the soil results in 50% reduction in the cable life unless load conditions are
adjusted.
3.2 0.6/1 kV PVC cable model
3.2.1 Experimental studies
This section covers the experimental studies performed in order to examine the relationship
between current and temperature in power cables. For this purpose, current and also
conductor and sheath temperatures were recorded for a current carrying low voltage power
cable in an experiment at laboratory conditions and the obtained experimental data was
used in numerical modeling of that cable.
The first cable used in the experiment is a low voltage power cable having the properties of
0.6/1/1.2 (U0/Un/Um) kV, 3 x 35/16 mm
2
, 3
1/2
core (3 phase, 1 neutral), PVC insulated,
armored with galvanized flat steel wire, cross-hold steel band, PVC inner and outer sheaths.
The catalog information of this PVC insulated cable having 29.1 mm outer diameter specifies
that DC resistance at 20
o
C is 0.524 Ω/km and the maximum operating temperature is 70
o
C
(Turkish Prysmian Cable and Systems Inc.).
In order to examine the relationship between current and temperature in case of the power
cable in water and air, a polyester test container was used. During measurements, the cable
was placed in the middle and at a 15 cm distance from the bottom of the container. In the
first stage, current-temperature relation of the power cable placed in air was studied. The
experimental set-up prepared for this purpose is shown in Fig. 15.
Fig. 15. Experimental set-up for 0.6/1 kV cable.
Heat Transfer – Engineering Applications
220
The required current for the power cable has been supplied from alternating current output
ends of a 10 kW welding machine. Its the highest output current is 300 A. Current flowing
through the cable is monitored by two ammeters which are iron-core, 1.5 classes, and 150 A.
Output current is adjusted by use of a variac on the welding machine.
A digital thermometer having the properties of double input, ability to measure
temperatures between -200 and 1370
o
C, and ± (%0.1 rdg + 0,7
o
C) precision was used during
the measurements. Two K-type thermocouples can be used with the thermometer and this
enables to monitor the temperatures of different points simultaneously. These
thermocouples were used to measure the conductor and sheath temperatures of the cable.
Conductor and sheath temperatures were measured on cable components at a 50 cm
distance from the current source’s both ends in accordance with the defined temperature
measurement conditions in the Turkish Standard (TS EN 50393, 2006).
During the experiment phase conductors of the cable were connected to each other in serial
order and alternative current was applied. Throughout the experiments, cable conductor
and sheath temperatures at the point where the current source is connected to the cable and
also ambient temperature were recorded with an interval of 10 min. Fig. 16 indicates the
variations of current applied to the cable; the cable and ambient temperatures with time.
Fig. 16. Variations of current applied to the cable; the cable components and ambient
temperatures with time
Conductor and sheath temperatures in the figure are the average of the values obtained
from the both measurement points. In order to find the current carrying capacity of the
cable it was starded with a high current value and then current was adjusted so that the
conductor temperature can be kept constant at 70
o
C. After almost 3 hours later the current
and cable temperatures were stabilized. In that case, the cable was continued to be
energized for another 2 hours. The highest current value that cable can carry in steady
state operation was found to be 132 A, as it was in agreement with the defined value in
the catalog of that cable.
0 50 100 150 200 250 300
120
140
160
180
200
Zaman [dakika]
Akim [A]
0 50 100 150 200 250 300
20
40
60
80
Zaman [dakika]
Sicaklik [C]
iletken kilif ortam
Temperature [K]
Time [min]
Time [min]
Current [A]
conductor sheat
h
ambient
Coupled Electrical and Thermal Analysis of Power Cables Using Finite Element Method
221
As a second stage, first of all it was waited almost 3 hours for cooling of the cable warmed
up during the measurements and then it was started to study the current-temperature
relation of the cable that is under water. At this stage, test container was completely filled
with water and 2.5 m of 4 m cable was immersed in water placing it at a distance of 35 cm
from the water surface.
As it was performed earlier in the case where the power cable was in air, the current value
that makes the conductor temperature 70
o
C was tried to be found and the cable was run at
that current value for a certain time. The conductor and sheath temperatures were measured
from the sections which are out of water, as it was explained above; at a 50 cm distance from
the current source’s both ends. Water temperature was also monitored to see the effect of
current passing through to cable on the surrounding environment. Fig. 17 indicates the
variations of current applied to the cable; the cable components, the ambient, and the water
temperatures with time.
Fig. 17. Variations of current applied to the cable; the cable components, the ambient, and
the water temperatures with time
As shown in Fig. 17, the conductor and the sheath temperatures have reached steady state
values at the end of nearly two-hour work period. The average current value for the stable
operation state is approximately 135 A. The current value that was obtained in the case
where substantial portion of cable was immersed in water is a few amps higher than that of
air environment.
3.2.2 Numerical solution
Cross section of 0.6 / 1 kV power cable is shown in Fig. 18. In the figure, O shows the center
of the cable, O
1
and O
2
indicate the centers of the phase and neutral conductor, respectively.
The radiuses of the other cable components are given in Table 5.
Numerical solution of the problem has two-stages. The numerical model of the power cable
was created firstly for the air configuration, secondly for the water configuration and the
steady-state temperature distributions were determined.
0 50 100 150 200 250 300
130
140
150
160
Zaman [dakika]
Akim [A]
0 50 100 150 200 250 300
20
30
40
50
60
70
80
Zaman [dakika]
Sicaklik [K]
iletken kilif ortam su
Temperature [K]
Time
[
min
]
Time
[
min
]
Current [A]
conductor sheat
h
ambient water
Heat Transfer – Engineering Applications
222
Fig. 18. View of 0.6/1 kV, 3 x 35/16 mm
2
, PVC insulated power cable.
Cable Components Radius (mm)
Phase conductors (r1) 3.8
Neutral conductor (r2) 2.6
Filling material (r3) 11.5
Armour (r4) 12.5
Outer sheath (r5) 14.5
Table 5. Radiuses of the cable components.
The first step of finding the temperature distrubiton of a power cable in air is to create the
geometry of the problem. The problem was defined at 2 x 2 m solution region, where the
cable with the given properties above was located. After creating the geometry of the
problem, thermal parameters of the cable components and the surrounding environment are
defined as given in Table 6.
Cable Material
Density ρ
(kg/m
3
)
Thermal Capacity
c (J/kg·K)
Thermal Conductivity
k (W/K·m)
Conductor (copper) 8700 385 400
Insulator (PVC) 1760 385 0.1
Armour (steel) 7850 475 44.5
Air 1.205 1005
k_air()
Table 6. Thermal parameters of the cable components.
Thermal conductivity of air varies with temperature. As shown in Fig. 19, the thermal
conductivity of air increases depending on the increasing temperature of the air (Remsburg,
2001).
This case, which depends on increased temperature of power cables, provides better
distribution of heat to the surrounding environment. By including the values given in Table
7 in the cable model, intermediate values corresponding to change in the air temperature
have been found.
Copper conductor
PVC insulation
PVC filler
Steel wire armour
PVC outer sheath
Coupled Electrical and Thermal Analysis of Power Cables Using Finite Element Method
223
Fig. 19. Variation of thermal conductivity of air with temperature.
Temperature
(
o
C)
Thermal Conductivity
(W/mK)
0
20
40
60
80
100
0.0243
0.0257
0.0271
0.0285
0.0299
0.0314
Table 7. Variation in thermal conductivity of air with temperature.
The most important heat source for the existing cable is the ohmic losses formed by
current flowing through the cable conductors. The equation of P = J
2
/ σ is used to
calculate these losses. Ohmic losses in the conductor are described as "(132/(pi * 0.0038
2
))
2
/condCu” (W/m
3
)(132/(pi * 0.0038
2
))
2
/ condCu” (W/m
3
). In this equation, condCu
expression is the value of the electrical conductivity of the material, and it is a
temperature-dependent parameter as shown in equation (4).
At the last step of the numerical analysis, the boundary conditions are indicated. Since the
cable is located in a closed environment, free convection is available on the surface of the
cable. Equation (7) is used to calculate heat transfer coefficient, and the wind speed is
assumed as zero. The temperature of the outer boundary of the solution region is defined as
constant temperature. This value is an average ambient temperature measured during the
experiment (297.78
o
K) and it was added to the model.
After all these definitions, the region is divided into elements and the numerical solution is
performed. The entire region is divided into 7212 elements. As a result of numerical analysis
performed by using finite element method, the temperature distribution in and around the
cable, and equi-temperature lines are shown in Fig. 20 and Fig. 21, respectively.
0 10 20 30 40 50 60 70 80 90 100
0.024
0.025
0.026
0.027
0.028
0.029
0.03
0.031
0.032
Sicaklik [C]
Isil iletkenlik [W/mK]
Thermal conductivity [W/Km]
Temperature [C]