Hydrodynamics Optimizing Methods and Tools Part 12 pptx
Bạn đang xem bản rút gọn của tài liệu. Xem và tải ngay bản đầy đủ của tài liệu tại đây (6.84 MB, 30 trang )
Hydrodynamics – Optimizing Methods and Tools
318
303 313 323 333 343 353
0
100
200
300
400
500
Feed temperature, T
F
[K]
Permeate flux, J [dm
3
/m
2
d]
vertical
orthogonal
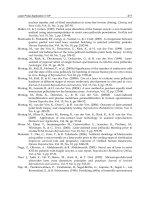
Fig. 7. Influence the position of MD module (vertical or orthogonal) on the permeate flux in
the case, when inert gas is accumulated inside the module shell
The problem of inert gases can be solved in a simple way when an additional port-valve is
added to the upper part of housing of vertically positioned module (Fig, 8). It enables the
removal of inert gases accumulated in the shell of the module. This prevents a decline of the
permeate flux and the module efficiency was progressively increased along with increase of
feed temperature (Fig. 9). Similarly as before (Fig. 5), the permeate flux for the counter-
current flow was only slightly larger than that obtained for the co-current flow. For this
reason, it is advantageous to eliminate gas accumulation in the module channels using co-
current flow (Gryta, 2005b). In this case the MD module is vertically positioned, and the
streams of feed and distillate flows upwards in the module. This allows to remove the
bubbles of inert gases formed from MD module in a natural way.
GAS
FEED
DISTILLATE
Fig. 8. The design of module head enables to remove inert gas from module shell
The Influence of the Hydrodynamic Conditions on the Performance of Membrane Distillation
319
- counter-current
- co-current
T
D
= 293 K
320 325 330 335 340 345
100
200
300
400
500
Permeate flux, J [dm
3
/m
2
d]
Feed temperature, T
F
[K]
Fig. 9. Influence the feed temperature and direction of streams flow inside the MD module
on the permeate flux
2.3 Hydrodynamic entrance length
The distance from the channel inlet to the point of the stabilization of laminar velocity
profile is defined as the hydrodynamic entrance length (marked as “L
H
”) (Andersson &
Irgens, 1990; Chu-Lien et al., 2010; Doughty & Perkins, 1970; Zhang et al., 2010). Different
correlations for the calculation of the Nusselt number are presented in literature for entrance
and fully developed flow regions (Gryta et al., 1997, 1998). In the membrane systems often
the laminar flow is applied. The membrane modules are relatively short; therefore, the flow
development in the entrance region cannot be sometimes omitted. It will be suitable only in
the case, when the ratio of the entrance region to the total membrane area is low.
Heat and mass transfer in membrane-formed parallel-plates channels play a key role for
performance analysis and system design. The streams flow in the plate-and-frame module is
similar to laminar flow inside the rectangular channel. Therefore, the calculation of L
H
entrance length can be made based on the Navier-Stokes equations (Bennett & Myers, 1962;
Zhang et al., 2010). For the symmetric channels the growing of hydrodynamic boundary
layer is completed when the axial line of duct is reached. The solution of Navier-Stokes
equations for the flow between the parallel walls is given by Howarth, and for this case we
have (Bennett & Myers, 1962):
L
H
=0.015 Re h
(9)
where h is a high of channel.
A similar relation for analysis of flow inside the broad rectangular channel was obtained, but
the coefficient value was 0.04 (Prandtl, 1949). The correlation allowing to calculate the L
H
value
for the flow in tubes have a similar form to that presented by equation (9). Most frequently the
value of this coefficient is given as equal to 0.03 or 0.0575, whereas the Re number is
determined for an average flow rate in the tube. The permeate flow through the porous wall
influenced on the velocity profile, however, for most membrane processes (wall Re <1) the
analytical solution is sufficient because the symmetric radical of velocity profiles exists.
Hydrodynamics – Optimizing Methods and Tools
320
Parallel-plates channels are the most common structure for plate-and-frame modules. They
are simple, and easy to assemble. In plate-and-frame modules usually occur a number of
smaller parallel channels instead of one wide channel (Gryta et al., 1997). This caused, that the
interaction of side walls also have the influence on the formation of velocity profile. The
studies carried out to determine the L
H
value for a channel with width 45 mm and height
respectively: 5, 10 and 15 mm gave different results in a comparison with those calculated
from Eq.(9). The velocity parabolic profile in XY plane (flow only between parallel plates) was
formed earlier, and the observed side–walls effect increases with increasing L
H
values. Due to
the side-walls interactions, the hydrodynamic entrance length was established faster, and
indicated nonlinear function (Fig. 10). In the rectangular channel the created temporary
parabolic profile (plane XY) was transformed into the deformed parabolic profile (plane XYZ).
0 0.004 0.008 0.012 0.016
0
0.02
0.04
0.06
0.08
0.10
channel height [m]:
- 0.005
- 0.010
- 0.015
Flow rate, v [m/s]
Hyd. entrance length, L
H
[m]
Fig. 10. Variation of hydrodynamic entrance length with flow rate (profile formed in XY
plane). Lines – calculated from Eq. (9) described the flow between parallel plates.
According to the theory of boundary layer, the entrance length L
H
is dependent as follows:
L
H
=f(v
A
, , a, h)
(10)
where a is the channel width, v
A
and are average flow rate and kinematic viscosity,
respectively. Taking into consideration a non-linear form of function and the dimensional
analysis, the expected function can be expressed as:
b2
Hh
a
L=b1 Re d
h
(11)
where d
h
is hydraulic diameter.
The b1 and b2 coefficients were estimated from the Levenberg-Marquardt Method with
minimization of sum of the square deviation. Two hundred of measuring points were used
for this analysis. The Snedecors test (F) for significations correlation study has been applied
(Volle, 1969). The significance of coefficients study was carried out using Student test (t). In
the both tests the signification level has been taken as =0.05. The obtained function was as:
0.5
Hh
a
L = 0.069 Re d
h
(12)
The Influence of the Hydrodynamic Conditions on the Performance of Membrane Distillation
321
The calculated values of squared coefficient of variation for this equation was 0.95.
The results presented in Fig.11 indicated, that the correlation between experimental and
calculated data is very good. This confirmed the usefulness of proposed Eq. (12) to calculate
the hydrodynamic entrance length under a laminar flow inside the rectangular channel. An
estimation of L
H
values gives possibility to calculate the area of entrance region for the plate
and frame modules (Zhang et al., 2010).
0 0.004 0.008 0.012 0.016
0
0.02
0.04
0.06
0.08
0.10
0.12
channel height [m]:
- 0.005
- 0.010
- 0.015
Hyd. entrance length, L
H
[m]
Flow rate, v [m/s]
Fig. 11. Variation of hydrodynamic entrance length with velocity for water flow inside
rectangular channel (velocity profile formed in XYZ plane). Lines – calculated from Eq. (12)
3. Membrane modules for MD process
The availability of the industrial MD modules is currently one of the limitations for MD
process implementation. Flat-sheet membranes in plate-and-frame modules or spiral wound
modules and capillary membranes in tubular modules have been used in various MD
studies (Gryta et al, 2000; Schneider et al., 1988). The design of the MD modules should
provide not only good flow conditions, but also has to improve the heat transfer and
thermal stability (Teoh et al., 2008; Srisurichan et al., 2006; Phattaranawik et al., 2003).
3.1 Capillary MD modules
The capillary membrane module is a bundle of porous capillaries packed into a shell similar
in configuration to a tube-and-shell heat exchanger (Ju-Meng et al., 2004; Schneider et al.,
1988). Because of their very high rate of mass transfer, the capillary modules have been used
in many practical applications, such as liquid/liquid extraction, artificial kidney, and
desalination studies (Singh, 2006). As a thermally driven process, MD can be significantly
affected by temperature polarization (Alklaibi & Lior, 2005; El-Bourawi et al., 2006, Su et al.,
2010). Among various types of membrane modules, the capillary module shows the least
temperature polarization, so it must have a great future in this field (Zhongwei et al., 2003).
In a capillary module used in MD process, the fluid temperatures and transmembrane flux
may vary axially alongside the module (Gryta, 2002b). Usually, the feed flows inside the
capillary lumen, and distillate flows on the shell side. Theoretically, the capillaries in a
bundle can be packed regularly across the shell of a module as in tube-and-shell heat
Hydrodynamics – Optimizing Methods and Tools
322
exchanger. In most industrial modules, however, the distribution of capillary is far more
arbitrary; the capillaries are randomly packed in the shell. This leads to a range of duct sizes
and shapes in the shell, or the module shows a certain extent variation of the local packing
fraction (Gryta et al., 2000, Ju-Meng et al., 2004; Zhongwei et al., 2003). The vast majority of
the MD processes occur in the regions with the local packing fraction, φ between 0.3 and 0.6.
Production rate (93%) of the module is from these regions, and they occupy only 75% of the
overall membrane area of the module. In the regions with φ larger than 0.6, the distillate
flow rates are too much smaller than that of the feed, so their temperatures are very close to
that of the feed. This means that more than 20% of the feed stream goes through the module
almost without any driving force for MD process, so the associated membrane area, more
than 20% of the total, is ineffective (Ju-Meng et al., 2004).
A dislocation of the membranes can be limited using a high value of packing fraction φ.
However, this caused a reduction of the channel dimensions on the shell side and the
increase in the flow resistance, which hinders the application of appropriate high flow rate
of distillate. This is an important aspect, because when the distillate flow rate increases, its
temperature will become less affected by heat transfer and vapor condensation from the
feed side of the membrane, and so does the feed stream. This means that the increment of
flow rates can enlarge the temperature difference between these two streams in the module,
and in this way the MD process is improved (Zhongwei et al., 2003).
With regards to this, a value of the φ coefficient in MD modules should amount to 0.4-0.6
(Gryta et al., 2000; Ju-Meng et al., 2004; Schneider et al., 1988). In order to limit the changes
of capillaries arrangement inside the shell, one should use such assembly of capillaries,
which prevents their free displacements. Good results have been obtained by assembling the
membrane capillaries inside the sieve baffles or by a tight packing of membranes in a form
of braided capillaries (Gryta et al., 2000; Schneider et al., 1988). A comparison of results
obtained for the module having the same value of φ coefficient equal to 0.33, but differing in
the manner of membranes assembling is presented in Fig. 12. A traditional construction
(module M1) based upon the fixation of a bundle of parallel membranes solely at their ends
330 340 350 360 370
0
100
200
300
400
500
module:
- M1
- M2
- M3
Permeate flux, J [dm
3
/m
2
d]
Feed temperature, T
F
[K]
Fig. 12. The influence of feed temperature and the mode of membrane arrangement in a
capillary module on the permeate flux. M1 - bundle of parallel membranes; M2 - braided
capillaries; and M3 – capillaries mounted inside mesh of sieve baffles
The Influence of the Hydrodynamic Conditions on the Performance of Membrane Distillation
323
results in that the membranes arrange themselves in a random way. This creates the
unfavorable conditions of cooling of the membrane surface by the distillate, which resulted
in a decrease of the module efficiency (Gryta et al., 2000; Schneider et al., 1988; Zhongwei et
al., 2003). In module M3 the membranes were positioned in every second mesh of six sieve
baffles, arranged across the housing with in 0.1–0.15 m. The most advantageous operating
conditions of MD module were obtained with the membranes arranged in a form of braided
capillaries (module M2). This membrane arrangement improves the hydrodynamic
conditions (shape of braided membranes acted as a static mixer), and as a consequence, the
module yield was enhanced (Gryta et al., 2000)
A good indicator of the hydrodynamic conditions in a module is the analysis of residence
time distribution (RTD). The value of liquid flowing time through the module with good
design solution should be closed to the RTD value. The effect of shell-side residence time
distribution on mass transfer performance was studied (Lemanski & Lipscomb, 1995). It
was pointed out that plug flow would be obtained in an ideal hollow fiber module, but in
real shell-side flow the distribution of fluid across the capillary bundle tended to broaden
the RTD.
The studies of residence time distribution for a colored impulse in the modules M1-M3
were shown in Figs. 13-14. The RTD value was calculated for assumed plug flow, taking
into account a value of φ=0.34. A dye injected into the module appeared the fastest at the
outlet of module in the case of module M1 (bundle of parallel capillaries), moreover, the
residence time of dye in this module was also the longest. Such result indicates that the non-
uniform distribution of capillaries inside the shell caused the formation of channels with
different diameters. The distillate was flowing faster in wider channels than the calculated
average velocity. As a result, colored water was out flowing faster from the module exit
than the calculated RTD value.
0 0.1 0.2 0.3
0.4 0.5 0.6 0.7
0.6
0.7
0.8
0.9
1.0
Flow rate, v [m/s]
module:
- M1
- M2
- M3
Relative time, t/t
RTD
Fig. 13. The influence of flow rate on the relative initial time of colour water residence inside
the module. M1 - bundle of parallel membranes; M2 - braided capillaries; and M3 –
capillaries mounted inside mesh of sieve baffles
Hydrodynamics – Optimizing Methods and Tools
324
0 0.1 0.2 0.3
0.4 0.5 0.6 0.7
1.0
1.2
1.4
1.6
1.8
2.0
2.2
-M1 -M2 -M3
Flow rate, v [m/s]
Relative time, t/t
RTD
Fig. 14. The influence of flow rate on the total time of dye residence inside the module. M1 -
bundle of parallel membranes; M2 - braided capillaries; and M3 – capillaries mounted inside
mesh of sieve baffles
As a result of larger values of local capillary packing, the water flows slower in the narrow
channels (larger resistance of flow), what prolonged the residence time of dye in the
module. An increase in the flow rate increases the turbulence of water flow in the module
and dye was washing out faster also from the narrow channels. Due to, the residence time of
liquid in the module for larger velocities was closer to the average value. The housings of
modules M1-M3 were made of glass tube. This enables the observation of dye spreading out
inside their interior. The visual observations of colored streams confirmed these conclusions.
The time of water flow in the two remaining modules (M2 and M3) was definitely closer to
the RDT value. This indicates, that the dimensions of channels between the capillary
membranes had the similar dimension and liquid flows uniformly through the module
cross-section. The visual observations also confirmed this fact; dye was uniformly filling up
the housing space. The situation was different in the case of module M1, where due to
differences in the flow rates, preceded diversity in the intensity of water coloration.
A prolongation of residence time of dye in the module was observed at the flow rates higher
than 0.5 m/s. This was associated with growing intensity of liquid mixing in their internal.
It was observed, that the vortexes appeared along with the increase in the flow rates. As a
result, the portion of colored water were backward transferred, what caused the coloration
of new portion of water and due to growing volume of colored water, an apparent longer
time of residence in the module was noticed.
3.2 Module with flat sheets membranes
The flat sheet membranes are used in the plate-and-frame modules and spiral-wound
module design. In the first case, the flat sheet membranes are assembled between the plates
having several channels. The membranes are stacked in flow channels connected in series or
in parallel. Usually, the plates are rectangular with the flow from one end to the other. The
spiral-wound module uses the flat sheet membranes wound around a central tube. The
membranes are glued along three sides to form “leaves” A feed channel spacer (a net-like
sheet) is placed between the leaves to define the channel height. A three-channel design can
be used in the spiral wound module, which allows the recovery of heat transferred from the
feed to distillate (Fig.15).
The Influence of the Hydrodynamic Conditions on the Performance of Membrane Distillation
325
feed
273 K
distillate
retentate
300 K
346 K
353 K
external
heat source
MD
module
heat
Fig. 15. Module channel arrangement for permeate gap membrane distillation (Winter et al.,
2011)
Based on this solution, spiral wound MD modules with a 5-14 m
2
effective membrane area
have been developed by Fraunhofer Institute for Solar Energy System (Winter et al., 2011).
The cold feed water enters the condenser channel and is heated to approximately 346 K
due to internal heat recovery. An external heat source (e.g. solar collector) heats the feed
water up to 353 K. The hot feed flows through the evaporator channel in a counter-current
direction and exits the module at 300 K. Water vapour passes through the membrane and
condenses in the distillate channel. The latent and sensible heat is transferred through the
condenser foil to preheat the feed water in the condenser channel. Due to increasing flow
resistance, a fast feed flow cannot be used in such a module. As a result, decreasing the
vapour pressure with salinity reduces the process driving force. The feed water salinity is
considered one of the most important parameters affecting the spiral wound module
concept. Larger flow velocities can be used in the plate-and-frame module than in the
spiral wound modules. Therefore, the plate-and-frame modules can be utilized for the
separation of concentrated salt solutions. The channels in the plate-and-frame modules
are shorter; and as a result, an excessive increase of hydraulic pressure is limited. For this
reason, several authors suggest the use of spacers as the turbulence promoters (Chu-Lien
et al., 2010, Martínez & Rodríguez-Maroto, 2006), because turbulent flow is an appropriate
method to decrease the negative effect of polarization phenomena. The turbulent or upper
transition flow regime was found in the spacer-filled channels for UF although the
Reynolds numbers were still in the laminar regime (Phattaranawik et al., 2003). Net-type
spacers are often put into the flow channels in the membrane processes to improve the
mass transfer and to reduce the effect of concentration polarization and fouling. The
spacers can also be utilized in MD since they destabilize the flow and create eddy currents
in the laminar regime so that heat, and mass transfer are enhanced (Teoh et al., 2008;
Phattaranawik et al., 2003).
The permeate fluxes obtained from the experiments with spacer-filled channels were
compared with those obtained in the experiments performed under laminar and turbulent
flow conditions, but for modules with non-filled channels. In the case of experiments with
the spacers, a 26–56% increase in the permeate fluxes was achieved, compared with the
fluxes performed under laminar flow (Martínez & Rodríguez-Maroto, 2006). However, these
fluxes were much lower than those obtained from turbulent flow conditions in the empty
channels. This results from the fact, that the feed evaporates during the flow through a
module, causing a relatively fast decrease of the feed temperature, which reduces a value of
driving force for mass transfer. Thus, in the MD process both the value of the flow rate
(m/s) and the volumetric flow (m
3
/s of feed per unit of the membrane area) have a
considerable importance. A sufficiently large value of heat transfer coefficient (e.g. 5000
W/m
2
K) allowing to eliminate the temperature polarization, can be generated for laminar
Hydrodynamics – Optimizing Methods and Tools
326
flow (Gryta, 2002b). Although a further increase in the flow rate will not have a substantial
influence on the reduction of the temperature polarization, the value of volumetric flow
(m
3
/s m
2
) will increase significantly, and beneficial results, such as enhancement of the
permeate flux, will be obtained.
The nets exhibit the filtration properties, which hinder the use of modules with the channels
filled with the nets in certain applications (Fig.16).
Fig. 16. SEM image of deposit formed inside the net supporting the membrane in the MD
module
The concentration of non-clarified juices cannot be carried out with the utilization of such
modules (Jiao et al., 2004). The desalination process of hard water, in which significant
amounts of CaCO
3
precipitates are formed (Gryta, 2005a, 2006b), can be another negative
exemplary. As demonstrated the nets, favors the hydrogenous crystallization (Gryta, 2009),
which would increases the intensity of scaling in the module.
The flat sheet membranes exhibit a low resistance to mechanical damage; therefore, they are
reinforced by the application of supporting nets. However, the presence of nets decreases
the heat and mass transfer to membrane surfaces, while significantly enhancing the
polarization phenomena. These phenomena reduce the difference between T
1
and T
2
interfacial temperatures (Fig. 1), compared to the design when no net was used.
Consequently, the driving force for mass transfer is also reduced in the case of net
supported membranes. Therefore, a module design in which a part of channel is empty,
while a part is filled by net supporting the membrane, significantly influenced reduction of
MD efficiency (Gryta et al., 1997).
The module performance can be improved by elimination of nets and by an increase of the
number of channels on a module plate so that their walls fill the role of edges supporting the
membrane (Fig. 17). It was found that an arrangement of edges every 15-20 mm was
appropriate for the membranes made of PVDF and PTFE with the thickness of 100-150 m
(Gryta et al., 1997; Tomaszewska et al., 2000).
The Influence of the Hydrodynamic Conditions on the Performance of Membrane Distillation
327
A-A
B-B
A
B
B
2
1
7
6
5
4
3
A
3 6
5 7
6
4
7
2
3
Fig. 17. Plate-and –frame MD module design. 1 – module plate, 2 – inlet channel, 3 – outlet
channel, 4 – lateral feeding channel, 5 – distribution channels, 6 – edges supporting the
membrane, 7 – o-ring
The individual plates of the module possess a series of channels connected most frequently
with one feeding channel. As the pressure in this channel increases along with the increase
in the flow rate, it may lead to membrane damage in this region. This problem was solved
by placing an inlet opening of feeding channel below a plane of the distribution channels,
which were connected by an additional lateral channel (Fig.17). As a result, liquid with large
velocity flew out from the inlet channel and spreads on sides in the lateral channel. As its
cross-section is several times larger, liquid flow rate slows down and flows into the
distribution channels with a lower energy (Fig. 18).
A visualization of feed flow in the distribution channel of the plate-and–frame module with
a central one-point feeding of the plate was shown in Fig. 19.
Fig. 18. The schema of water flow inside the distribution channel of the plate-and-frame
module presented in Fig. 17
Hydrodynamics – Optimizing Methods and Tools
328
Fig. 19. A visualization of feed flow in the distribution channel
3.2.1 Uniformity of flow
In the capillary modules good conditions of mixing and a flow close to plug flow can be
achieved by using an appropriate design, e.g. by assembling the braided capillaries.
However, the achievement of uniform flow of liquid throughout the entire cross-section of
plate-and-frame modules is definitely more difficult. As a rule, one can expect different flow
rates in the particular channels. The studies have demonstrated that this variability is
dependent not only on the location of channels, but also on the rate of module feeding. A
visualization of variations in the flow rates of liquid in the particular channels of the module
with a central one-point feeding of plate was shown in Figs. 19 and 20. The larger is the
fraction of a given channel filled with colored water, the larger is the flow rate of liquid in
this channel (relative for each case). In these studies, a module was feed with a flow rate of
0.1-0.86 dm
3
/min, which corresponds to the average flow rate of 0.007-0.06 m/s. The
obtained results indicate that the highest flow rate was achieved in the terminal channels,
whereas the lowest rate was obtained in the module axis. This tendency was growing along
with an increase in the supply flow. Most likely, a slight increase in the middle channel
width would reduce the flow rate resistance, and as a result, cause a larger uniformity of
flow rate distribution across the entire plate of the module.
A) feeding 0.1 dm
3
/min B) feeding 0.21 dm
3
/min
The Influence of the Hydrodynamic Conditions on the Performance of Membrane Distillation
329
C) feeding 0.44 dm
3
/min D) feeding 0.86 dm
3
/min
Fig. 20. Visualization of variations in the flow rates of water (302 K) in the particular
channels of the module (channel dimension 6x3.9 mm) with a central one-point feeding of
plate
A substantial improvement in the flow uniformity was achieved when the water was feed
into the feeding channel in two places (Fig. 21). In this case, the connections were
assembled in a distance of ¼ plate width from each end of the channel. The module was
A) feeding 0.1 dm
3
/min
B) feeding 0.21 dm
3
/min
Hydrodynamics – Optimizing Methods and Tools
330
C) feeding 0.44 dm
3
/min
D) feeding 0.86 dm
3
/min
Fig. 21. Visualization of variations in the flow rates of water (302 K) in the particular
channels of the module (channel dimension 10x3.5 mm) with a two-point feeding of module
plate
feeding with the flow rate of 0.1-0.86 dm
3
/min, which corresponds to the average flow rate
0.008-0.07 m/s. The presented pictures indicate that a velocity profile characteristic for the
laminar flow can be observed only for a very slow flow (0.008 m/s). An increase in the
uniformity of liquid coloration in the channels was observed at larger supply flows what
indicates for a flow close to the plug flow. Most probably this effect was obtained due to an
increase in the turbulent flow of liquid in the feeding channel. This may equalize the
hydraulic pressure along this channel, and cause liquid to flow more uniformly into the
distribution channels.
4. Conclusions
The driving force of MD depends, in a significant degree, on turbulence of stream flow in
the membrane module. Therefore, the hydrodynamic conditions existing in the module
have a large influence on the MD process efficiency. Just as in the modules used for
pressure-driven processes, it is important to minimize the flow resistance through the MD
module channels. However, the reason for this was different, because the pressure drop is
not limited, rather, the hydraulic pressure should be as low as possible, so as to restrict the
membrane wettability.
The maintenance of adequately high flow rates limits the concentration polarization and
fouling, but in the case of MD modules the magnitude of temperature polarization also has a
The Influence of the Hydrodynamic Conditions on the Performance of Membrane Distillation
331
substantial influence. The latter polarization can be significantly reduced when the flow
turbulence yield a heat transfer coefficient above 5000 W/m
2
K. This coefficient is affected by
the value of the flow rate as well as by the design of flow channels. The filling of channels
with nets or an arrangement of braided capillary membranes ensures an increase in the flow
turbulence and good conditions for heat transfer can be achieved at lower values of flow
rates. Therefore, in the case of MD modules construction, one should consider design
requirements typical for pressure driven membrane processes as well as a necessity to
ensure the appropriate conditions for heat transfer.
The efficiency of MD capillary modules is significantly affected by the manner in which the
membranes are arranged within a housing. A traditional construction based upon the
fixation of a bundle of parallel membranes solely at their ends causes that the membranes
arranged themselves in a random way. This creates unfavorable conditions of cooling of the
membrane surface by the distillate; hence, the module efficiency is reduced due to the
enhancement of temperature polarization. On the other hand, arranging the membranes in a
way to ensure a uniform distribution over the module cross-section (braided membranes or
supported by sieve baffles alongside module) increases the efficiency over 100%.
The feed temperature in MD module decreases due to the evaporation, which also causes a
reduction of MD driving force, besides the temperature polarization. Therefore, the
permeate flux can be increased several times when the feed outlet temperature is closed to
its inlet temperature, which is obtained by increasing the flow rate. The optimal value of the
flow rate for several studied modules amounts to 0.6–1 m/s and 0.4–0.7 m/s for feed and
distillate, respectively.
5. References
Alklaibi, A.M. & Lior, N. (2005). Membrane-distillation desalination: status and potential,
Desalination, Vol.171, No.2, (January 2005), pp. 111–131, ISSN 0011-9164
Andersson, H.I. & Irgens, F. (1990) Hydrodynamic entrance length of non-newtonian liquid
films. Chemical Engineering Science, Vol.45, No.2, (January 1990), pp. 537–541, ISSN
0009-2509
Banat, F. & Jwaied, N. (2008). Economic evaluation of desalination by small-scale
autonomous solar-powered membrane distillation units. Desalination, Vol.220,
No.1-3, (March 2008), pp. 566–573, ISSN 0011-9164
Bennett, C.O. & Myers, J.E. (1982). Momentum, heat and mass transport (3 rd ed.), Mc Grow-
Hill Book Company, ISBN 0070046719, New York, USA
Bonyadi, S. & Chung, T.S. (2009). Highly porous and macrovoid-free PVDF hollow fiber
membranes for membrane distillation by a solvent-dope solution co-extrusion
approach, Journal of Membrane Science, Vol.331, No.1-2, (April 2009), pp. 66–74, ISSN
0376-7388
Bui, V.A.; Vu, L.T.T. & Nguyen, M.H. (2010). Simulation and optimization of direct contact
membrane distillation for energy efficiency. Desalination, Vol.259, No.1-3,
(September 2010), pp. 29–37, ISSN 0011-9164
Chu-Lien, L.; Yu-Feng, Ch.; Wen-Junn, S. & Chi-Chuan, W. (2010). Effect of flow deflector on
the flux improvement in direct contact membrane distillation. Desalination, Vol.253,
(April 2010), pp. 16–21, ISSN 0011-9164
Hydrodynamics – Optimizing Methods and Tools
332
Criscuoli, A.; Carnevale, M.C. & Drioli, E. (2008). Evaluation of energy requirements in
membrane distillation, Chemical Engineering and Processing, Vol.47, No.7, (July 2008),
pp. 1098-1105, ISSN 0009-2509
Drioli, E.; Curcio, E.; Criscuoli, A. & Di Profio, G. (2004). Integrated system for recovery of
CaCO
3
, NaCl, MgSO
4
·7H
2
O from nanofiltration retentate, Journal of Membrane
Science, Vol.239, No.1, (August 2004), pp. 27–38, ISSN 0376-7388
Doughty, J.R. & Perkins JR, H.C. (1970). Hydrodynamic entry length for laminar flow
between parallel porous plates. Journal of Applied Mechanics. Vol.37, (May 1970), pp.
548, ISSN 0021-8936
El-Bourawi, M.S.; Ding, Z.; Ma, R & Khayet, M. (2006). A framework for better
understanding membrane distillation separation process. Journal of Membrane
Science, Vol.285, No.1-2, (November 2006), pp. 4–29, ISSN 0376-7388
Gryta, M.; Tomaszewska, M. & Morawski, A.W. (1997). Membrane distillation with laminar
flow. Separation and Purification Technology, Vol.11, No.2, (June 1997), pp. 93–101,
ISSN 1383-5866
Gryta, M.; Tomaszewska, M. &. Morawski, W. (1998). Heat transport in the membrane
distillation process, Journal of Membrane Science, Vol.144, No.1-2, (June 1998), pp.
211–222, ISSN 0376-7388
Gryta, M.; Tomaszewska, M. & Morawski, A.W. (2000). A capillary module for membrane
distillation process, Chemical Papers, Vol.54, No.6a, (July 2000), pp. 370–374, ISSN
0366-6352
Gryta, M. (2002a). Direct contact membrane distillation with crystallization applied to NaCl
solutions, Chemical Papers, Vol.56, No.1, (January 2002), pp. 14–19, ISSN 0366-6352
Gryta, M. (2002b). Concentration of NaCl solution by membrane distillation integrated with
crystallization. Separation Science and Technology. Vol.37, No.15, (November 2002),
pp. 3535–3558, ISSN 0149-6395
Gryta, M. (2005a). Osmotic MD and other membrane distillation variants. Journal of
Membrane Science, Vol.246, No.2, (January 2005), pp.45–56, ISSN 0376-7388
Gryta, M. (2005b). Long-term performance of membrane distillation process, Journal of
Membrane Science., Vol.265, No.1-2, (November 2005), pp. 153–159, ISSN 0376-7388
Gryta, M. (2006a). Water purification by membrane distillation process, Separation Science
and Technology. Vol.41, No.9, (September 2006), pp. 1789–1798, ISSN 0149-6395
Gryta, M. (2006b). Heat efficiency of the capillary modules for membrane distillation
process, Inżynieria Chemiczna i Procesowa, Vol.27, No.1, (January 2006), pp. 305-314,
ISSN 0208-6425
Gryta M. (2006c). Deareation capillary modules during membrane distillation (in Polish).
Inżynieria i Aparatura Chemiczna, Vol.45, No.3, (June 2006), pp. 20–23, ISSN 0368-0827
Gryta, M. (2008). Fouling in direct contact membrane distillation process, Journal of
Membrane Science, Vol.325, No.1, (November 2008), pp. 383–394, ISSN 0376-7388
Gryta, M, (2009). Scaling diminution by heterogeneous crystallization in a filtration element
integrated with membrane distillation module, Polish Journal of Chemical Technology,
Vol.11, No.1, (February 2009), pp. 59–64, ISSN 1509-8117
Gryta, M. & Barancewicz, M. (2010). Influence of morphology of PVDF capillary membranes
on the performance of direct contact membrane distillation, Journal of Membrane
Science, Vol.358, No.1-2, (August 2010), pp. 158–167, ISSN 0376-7388
The Influence of the Hydrodynamic Conditions on the Performance of Membrane Distillation
333
Gryta, M. (2010a). Application of membrane distillation process for tap water purification.
Membrane Water Treatment, Vol.1, No.1 (January 2010), pp. 1-12, ISSN 2005-8624
Gryta, M. (2010b). Desalination of thermally softened water by membrane distillation
process. Desalination, Vol.257, No.1-3 (July 2010), pp. 30–35, ISSN 0011-9164
Jiao, B.; Cassano, A. & Drioli, E. (2004). Recent advanced on membrane processes for the
concentration of fruit juices: a review, Journal of Food Engineering, Vol.63, No.3
(August 2004), pp. 303–324, ISSN 0260-8774
Ju-Meng, Z.; Zhi-Kang, X.; Jian-Mei, L.; Shu-Yuan, W. & You-Yi, X. (2004). Influence of
random arrangement of hollow fiber membranes on shell side mass transfer
performance: a novel model prediction. Journal of Membrane Science, Vol.236, No.1-
2, (June 2004), pp. 145–151, ISSN 0376-7388
Karakulski, K.; Gryta, M. & Sasim,M. (2006). Production of process water using integrated
membrane processes, Chemical Papers, Vol.60, No.6, (November 2006), pp. 416–421,
ISSN 0366-6352
Khayet, M.; Godino, M.P. & Mengual, J.I. (2004). Study of asymmetric polarization in direct
contact membrane distillation, Separation Science and Technology, Vol.39, No.1
(January 2004), pp. 125–147, ISSN 0149-6395
Lawson, K.W. & Lloyd, D.R. (1997). Membrane distillation. Journal of Membrane Science,
Vol.124, No.1, (February 1997), pp. 1–25, ISNN 0376-7388
Lemanski, J. & Lipscomb, G.G.(1995). Effect of shell-side flows on hollow fiber membrane
device performance, American Institute of Chemical Engineering Journal. Vol.41,
No.10, (October 1995), pp. 2322–2326, ISSN 1547-5905
Li, B. & Sirkar, K.K. (2004). Novel membrane and device for direct contact membrane
distillation-based desalination process, Industrial Engineering Chemical Research,
Vol.43, No.17, (August 2004), pp. 5300–5309, ISSN 0888-5885
Martínez-Díez, L. & Vázquez-González, M.I. (1999). Temperature and concentration
polarization in membrane distillation of aqueous salt solutions, Journal of Membrane
Science, Vol.156, No.2, (April 1999), pp. 265–273, ISSN 0376-7388
Martínez, L. & Rodríguez-Maroto, J.M. (2006). Characterization of membrane distillation
modules and analysis of mass flux enhancement by channel spacers. Journal of
Membrane Science, Vol.274, No.1-2, (April 2006), pp. 123–137, ISSN 0376-7388
Phattaranawik, J.; Jiraratananon, R. & Fane, A.G. (2003). Heat transport and membrane
distillation coefficients in direct contact membrane distillation, Journal of Membrane
Science, Vol.212, No.1-2 (February 2003), pp. 177–193, ISSN 0376-7388
Prandtl, L. (1949). Fuhrer durch die Stromungslehre. Friedrich Vieweg u. Sohn, Braunschweig,
Germany
Schneider, K.; Hölz, W. & Wollbeck, R. (1988). Membranes and modules for transmembrane
distillation, Journal of Membrane Science, Vol.39, No.1, (October 1988), pp. 25–42,
ISSN 0376-7388
Singh, R (2006). Hybrid Membrane Systems for Water Purification, Elsevier, ISBN 1-856-17442-5,
Kidlington, UK
Schofield, R.W.; Fane, A.G.; Fell, C.J.D. & Macoun, R. (1990). Factors affecting flux in
membrane distillation. Desalination, Vol.77, (March 1990), pp. 279–294, ISSN 0011-
9164
Srisurichan, S.; Jiraratananon, R. & Fane, A.G. (2005). Humic acid fouling in the membrane
distillation, Desalination, Vol.174, No.1, (April 2005), pp. 63–72, ISSN 0011-9164
Hydrodynamics – Optimizing Methods and Tools
334
Srisurichan, S.; Jiraratananon, R. & Fane, A.G. (2006). Mass transfer mechanisms and
transport resistances in direct contact membrane distillation process, Journal of
Membrane Science, Vol.277, No.1-2, (June 2006), pp. 186–194, ISSN 0376-7388
Su, M.; Teoh, M.M.; Wang, K.Y.; Su, J. & Chung, T.S. (2010), Effect of inner-layer thermal
conductivity on .ux enhancement of dual-layer hollow .ber membranes in direct
contact membrane distillation. Journal of Membrane Science, Vol.364, No.1-2,
(November 2010), pp. 278–289, ISSN 0376-7388
Teoh, M.M.; Bonyadi, S. & Chung, T.S. (2008). Investigation of different hollow fiber module
designs or flux enhancement in the membrane distillation process, Journal of
Membrane Science, Vol.311, No.1-2, (March 2008), pp. 371–379, ISSN 0376-7388
Tomaszewska M.; Gryta, M. & Morawski, A.W. (2000). Mass transfer of HCl and H
2
O across
the hydrophobic membrane during membrane distillation. Journal of Membrane
Science, Vol.166, No.2, (February 2000), pp. 149–157, ISSN 0376-7388
Wang, K.Y.; Chung, T.S. & Gryta, M. (2008). Hydrophobic PVDF hollow fiber membranes
with narrow pore size distribution and ultra-thin skin for the freshwater
production through membrane distillation, Chemical Engineering Science, Vol.63,
No.9, (May 2008), pp. 2587–2594, ISSN 0009-2509
Winter, D.; Koschikowski, J. & Wieghaus, M. (2011). Desalination using membrane
distillation: Experimental studies on full scale spiral wound modules. Journal of
Membrane Science, Vol.375, No.1-2 (June 2011), pp. 104–112, ISSN 0376-7388
Volk, W. Applied statistics for engineers (1969), McGraw-Hill, ISBN 0070675511, New York,
USA
Zhang, L.Z.; Liang, C.H. & Pei, L.X. (2010). Conjugate heat and mass transfer in membrane-
formed channels in all entry regions. International Journal of Heat and Mass Transfer,
Vol.53, No.5, (February 2010), pp. 815–824. ISSN 0017-9310
Zhongwei, D.; Liying, L. & Runyu, M. (2003). Study on the effect of flow maldistribution on
the performance of the hollow fiber modules used in membrane distillation. Journal
of Membrane Science, Vol.215, No.1-2, (April 2003), pp. 11–23, ISSN 0376-7388
15
Gas Hydrate Formation Kinetics in Semi-Batch
Flow Reactor Equipped with Static Mixer
Hideo Tajima
Niigata University
Japan
1. Introduction
Gas hydrate is an ice-like solid and a kind of inclusion compounds of which the cage-like
structure formed by hydrogen-bonded water molecules can include various kinds of guest
gas molecules. In general, gas hydrates are formed with “host” water and “guest” gas
molecules under lower temperature and higher pressure conditions, but sometimes large
differences in the hydrate formation conditions are observed among guest gases. In such
cases, if gas hydrate is formed with such a gaseous mixture, it can be anticipated that the
component of which the hydrate formation condition is milder (that is, higher temperature
and lower pressure conditions relatively) could be enriched in the hydrate phase. Effective
gas separation, or higher selectivity, can be achieved for gas mixtures with larger differences
in the hydrate formation conditions. On the other hand, multi-component gas hydrates are
formed under higher pressure and lower temperature conditions in which any component
of gaseous mixture can change to hydrate.
Several applications have been proposed in environmental and energy fields by using the
inclusion abilities in the framework of gas hydrates; natural gas transport (Gudmundsson &
Børrehaug, 1996), gas storage (Lee et al., 2005), and gas separation (Kang & Lee, 2000) and so
on, and thus many investigations for gas hydrate formation, especially thermodynamics and
gas hydrate formation kinetics, have been carried out in batch systems. The solid hydrate
can be dissociated to recover a product gas. The selectivity and production rate are key
factors in determining the performance of hydrate-based applications. Although the
selectivity is limited by the thermodynamic equilibrium of the hydrate phase and the feed
vapour phase (Nagata et al., 2009), the production rate is dependant on the hydrate
formation rate and the system design.
Gas hydrate-based applications would require an efficient formation or production process
of gas hydrates, and the elucidation of the formation mechanism of gas hydrates. Gas
hydrate formation is similar to crystallization from liquid mixture, and gas-liquid system
changes to liquid-solid or gas-solid systems. In general, it is known gas hydrate forms on
gas-liquid interface, and thus the gas-liquid interfacial area, the driving force, and kinetic
constant can affect hydrate formation. Therefore, an efficient way to increase these factors is
necessary for continuously forming gas hydrate solid in gas-liquid system. For example,
several efficient processes to increase the interfacial area for gas hydrate formation have
been demonstrated, including a spray (Fukumoto et al., 2001) or jet reactor (Szymcek et al.,
2008; Warzinski et al., 2008), and a bubble column (Luo et al, 2007; Hashemi et al., 2009)
Hydrodynamics – Optimizing Methods and Tools
336
besides general stirred tank. However, gas hydrate formation is very complicated by the
presence of three phases (gas-liquid-solid) during gas hydrate formation; the formation of
solid (gas hydrate) can occur on gas-liquid (water) interface.
Although many investigations about gas hydrate formation have been published, this
chapter deals with gas hydrate formation kinetics with focusing on author’s research with a
semi-batch flow reactor equipped with static mixer. In the broad sense, this chapter will
cover the multiple flow and pipe flow. The gas hydrate formation is composed of two main
processes as well as crystallization; hydrate nucleation and hydrate growth processes. This
chapter focuses attention on the overall gas hydrate formation process, and thus discusses
the hydrate formation process based on the experimental data by varying thermodynamic,
mechanical, and chemical conditions.
2. Semi-batch flow reactor with static mixer
In author’s study, gas hydrate formation from gas-liquid fluids is carried out in Kenics static
mixer. Static mixers are motionless mixing devices with fixed “mixing elements” arranged
in a straight pipe. The Kenics static mixer experiments demonstrated that two fluids
(drop/bubble and water) are efficiently agitated with the mixing elements and are
subsequently converted to hydrate formed on the drop/bubble surface at specific
temperature and pressure conditions (Tajima et al., 2004, 2007). Several structures of mixing
element are designed for efficient agitation/mixing of fluids more than one. Compared with
stirred tank type mixers, static mixers also generally provide continuous operational
availability, small size and space requirements, flexibility in the process installation, and low
power requirements (Godfrey, 1997).
Fig.1 shows the author’s semi-batch flow reactor with static mixer for continuous gas
hydrate formation system. Kenics-type mixing elements of a stainless steel static mixer are
used. There are 24 mixing elements and these are inserted into a pyrex glass tube (455 mm,
i.d. 11.0 mm) for low pressure conditions (< 0.5 MPa) or into a stainless steel tube (same size
to glass tube) with a pyrex glass window for high pressure conditions (< 2.0 MPa). Static
mixer can achieve the mixing performance depending on the gas and water flow rates. The
target gas is injected with mass flow controller at the bottom of the reactor and the water
flow rate is operated with the water supply pump either counter or co-current to the gas
flow direction. At water flow rate of zero this system is regarded as a semi-batch system that
only the gas go in and out of the reactor. The injected gas is converted to gas hydrate in the
static mixer unit and unconverted gas is vented from at the top of the reactor. Transport of
formed hydrate particles are carried out with the water fluid, and the hydrate particles are
settled and separated at the recovery vessel. Water without large hydrate particle, therefore,
is always supplied to the reactor. The recovery vessel is set up in a manner to prevent the
gas hydrate blocking the gas supply nozzle or the reactor, and thus the continuous hydrate
formation is achieved. Pressure and temperature conditions for target gas hydrate formation
are selected according to gas-water-hydrate equilibrium condition in available literature
data. The reactor, the recovery vessel, and the water supply pump are all placed in a low
temperature thermostatic chamber to control the system temperature. Experimental
pressure is controlled within ±0.01 MPa by a pressure-regulating valve installed on the
downstream side of the reactor. Various gas hydrate formations are carried out under
constant pressure and temperature conditions.
Gas Hydrate Formation Kinetics in Semi-Batch Flow Reactor Equipped with Static Mixer
337
To calculate the hydrate formation rate, outlet gas flow rates are measured by a mass flow
meter after the gas had passed through the reactor. Gas hydrate formation was confirmed
by both visual observations and variations in outlet gas flow rates. The gas uptake rate into
hydrate was determined using the difference between inlet and outlet gas flow rates,
assuming that all the gas molecules are used to form hydrate. The gas uptake rate is equal to
overall gas hydrate formation rate (r
hy
).
Gas cylinder
Recovery
unit
Regulator
Cooler
P
MFC
Reactor
MFM
MFC
P
Vapor-liquid
separation
Recovery gas
Outlet gas
P
T
T
PC
Water
supply
(a) Schematic drawing of the system (b) Appearance in the chamber
Fig. 1. Semi-batch flow reactor with static mixer for gas hydrate formation system
(a) no-mixing element (empty tube) (b) mixing element insert
Fig. 2. Static mixing effect on gas-water-hydrate fluids (CH
2
FCF
3
gas-water system at 276K
and 0.20 MPa with 200 mL/min of gas flow rate)
Fig.2 shows the static mixing effect on gas hydrate formation from CH
2
FCF
3
gas-water
system. When the gas hydrate formation is carried out in empty tube, bubble surface is
covered with hydrate, and consequently the flow channel in the tube is blocked (Fig.2a). The
insert of mixing elements can form hydrate slurry and prevent the tube blockage by mixing
functions long time (Fig.2b). This result indicates that the mixing function of this mixing
Elapsed time
Elapsed time
Hydrodynamics – Optimizing Methods and Tools
338
element is important for the removal of hydrate film from bubble surface. The details of
mixing function effect have been mentioned in previous literature for liquid CO
2
-water
system in the co-current flow reactor (Tajima et al., 2005). In the semi-batch flow reactor, the
hydrate slurry formation is depending on not only mixing functions of the mixing elements
but other conditions; operation pressure, operation temperature, gas and water flow rates,
gas species, and so on. The relation between the hydrate formation pattern and these
conditions will be discussed again later.
3. Hydrate formation rate analysis
There are many discussion about gas hydrate formation kinetics. With regard as this
point, another book about natural gas hydate is available (Sloan and Koh, 2008). Although
gas hydrate nucleation and growth processes have been investigated and discussed by
many researchers, temperature difference, chemical potential difference, and fugacity
difference are selected as the driving force. Here, let’s say overall gas hydrate formation
rate r
hy
is expressed by the chemical potential difference between formation and
equilibrium as the driving force (Englezos et al., 1987; Daimaru et al., 2007; Li et al., 2009;
Tajima et al., 2010a).
g
eq
d
d
*
hy
n
raK
t
(1)
where n is the number of moles of target gas (guest gas) consumed in the gas phase, t is
elapsed time, aK* is the hydrate formation rate constant, a is the interfacial area, K* is the
overall kinetics constant, and µ
g
and µ
eq
are chemical potentials of guest gases in the gas
phase and hydrate phase, respectively. The overall kinetics constant K* will be expressed
using the mass transfer coefficient k
L
and the hydrate crystal growth constant k
f
.
111
*
L
f
kk
K
(2)
This idea is very similar to the treatment of crystal growth behavior of crystalization (the
nucleation process is ignored because of crystal seed addition) and gas absorption with
reaction in chemical engineering field.
d
ln
d
g
*
hy
eq
f
n
raKRT
tf
(3)
Although Eq.(2) may have to take account of the hydrate nucleation actually, we omits the
part of the nucleation here. Because the chemical potential terms can be reduced to the
fugacity of the gas, Eq.(1) can be easily transformed to the form of Eq.(3). R is the gas
constant, T is the operation temperature, and f
g
and f
eq
are the fugacities of the guest
molecules in vapour phase and in hydrate phase, respectively. The fugacity f
eq
is equal to
that under equilibrium. Because the fugacity can be simply expressed by the pressure and
fugacity coefficient
(Eq.(4)), Eq.(3) will be appropriated by Eq.(5).
f
P
(4)
Gas Hydrate Formation Kinetics in Semi-Batch Flow Reactor Equipped with Static Mixer
339
r
hy
dn
dt
aK
*
RTln
P
g
P
eq
(5)
where P
g
and P
eq
are the pressure in the gas phase and in equilibrium, respectively. Equation
(5) was used to calculate the hydrate formation rate constant aK* using the experimental
overall gas hydrate formation rate r
hy
, experimental gas phase pressure P
g
, and available
literature data
for the gas-water-hydrate equilibrium pressure P
eq
at the experimental
temperature.
0
0.005
0.01
0.015
0.02
0.025
0.03
0.035
0 100 200 300 400 500 600 700 800
Gas Consumption [mol]
Elapsed Time [s]
rhy
Fig. 3. Typical gas consumption line to calculate the overall hydrate formation rate (Tajima
et al., 2010a).
Guest
gas
aK*
[mol
2
/(s·J)]
P
g
[MPa] T [K] Reactor Reference
CH
2
FCF
3
2.08 x 10
-8
0.20 276.2 Author’s reactor Tajima et al., 2010a
CHClF
2
4.40 x 10
-8
0.16 276.1 Author’s reactor Tajima et al., 2011a
Xe 1.2 x 10
-8
3.5 275 Stirred tank Daimaru et al., 2007
CH
4
6.22 x 10
-10
6.0 275.15 Stirred tank Daimaru et al., 2007
CO
2
1.33 x 10
-7
6.0 277.65 Stirred tank Li et al., 2009
SF
6
4.26 x 10
-9
0.30 276.1 Author’s reactor Tajima et al., 2011b
Table 1. A type of gas hydrate formation rate constant of various guest gases.
Figure 3 shows typical gas consumption line in the semi-batch flow reactor. During the early
stage of hydrate formation, the gas consumption is very small and unequable, which is
parhaps because of the hydrate nucleation and unsteady state. The gas consumption
becomes constant over time because the hydrate formation in the reactor reachs a steady
state. Therefore, the overall hydrate formation rate can be calculated from the slope of the
gas consumption line in the late stage. For instance, Table 1 summarizes the hydrate
Hydrodynamics – Optimizing Methods and Tools
340
formation rate constant from our studies and previous literatures in which hydrate
formation rate is analysed with the similar equation. In the study using the stirred tank
reactor, the hydrate formation rate constant have been calculated assuming that the gas-
water sytem is sufficiently agitated, that is, k
L
>> k
f
. This assumption will be discussed
later. The hydrate formation rate constant aK* for freon gas hydrate (CH
2
FCF
3
, CHClF
2
)
are same order of magnitude as xenon hydrate, and two order of magnitude higher than
that of CH
4
hydrate. The aK* for SF
6
hydrate was one order of magnitude lower than
above freon gas hydrate. The aK* for CO
2
hydrate is highest among above other gas
hydrates. It is guessed that the gas hydrate formation rate constant may be depending on
the guest gas solubility in water, but further information and investigation are necessary
to confirm this relationship.
4. Relation between hydrate formation and operation conditions
This section focuses on the relation between the gas hydrate formation and the operation
conditions in the semi-batch flow reactor. The overall gas hydrate formation process is very
affected by varying thermodynamic, mechanical, and chemical conditions. Thermodynamic
conditions are operation pressure and temperature. The gas and water flow rate are defined
as the mechanical conditions because the flow rates will vary the gas-water mixing state by
mixing element in the semi-batch flow reactor. Here, it is regarded as the chemical
conditions that the hydrate formation promoter is added in water phase, because the
additives will vary the chemical potential of water phase and interfacial tension.
4.1 Thermodynamic conditions
In general, gas hydrate formation rate constant in stirred tank and agitation is analyzed
assuming that k
L
>> k
f
, but this assumption requires careful attention. In the static mixing
reactor, depending on the pressure and temperature conditions (thermodynamic
conditions), a single non-hydrate and main two types of hydrate formation patterns are
observed regardless of target gas species. Fig.4 shows typical gas hydrate formation
patterns observed in the semi-batch flow reactor. In this case, the operation temperature is
gradually decreased under constant pressure or P
g
increases under constant T, constant
gas and water flow rates. There is a gas-water system under outside pressure and
temperature conditions of hydrate equilibrium curve (Fig.4a). Under near-equilibrium
conditions, the hydrate formation is not occurred (Fig.4b). The non-hydrate formation
condition is probably a meta-stable region. The two types of gas hydrate formation
patterns, which are detailed below, are labelled “hydrate plug” (Fig.4d) and “hydrate
slurry” (Fig.4c). The hydrate plug has a target gas hydrate “shell” formed on the surface
of the bubbles. Whereas the hydrate slurry consists of very small target gas hydrate
particles in water and a hydrate shell rarely formed on the bubble surface (Tajima et al.,
2007). The observation results imply that the formed hydrate peels and sheds from the
bubble surface. Three step mechanisms of hydrate film growth at gas-water interface have
been reported (Sloan & Koh, 2008); (1) thin porous hydrate film formation, (2) thick
porous hydrate film formation, and (3) nonporous hydrate film formation. Hydrate slurry
pattern is perhaps formed by peering and shedding porous hydrate film at Steps 1 and 2.
If nonporous hydrate formation is achieved due to higher hydrate growth rate, it is
difficult to shed the film and hydrate plug formation will become dominant. Hydrate
slurry turned into hydrate plug with an increase in operation pressure and a decrease in
Gas Hydrate Formation Kinetics in Semi-Batch Flow Reactor Equipped with Static Mixer
341
operation temperature, which means the increase in the hydrate formation rate by
increasing the driving force. Therefore, the assumption, k
L
>> k
f
, may be unsuitable
depending on the hydrate formation patterns, and the hydrate shedding will be an
important consideration for gas hydrate formation from gas-water system.
(condition d) Hydrate plug formation (condition c) Hydrate slurry formation
Fig. 4. Typical gas hydrate formation patterns in the semi-batch flow reactor. Conditions (a)
and (b) are gas-water system, (c) and (d) are time-course in the hydrate formation, hydrate
slurry and hydrate plug (Tajima et al., 2007)
P
T
Hydrate equilibrium curve
ab
c
d
a
b
c
T constant
P constant