Indoor and Outdoor Air Pollution Part 3 doc
Bạn đang xem bản rút gọn của tài liệu. Xem và tải ngay bản đầy đủ của tài liệu tại đây (293.35 KB, 10 trang )
Air Polluted Environment and Health Effects
11
i. Some VOCs can be hazardous to health when inhaled. Benzene is a known human
carcinogen and toxic. Likewise, Formaldehyde is both an irritant and a sensitizer as
well as being toxic
ii.
VOCs such as hydrocarbons constitute emissions that instigate photochemical smog.
iii.
Some VOCs such as methyl-tertbutyl-ether (MTBE) are gasoline additives that are fairly
soluble in water leading to the contamination of water.
iv.
VOCs can form particulate matter if condensation forms of the gas
Volatile Organic Compounds, Polycyclic Aromatic Hydrocarbons (PAH) and the carbonyl
compounds (CO, CO
2
, CH
2
O) are the major organic pollutants in the atmosphere. The
assessment of VOCs has become a major issue of air quality network monitoring in cities.
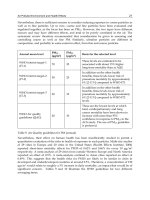
Toluene and Benzene are the major pollutants. Table 6 gives some examples of common
VOCs.
VOC
Hydrocarbons
Other
Aromatic Aliphatic Non-aromatic
Unsaturated
Planar Structure
Cyclic
Noticeable smell
Saturated
Tetrahedral
Linear or cyclic
Unsaturated
Chain-like structure
Non-cyclic
Examples :
Bezene
Hydrogenated
products
Omega-3 Formaldehyde
Liquor
Table 6. Volatile Organic Compound Classifications
2.4 Particulate matter (PM)
The term particulate matter (PM) is used to describe airborne solid particles such as dust,
dirt, soot, smoke and/or liquid droplets. Classification by size is based on the aerodynamic
diameter because it is a good indicator of the transport and removal of particles from the air
and their deposition within the respiratory system. Based on size, urban PM tends to be
divided into three principal groups:
coarse (PM
10
: 2.5 μm -10 μm), fine (PM
2.5
: 1 μm - 2.5 μm )
and
ultra fine particles (PM
0.1
: < 0.1 μm) as shown in Fig. 3. Coarse PM (PM
10
) include
geological materials, pollen and sea salt to name a few examples Fine PM is derived
principally from emissions such as SO
2
, NO
x
and condensation of VOCs. Ultrafine PM
(PM
0.1
) including nanoparticles (PM
0.01
) result from condensed organic carbon or sulfuric
acid vapors (Fig. 3).
The particles contained in the PM
10
size fraction may reach the upper part of the airways
and lung.
2.5 The green house gases
Water vapor, Carbon dioxide, and Methane are important greenhouse gases. A greenhouse
gas is a gas that readily absorbs infrared radiation. Methane, for example, absorbs infrared
radiation emitted by the earth 21 times more efficiently than CO
2
(per molecule). However,
because mixing ratios are much higher for CO
2
, it has a more significant impact on the
greenhouse effect.
Indoor and Outdoor Air Pollution
12
Fig. 3. PM Size chart
It is Jean-Baptiste Fourier who first discovered in 1824 the importance of the greenhouse
effect and the overheating of the atmosphere. A little later, the chemist Nicolas-Theodore de
Saussure imagined that the emission of CO
2
from immense fires could delay the melting of
the glaciers. However, towards the end of the XIX century John Tyndall and Olaf Arrhenius
discovered the role of the carbon dioxide and the water vapors in this effect. Since then we
have learned that there are other gases than the CO
2
, which contribute to the greenhouse
effect, like nitrogen dioxide (NO
2
) and various chlorofluorohydrocarbons (CFC) produced
by the industry, such as CCl
3
F (trichlorofluoromethane) called (CFC-11) and Cl
2
F
2
(dichlorodifluoromethane) called CFC-12.
The greenhouse effect is produced by the infrared radiations, which are imprisoned between
the earth and the thin layer of the greenhouse gases, which are reflected and heat the earth’s
surface. These gases let go through the sun’s radiations of short wavelengths, such as the
visible and ultra -violet, when they are reflected from the surface of the planet and keep the
radiations of longer wavelengths, which are the hot infrared radiations that increase the
temperature of the surface of the earth. The temperature of the Globe increases almost half a
degree (0.5 C) per century (from 13.84 C in 1950 to 14.4 C in 2001) and this phenomenon
tends to increase rapidly.
3. The impact of the transport industry on human health
3.1 Road transport pollution
It is only very recently that the full extent of transport’s negative impact on health has
become clearer. In an ecological audit of the impact of cars on German society
52
concluded
that cars were responsible for 47,000 deaths each year and a range of other, less severe,
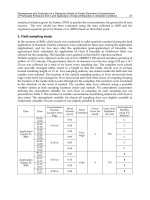
health impacts. These are summarised in Table 7.
Air Polluted Environment and Health Effects
13
Number Unit
deaths from particulate pollution 25,500 deaths, pa
deaths from lung cancer 8,700 “
deaths, from heart attacks 2000 “
deaths from summer smog 1900 “
deaths from road traffic accidents
(RTAs)
8758 “
TOTAL 47,000 “
serious injuries (RTAs) 116,456 injured/pa
light injuries (RTAs) 376,702 “
chronic bronchitis (adults) 218,000 number of illnesses/pa
Invalidity due to chronic
bronchitis
110 number of invalidates/pa
coughs/auswurf 92,400,000 days/year
bronchitis (children) 313,000 number of illnesses/pa
Wiedreholt Husten 1,440,000 number of illnesses/pa
Hospitalisation (breathing
problems)
600 number of hospitalisations/pa
Hospitalisation (breathing
problems)
9,200 number of days of care/pa
Hospitalisation (cardiovascular
disease)
600 hospitalisations/pa
Hospitalisation (cardiovascular
disease)
8,200 number of says of care/pa
Arbeitsunfahigkeit (not cancer) 24,600,000
Asthma attacks (days with
attacks)
14,000,000 days/pa
Asthma attacks (days with
broncho-dilator)
15,000,000 days/pa
Table 7. Health damage caused by cars, Germany, 1996, annual totals
The volume of death and illness revealed in Table 7 puts the European transport problem into
a very serious public health perspective. Transport is a major health problem and should be
tackled as much within a public health context as in a traditional transport/roads/highway
context. All the deaths and injuries in Table 7 relate to cars and not to lorries or aircraft. Total
deaths are about 5 times greater than road traffic accidents deaths.
The total amount of sickness, days in hospital etc. imposes a huge burden on the health
services of European countries and this burden is not recovered from those who drive cars.
The health impact is a huge human tragedy. 15 million days of use of bronchodilators is a
huge problem for many children and many families and the impact on physical activity,
Indoor and Outdoor Air Pollution
14
social activity, enjoyment of outdoor pursuits, community and neighbourhood is
incalculable. Health impacts in Europe in the 21
st
century are the direct equivalent of
disease impacts in 19
th
century cities which then required major re-engineering with clean
drinking water and sewage systems. We are still waiting for the 21
st
century equivalent of
this re-engineering to deal with the modern equivalent of widely dispersed sewage.
Road traffic noise and noise from aircraft also create significant health problems (WHO,
1996). These health problems are generally understated in Europe with an implicit
assumption on the part of traffic engineers and planners that most people can get used to
noise and, in any case, it is only a minor irritation and part of life in an advanced industrial
society. This has to be rejected. Noise causes raised blood pressure, cardiovascular disease,
a range of psychological problems, sleep disturbance and it damages school age children if
they are exposed to noise in a learning environment. WHO (1993) discusses the evidence
that supports the contention that children exposed to noise learn less well and have reading
abilities lower than is the case for children not in noisy environments. Studies around
Heathrow Airport in SE England also point to damage to children living near the airport
and under flight paths.
Studies of individual exposure to pollution show that car occupants are exposed to 2-4 times
as much pollution from vehicles as are cyclists
53
. This finding is in some ways counter-
intuitive and surprising but is the result of cars following a very similar path through traffic
to that followed by all other cars and effectively driving in a “tunnel of pollution”. This
raises the very interesting and important conclusion that the car itself damages the health of
car occupants. The conventional view is that cars are safer and more pleasant than cycling
(presumed to be a dangerous activity). Scientific research shows that this is not the case and
the growth of car use in Europe (especially the increase in the number of children carried
around by car) represents a significant public health problem which is at least an example of
direct correspondence between perpetrator and victim. Those that cause the problem suffer
the consequences of that problem. The fastest increase occurred between 1950 and 2000,
which is due to human activity.
3.2 Aviation pollution
Commercial aviation is experiencing dramatic growth in regions throughout the world,
including North America and the United States. However, airport development has not kept
pace with increases in aviation activity and the problem is now acute in the United States. In
1996 the Federal Aviation Administration (FAA) Administrator identified lack of airport
capacity as the “single most important constraint” to realizing forecast rates of growth
throughout the aviation industry. Funding is one problem. The annual shortfall between
funds needed for airport development and total funds available is difficult to determine but
has been estimated at more than $4 billion annually in recent years. A second problem is the
rapid pace of change in aviation technologies. Changes in the design and construction of
airfield and landside facilities will be necessary to accommodate the larger aircraft that will
enter service and the new navigation and air traffic control systems that will be deployed in
the near future.
According to IPCC, in 2000 aviation was responsible for 3% of carbon dioxide emissions due
to the total burning of fossil fuel and 13% of that associated with transport. However, the
total greenhouse impact was more important than this would suggest. Since the vast
majority of the flights were subsonic and therefore in the 9 - 13 km height range, the
Air Polluted Environment and Health Effects
15
emissions of oxides of nitrogen led, on average, to an increase in ozone as well as a decrease
in methane.
Innovative planning approaches are essential to timely development of new airport
facilities, and environmental documentation is a key component of the planning process.
Federal actions (e.g., funding, approvals) in connection with proposed airport development
often require environmental review pursuant to the National Environmental Policy Act
(NEPA) and the implementing guidelines of the Council on Environmental Quality and the
FAA, which is in the process of updating its
Airport Environmental Handbook (Order
5050.4A). In addition to NEPA, a number of states have enacted statutes that mandate
evaluation of the potentially significant environmental impacts of development, including
airport projects. Beyond compliance with NEPA and state environmental review statutes,
airport development proposals may trigger additional analytic requirements that must be
carried out in parallel or sequential processes, for example, air quality assessments pursuant
to the Environmental Protection Agency (EPA) General Conformity Rule and historic
resource documentation pursuant to Section 106 of the National Historic Preservation Act of
1966. Environmental analyses for airport development projects are increasingly subject to
technical, political, and ultimately legal scrutiny. More and more often, challenges are raised
as to the adequacy of NEPA and state environmental documents as well as studies
supporting related determinations by lead agencies or agencies with jurisdiction or special
expertise (Health Canada 2005).
The main environmental concerns associated with aircraft are:
Climate change
stratospheric ozone reduction, leading to increased surface UV radiation
regional pollution - changes in tropospheric chemistry for tens to hundreds of
kilometres downwind of the airport. In particular, emissions of oxides of nitrogen in air
increase ozone
local pollution - both noise and decreased air quality caused by aircraft and also by the
associated ground transportation.
There is no doubt that both local pollution and regional pollution are very serious issues. It
is thought that European Directives on permitted levels of oxides of nitrogen may limit the
expansion of some airports ( Filliger et al 1999). Concern has been expressed to us that the
techniques for assessment of the impact of aircraft emissions on both local and regional air
quality are poorly developed and that the available modeling tools are in general
inadequate. This issue needs addressing urgently, especially in the light of the recent
consultation documents on regional airport development. However, the focus here is on the
possible larger-scale impacts of aviation, on surface UV radiation through changes in
atmospheric ozone and on climate.
3.3 Key pollutants
The main types of pollution linked to aviation and airport operations originate from aircraft,
ground-support equipment (GSE), external traffic related to airport activity and industrial
parks. Aircraft operations are related primarily to pollution such as carbon monoxide and
dioxide, nitrogen oxides, oxides of sulfur, water vapor, hydrocarbon trace pollutants such as
benzene and particulate matter consisting mainly of sulfate and soot. These emissions alter
the chemical composition of the atmosphere in a variety of ways, both directly and
Indoor and Outdoor Air Pollution
16
indirectly. On the larger-scale, sulfur oxides in aircraft emissions are important only as a
source of particles.
The unique feature of these emissions is that the majority of them occur far above the Earth’s
surface. Subsonic aircraft generally cruise in an altitude range of 9 - 13 km, close to the
tropopause, the sharp transition between the troposphere and the stratosphere (see Fig. 1).
The troposphere is the region in which the turbulent motions and precipitation related to
weather occur. In contrast the stratosphere is relatively stable and the vertical motions in it
are generally sufficiently small compared with the horizontal motions that the air travels
almost horizontally (Filliger P et al 1999).
3.4 Avition and the atmosphere
The impact of aircraft emissions can be very different depending whether they are in the
upper troposphere or the lower stratosphere. Both the abundance of trace gases and the
dominant chemical composition and associated chemical reactions are very different in the
two regions. In particular water vapour content is relatively high in the troposphere and low
in the stratosphere, whereas ozone levels are much higher in the stratosphere. Stratospheric
ozone absorbs radiation from the sun. This leads to a heating profile in the stratosphere that
determines its character, and also protects life at the surface from the harmful effects of the
UV radiation.
The height of the troposphere varies with latitude. In the tropics the tropopause is higher
than the normal range of subsonic cruise altitudes but in Polar Regions it is usually at the
lower end of this range. Whether an aircraft cruises in the upper troposphere or the
lowermost stratosphere depends on its location, the weather and the time of year.
Supersonic aircraft typically cruise at levels in the range 17 - 20 km, which is always in the
stratosphere (Filliger et al, 1999). Jet streams are typically located at the tropopause in
regions where there are abrupt transitions in the horizontal between the troposphere and
the stratosphere. Since eastward-flying aircraft are often routed in the strong westerly winds
in jet stream regions to save fuel and time, they often fly close to this almost vertical
tropopause. The dominant physical and chemical processes differ between the troposphere
and stratosphere, as do the time-scales for transporting air between regions. Water vapor
added by any human activity in the troposphere is soon lost through mixing and
precipitation processes, whereas at 20 km it persists and moves slowly towards the pole.
A “conservative gas” is one that becomes well mixed throughout the atmosphere so that the
point of emission is irrelevant for its impact on climate. The carbon dioxide produced by the
combustion of kerosene in aircraft engines behaves as a conservative gas and so becomes
well mixed. However, oxides of nitrogen, produced by high temperature burning in the
engine, are rapidly involved in chemical reactions that lead to changes in both ozone and
ambient methane. These reactions are complex and sensitive. Ozone is generally produced
by oxides of nitrogen in the troposphere and destroyed by it in the lower stratosphere. Since
the lifetime of ozone is relatively short, its aircraft-induced increase or decrease is restricted
in both the vertical and the horizontal. The lifetime of methane, however, is sufficiently long
that the reduction in it produced by the emitted oxides of nitrogen becomes distributed
throughout the atmosphere. In the troposphere the amount of water vapor emitted in
aircraft exhaust is negligible compared with the pre-existing concentrations in the
atmosphere. However, along with the particles emitted, the water vapor can lead to
condensation trails, some of which can persist for hours and perhaps trigger the
Air Polluted Environment and Health Effects
17
development of cirrus clouds. Subsequent cirrus cloud may also be further influenced by
particles emitted by aircraft (Samet et al. 2000)
.
4. Exposure to various air pollutants and health effects
4.1 Clean air
Clean air is the symbol of life for humans, animals and vegetation and forms the basis of the
food processing mechanisms of all these three life-borne species. Oxygen is the active
ingredient in the air that reacts with food supplies by oxidizing them or burns them in
various animal and vegetable tissues to maintain the balance of life. The remainder of the
fixed gases (nitrogen and inert gases) does not react with the food supply. Damage to the
food processing mechanism impacts growth and reproduction and, therefore, the future of
life. The variable gases can have a direct effect on the quality of air necessary to maintain the
food chain mechanisms. Pollution and toxic chemicals can have a detrimental effect on the
balance of life and the food chain.
The chemicals that are poisoning our environment are numerous. They change the
composition of the atmospheric air. In addition, there are traces of solid materials (PM
0.1-0.01
,
PM
2.5
, PM
10
) in the air that are equally toxic – usually metal oxides and other solid
compounds. Species that breathe air to burn food with oxygen also inhale the toxic
chemicals that interact or react with the animal tissues. Lungs, in particular, are susceptible
to such damage leading to symptoms of pulmonary diseases that can range from acute
irritations to chronic illnesses or death.
Toxic substances can also work their way into the blood stream and cause cardiovascular
diseases. It is also known that chemicals may damage hemoglobin and react with tissues
such as breast, lung and heart tissues and cells or constituents of cells such as proteins,
nucleic acids, membranes such as lipids, phospholipids, and carbohydrates. These possible
chemical alterations in the above organs and molecules can lead to other diseases such as
cancers and osteoporosis.
Today, people agree that the treasures of the earth are finite and that the biosphere is
vulnerable. Studies indicate that 80% of all materials produced by companies become trash
within six months
36
. Until now, our environment has been able to cope with this massive
influx of pollution but we are starting to see its limitations of absorbing. The time is rapidly
approaching where we must make dramatic changes in the way we manage our
environment to avoid drastic consequences to future generations. Increased earth
temperature caused by the greenhouse effect will facilitate incubation of bacteria and lead to
increases in diseases. Flooding or droughts will also lead to poor hygiene for millions of
humans and produce other diseases. As recent catastrophes such as SARS and the poultry
viruses demonstrated, humans halfway across the globe in well-developed, western nations
are equally susceptible to the transfer of these diseases. Therefore, pollution and
environmental management are issues that must be addressed by the developed world.
The results of epidemiological studies can be applied to current air quality statistics to
estimate the magnitude of the impact of air pollution on health. The World Health
Organization (WHO) produced meta-analyses for the effects on mortality and morbidity of
a number of pollutants (WHO, 1997). Their effect estimates have been used by others to
calculate aspects of the burden of poor health attributable to pollution. For example, in the
Indoor and Outdoor Air Pollution
18
UK, COMEAP (the UK Department of Health’s Committee on the Medical Effects of Air
Pollutants) calculated that PM10 was associated with 8,100 deaths brought forward and
with 10,500 emergency hospital respiratory admissions (brought forward and additional) in
urban areas of Great Britain. The corresponding figures for SO
2
were 3,500 deaths brought
forward and 3,500 early and extra hospital admissions. The effects of ozone were 700 deaths
and 500 admissions if there is no health effect below 50ppb, but 12,500 and 9,900 if there is
no threshold. Our own studies have demonstrated that high levels of toxic air pollution can
be correlated to increased mortality (Theophanides, M . et al. 2002, 2007).
4.2 Exposure assessments
Several empirical methods have been devised to quantify the effect of pollution on mortality
and morbidity. The WHO has Meta-Analysis for the effects on mortality and morbidity of a
number of pollutants (WHO, 1997) for PM
10
, SO
2
, O
3
. Furthermore, the WHO and is
increasingly leaning toward the conclusion, substantiated by supporting research, that for
some pollutants, there is no threshold below which is deemed safe. At the very least,
increasingly sensitive epidemiological study designs have identified adverse effects from air
pollution at increasingly lower levels. For the time being, linear models are being used for
which there is no lower threshold (WHO, 2003).
In short-term studies, elderly subjects, and subjects with pre-existing heart and lung disease
were found to be more susceptible to effects of ambient PM on mortality and morbidity. In
panel studies, asthmatics have also been shown to respond to ambient PM with more
symptoms, larger lung function changes and with increased medication use than non-
asthmatics. In long-term studies, it has been suggested that socially disadvantaged and
poorly educated populations respond more strongly in terms of mortality. PM also is related
to reduce lung growth in children. No consistent differences have been found between men
and women, and between smokers and non-smokers in PM responses in the cohort studies.
(WHO, 2003)
4.3 Quantification of effects
The quantification of health effects has become increasingly important in the development
of air quality policy. For such analyses it is important to have accurate information on the
concentration–response relationships for the effects investigated, i.e. on the relationship
between the level of air pollution and the effect on health. A quantitative meta-analysis of
peer-reviewed European studies was therefore conducted to obtain summary estimates for
certain air pollutants and health effects. The data for these analyses came from a database of
time-series studies developed at St George’s Hospital Medical School at the University of
London. The meta-analysis was performed at St George’s according to a protocol approved
in advance by a WHO Task Group. Using data from several European cities, the analysis
confirmed statistically significant relationships between mortality and levels of PM and
ozone in ambient air. Updated risk coefficients in relation to ambient exposure to PM and
ozone were obtained for all-cause and cause-specific mortality and hospital admissions for
respiratory and cardiovascular causes. Some results are shown in Fig.4. The meta-analysis
also included a thorough assessment of so-called publication bias. Fig. 4 shows that PM
2.5
presents the high mortality risk for an increase in concentration of this pollutant. The most
susceptible cause of mortality is cardiovascular deaths.
Air Polluted Environment and Health Effects
19
Fig. 4. Probability of mortality risks as a result of a 10-μg/m
3
increase of a pollutant
The WHO has estimated that in Europe 100,000 death are due to air pollution each year.
Studies by the Canadian government have concluded that yearly deaths due to air pollution
(CO, NO
2
, SO
2
, PM, O
3
) from anthropogenic sources are 1,800 for short-term exposure and
4,200 for long-term exposure (Mcdonnell, w.f. et al. 2000).
4.4 Health effects due to particulate matter (PM)
The effects of short-term exposure to PM have been documented in numerous time-series
studies many of them conducted in Europe (Rita Rita K. Seethaler et al 2003); these indicated
large numbers of outcomes, such as attributable deaths and hospital admissions for
cardiovascular and respiratory conditions. Both short-term (24 hours) and long-term (annual
average) guidelines are therefore recommended. The WHO defines the principal short and
long-term health effects attributed to Particulate Matter according to Table 8:
Short-Term Long-Term
Lung inflammatory reactions
Respiratory symptoms
Adverse effects on the:
Increase in medication usage
Increase in hospital admissions
Increase in mortality
Increase in lower respiratory symptoms
Reduction in lung function in children
Increase in chronic obstructive
Reduction in lung function in adults
Reduction in life expectancy, owing
Table 8. Health Effects due to PM
Fig. 5 shows schematically where particles are deposited in the respiratory tract, depending
on their size. Smaller particles (in particular PM
2.5
) penetrate more deeply into the lung and
may reach the alveolar region. Ultrafine particles contribute only slightly to PM
10
mass but
may be important from a health point of view because of the large numbers and high
surface area. They are produced in large numbers by combustion (especially internal
Indoor and Outdoor Air Pollution
20
combustion) engines. As stated above, PM in ambient air has various sources. In targeting
control measures, it would be important to know if PM from certain sources or of a certain
composition gave rise to special concern from the point of view of health, for example
owing to high toxicity.
Fig. 5. Respiratory tract deposition probability of inhaled particles
The few epidemiological studies that have addressed this important question specifically
suggest that combustion sources are particularly important for health. Toxicological studies
have also pointed to primary combustion-derived particles as having a higher toxic potential.
These particles are often rich in transition metals and organic compounds, and also have a
relatively high surface area. By contrast, several other single components of the PM mixture
(e.g. ammonium salts, chlorides, sulfates, nitrates and wind-blown dust such as silicate clays)
have been shown to have a lower toxicity in laboratory studies (Schwartz, J. et al. 1996).
Despite these differences found among constituents studied under laboratory conditions, it
is currently not possible to quantify the contributions from different sources and different
PM components to the effects on health caused by exposure to ambient PM. Nevertheless, it
seems reasonable to include in abatement efforts those sources/constituents that have been
shown to be critical, such as emissions from diesel engines.
Many studies have found that fine particles (usually measured as PM
2.5
) have serious effects
on health, such as increases in mortality rates and in emergency hospital admissions for
cardiovascular and respiratory reasons. Thus there is good reason to reduce exposure to
such particles. Coarse particles (usually defined as the difference between PM
10
and PM
2.5
)
seem to have effects on, for example, hospital admissions for respiratory illness, but their
effect on mortality is less clear. A few studies suggest that fine PM is more biologically
active than coarse PM (defined as particles between 2.5 and 10 μm in size) (Klemm, et al
2000; Schwartz, J. & Neas L. M. 2000; R.W. Atkinson et al., 2000; F. Dominici et al 2007).

