Indoor and Outdoor Air Pollution Part 7 pptx
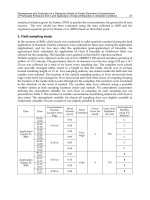
Bạn đang xem bản rút gọn của tài liệu. Xem và tải ngay bản đầy đủ của tài liệu tại đây (245.64 KB, 10 trang )
Air Pollution: A Case Study of Ilorin and Lagos Outdoor Air
51
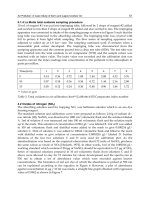
4.1.4 La Motte total oxidants sampling procedure
10 mL of reagent #1 was put into impinging tube, followed by 2 drops of reagent #2 added
and swirled to mix then 2 drops of reagent #3 added and also swirled to mix. The impinging
apparatus was connected to intake of the sampling pump as shown in Figure 5 such that the
long tube was immersed in the absorbing solution. The impinging tube was covered with
foil to protect it from light while sampling. The flow meter of sampling apparatus was
adjusted to collect air at 1.0 Lm
-1
rate. The sampling continued until 15 minutes when a
measurable pink colour developed. The impinging tube was disconnected from the
pumping apparatus and the contents poured into a clean test tube (0230). The test tube was
later inserted into the total oxidants in air comparator (7739) and the sample colour was
matched with an index value. The index value was recorded and the calibration chat was
used to convert the index readings into concentration of the pollutant in the atmosphere in
parts per million.
Time(min) 1 2 3 4 5 6 7 8
5 0.14 0.36 0.72 1.08 1.44 2.88 4.32 5.76
10 0.07 0.18 0.36 0.54 0.72 1.44 2.16 2.88
15 0.05 0.12 0.24 0.36 0.48 0.96 1.44 1.72
** Values in ppm
Table 3. Total oxidants in air calibration chart** [LaMotte 6.05] Comparator index number
4.2 Oxides of nitrogen (NO
x
)
The absorbing solution used for trapping NO
x
was Saltzman solution which is an azo dye
forming reagent .
The standard solution and calibration curve were prepared as follows: 2.16g of sodium di -
oxo nitrate (III), NaNO
2
was dissolved in 1000 cm
3
volumetric flask and the solution labeled
A. 1ml of solution A was measured out into 100 ml volumetric flask and the solution made
up to the mark. This solution of concentration 0.0216 gL
-1
was labeled B. 1ml of B was added
to 100 ml volumetric flask and distilled water added to the mark to give 0.000216 gL
-1
solution C. 10ml of solution C was added to 100ml volumetric flask and filled to the mark
with distilled water to give solution of concentration 0.0000216 gL
-1
labeled D. Further
dilutions of the last two solutions C and D were used for calibration plot. As the
standardization was based on the empirical observation that 0.72 mole of NaNO
2
produces
the same colour as 1mole of NO
2
[Hesketh, 1972]. In other words, 1ml of the 0.000216 gL
-1
working standard which contains 0.216μg of NaNO
2
should be equivalent to 0.2 μg of NO
2.
Series of standard solutions prepared in 10 ml volumetric flasks from solutions C and D
above were allowed to stay for 15 minutes for colour development and the spectra run at
550 nm to obtain a set of absorbance value which were recorded against known
concentrations. The formation of red azo dye of which the absorbance is picked at 550 nm
can be explained according to the equation in Figure 6 However, a plot of absorbance
against concentration in μg / 10 ml was made, a straight line graph obtained with regression
value of 0.9962 as shown in Figure 7
Indoor and Outdoor Air Pollution
52
SO
3
H
HN
H
H
H
H
H
H
H
H
HN
2
O
SO
3
H
H
H
H
H
SO
3
H
HON
2
HClNH
2
(CH
2
)
2
NH
H
H
H
H
H
H
H
2
H
H
H
H
H
HClNH
2
(CH
2
)
2
NH
H
H
OH
H
H
H
H
HO
3
S
N
2
2
H
H
H
H
H
HClNH
2
(CH
2
)
2
NH
H
H
H
H
H
HO
3
S
N
2
2
H
2
O
+
2NO
2
+
H
2
O I/2O
2
+
HNO
2
+
+
(NO
X
)
Sulphanilic acid
(in glacial acetic acid)
Diazonium salt
rearangement
+
N-1-(Naphthyl) ethylene di amine di hydrochloride
Diazonium salt
[NINE]
Azodye
+
H
2
O
Water
Fig. 6. Equation showing the formation of azo dye
Air Pollution: A Case Study of Ilorin and Lagos Outdoor Air
53
4.2.1 Sampling procedure
The procedure for sampling is as given above
Fig. 7. Oxides of nitrogen (no
x
) calibration curve
4.2.2 Analysis
The absorbing solution serves as sample reference or blank solution in order to take care of
any impurities during preparation. Absorbance of samples for oxides of nitrogen was
measured at 550nm with UV / Visible spectrophotometer. The concentration was read out
in μg / 10ml from the reference plot of which an example is shown in figure 7. The
concentrations were converted to μgm
-3
or ppm or ppb of which the conversion factors are
explained hereafter.
4.2.3 Calculation [Vowels and Connell, 1980]
3
x
x
total
g
NO per 10ml of absorbin
g
rea
g
ent
NO gm
Volume of air sampled in cubic metres
(19)
X
M
NO
x
NO
V
(20)
3
1000
24.45
ppb molar mass
gm
(21)
for 1 μgm
-3
of NO
x
as NO
2
, the ppb value will be
1 24.45
0.53
46 1000
p
pb
(22)
Indoor and Outdoor Air Pollution
54
QUANTITY CONTENTS CODE
2 × 120 mL Nitrogen (Iv) oxide reagent #1 Absorbing solution 7684-J
30 mL Nitrogen (Iv) oxide reagent #2 7685-G
10g Nitrogen (Iv) oxide reagent #3 powder 7688-D
2 Test tubes,10mL, glass, w/caps 0822
1 Spoon, 0.005g, plastic 0696
1 Pipet, droping, plastic 0352
1 Nitroge (IV) oxide in air comparator 7689
1 Tubing 23609
1 Pipet 30410
1 Needle 27336-01
Table 4. LaMotte nitrogen (IV) oxide in air test kit code 7690
4.2.4 Nitrogen (IV) oxide lamotte sampling procedure
10mL of reagent #1 i.e. absorbing reagent was poured into the impinging tube, a gas bubbler
impinger (0934). The impinging apparatus was connected to the intake of air sampling
pump and the long tube was immersed in the absorbing solution. The special adaptor was
attached to the intake of the pump to sample at 0.2Lm
-1
while the sampling was done for 20
minutes when a measurable amount of nitrogen (IV) oxide was absorbed. At the end of the
sampling period the contents of the impinging tube was poured into test tube (0822). The
pipette (0352) was used to add a drop of reagent #2, the test tube capped and mixed after
which the 0.05g spoon was used to add 0.05g of reagent #3. The test tube capped and the
solution left for 10 minutes for colour development after which the test tube was placed into
comparator (7689) and the sample colour matched to index of colour standards. The index
number which gave the proper colour matched was recorded and the calibration chart used
to convert the index read to concentration of nitrogen (IV) oxide in ppm.
Comparator index number
Time (min) 1 2 3 4 5 6 7 8
1 0.00 2.8 7.0 14.0 21.0 28.0 42.0 56.0
5 0.00 0.56 1.40 2.80 4.20 5.60 8.40 11.20
10 0.00 0.28 0.70 1.40 2.10 2.80 4.20 5.60
15 0.00 0.19 0.47 0.93 1.40 1.87 2.80 3.74
20 0.00 0.14 0.35 0.70 1.05 1.40 2.10 2.80
Table 5. Nitrogen (IV) oxide in air calibration chart**
4.3 Sulphur (IV) oxide
The absorbing solution used for trapping SO
2
was 0.3M H
2
O
2
solution buffered at pH 5 ± 0.2.
Air Pollution: A Case Study of Ilorin and Lagos Outdoor Air
55
The standard solution and calibration curve were prepared as follows:
0.1M H
2
SO
4
was used as parent standard solution. All other lower concentrations were
prepared from serial dilution of 0.1M H
2
SO
4
. 0.1M H
2
SO
4
was standardized by titration
against Na
2
CO
3
using methyl orange as indicator. The conductivity measurement of each of
the concentrations of H
2
SO
4
(0.001 – 0.01M) obtained from serial dilution were taken, using
Hanna Instrument EC 214 conductivity model. A graph of conductivity values in Siemens
per centimeter (Scm
-1
) against concentrations of H
2
SO
4
in mol dm
-3
was plotted. The data
gave a straight line which passes through the origin with regression value of 0.9874. The
calibration curve so obtained is shown in Figure 8. This was used as a working curve for the
determination of SO
2
during the analysis of samples.
4.3.1 Sampling procedure
The procedure for sampling others remained except the flow rate that was increased to 2
Lmin
-1
for optimization purpose [Abdul Raheem et al., 2009
c
].
Fig. 8. Sulphur (iv) oxide calibration curve
4.3.2 Analysis
Conductivity measurements were undertaken using the Hanna Instrument Model E 214
conductivity meter.From the sample and reference solutions 20 cm
3
volume was measured
respectively into a liquid sample holder test tube of Hanna model conductivity meter. The
concentrations in mol dm
-3
of H
2
SO
4
formed from SO
2
of the samples were read out from the
reference plot (Fig.8), the concentrations obtained in mol dm
-3
were converted to parts per
million or parts per billion or microgram per cubic meter (ppm or ppb or μgm
-3
) as shown
below using appropriate conversion factor. Equation of reaction for formation of H
2
SO
4
from
SO
2
is shown below:
22
22 4
SO O SO
HH
(23)
Indoor and Outdoor Air Pollution
56
4.3.3 Calculation [ Stanley, 1975; Vowels and Connell, 1980]
3
2
.samplingvol
moldm mmSO
ppm
samplingduration
flowrate
(24)
3
1000
24.45
ppm molar mass
gm
(25)
for 1 moldm
-3
of SO
2
, ppm value will be
16430
2 60 1000
(26)
2
1.6 10
pp
m
in μgm
-3
, the value becomes:
2
3
1.6 10 64 1000
41.88
24.45
g
m
(27)
QUANTITY CONTENTS CODE
2 × 250 mL Sulphur (IV) oxide absorbing solution 7804-K
15g Sulphur (IV) oxide reagent #1 7693-E
30mL Sodim hydroxide, 1.0 N 4004PS-G
60mL Sulphur (IV) oxide passive bubbler indicator 7805-H
2 Pipets, 1.0mL, plastic 0354
2 Test tubes, 5 mL, plastic, w/caps 0230
2 Test tubes, Hester, w/caps 0204
1 Spoon, 0.25g 0695
1 Dispenser caps 0693
1 Sulphur (IV) oxide passive bubbler comparator 7746
Table 6. LaMotte sulphur (IV) oxide in air test kit code 7714
4.3.4 Sulphur (IV) oxide lamotte sampling procedure
10mL of Sulphur (IV) oxide absorbing solution was added to impinging tube and connected
to the impinging apparatus as shown in Figure 5. The long tube was immersed into the
absorbing solution. Sampling was done at 1.0 Lpm for 60 minutes or 90 minutes. The
impinging apparatus was covered with foil to protect it from light. At the end of the
sampling time the small test tube (0230) was filled to the line with the sample and 0.25g
Air Pollution: A Case Study of Ilorin and Lagos Outdoor Air
57
spoon was used to add a level measured of Sulphur (IV) oxide reagent #1. The test tube
containing the mixture was capped and vigorously shaken to dissolve the powder. A 1 mL
pipette was used to add 1mL sodium hydroxide, 1.0N, to the same small test tube, capped
and inverted several times to mix. The other 1mL pipette was also used to add 2mL (2
measures) of Sulphur (IV) oxide passive bubbler indicator (7805) to a large test tube (0204).
The contents of the small test tube were poured into the large test tube containing the
indicator. Immediately the tube capped and inverted six times, holding the cap firmly in
place with the index finger. After waiting for 15 minutes, the test tube was placed into the
Sulphur (IV) oxide passive bubbler comparator (7746). The sample colour matched with the
standard colour and the index number read and recorded from the comparator. The index
number was converted to concentration in ppm using the calibration chart provided.
Comparator index number
Time (min) 1 2 3 4 5 6 7 8
10 0.00 0.19 0.29 0.38 0.48 0.57 0.67 0.76
30 0.00 0.06 0.10 0.13 0.16 0.19 0.22 0.25
60 0.00 0.03 0.05 0.06 0.08 0.10 0.11 0.13
90 0.00 0.02 0.03 0.04 0.05 0.06 0.07 0.08
** Values in pp
Table 7. Sulphur (IV) oxide in air calibration chart**
5. Quality assurance
The impinger was well rinsed with distilled water and properly wrapped with foil paper
before each use. The tubing’s and corks in the sampling train were checked before and
during sampling, in case they had become slackened, however silicone grease was used to
increase the pressure by making them air tight.
The absorbing reagents were always prepared freshly ahead of sampling for the solution to
stabilize. They were stored in amber coloured bottles and refrigerated because of light
interference. They were always allowed to thaw and assume the 25°C temperature before use.
Lengthy contact with air by the absorbing reagent was avoided during both preparation and
use to prevent absorption of the oxides. The absorbance of the reagent blank was deducted
from that of the samples where the machine could not be adjusted to zero to avoid matrix
error, especially with the conductivity meter.
For the nitrogen oxides determination, a gas bubbler impinger (fritted gas bubbler) was
used instead of a general purpose impinger as absorption tube. The general purpose
impinger has been reported to give low absorption efficiency with oxides of nitrogen
[ICMA, 1972; Onianwa et al., 2001; Saltzman, 1954]. However the results were corrected and
correlated with the fritted bubbler as well as standardized absorbing solution imported from
LaMotte and Company, USA.
Greatest accuracy has been reported to be achieved by standardizing the sampling train
with accurately known gas sample in a precision flow dilution system like a permeation
tube [Dara, 2004]. Due to lack of the apparatus necessary for the standardization of the train,
Indoor and Outdoor Air Pollution
58
the actual collection efficiency is not known. However with the use of LaMotte sampling
pump with inbuilt flow meter and standardized reagents, we recorded high collection
efficiency at sites with increase concentrations of samples.
6. Results
This is already discussed extensively in Abdul Raheem, 2007 and Abdul Raheem et al.,
2009
a,b,c
. Typical tables are shown to show the typical measurements concentration results
and the meteorological data
Start of
sampling
End of
sampling
OX (ppb)
NOx
(ppb)
SO
2
(ppb)
RELHUM
(%)
WND
ms
-1
DWND
(
o
C)
AIRTEMP
(
o
C)
Sun
ExpWm
-2
6.30am 7.30am 29.08 ±11.73 1.47 7.83 78.17 27.60 144.60 22.70 -1.55
7.45am 8.45am 29.72 ±10.5 3.44 6.54 71.67 36.30 156.40 23.20 0.51
9.00am 10.0am 29.71 ±5.57 0.43 4.17 57.30 44.60 156.50 27.90 8.63
10.15am 11.15am 33.11 ±5.51 1.67 4.42 53.30 42.00 160.50 29.80 12.61
11.30am 12.30pm 46.69 ±7.49 1.73 6.27 42.00 42.30 153.20 31.50 15.36
12.45pm 1.45pm 69.94 ±15.45 1.04 7.36 38.67 43.40 154.00 32.80 16.09
2.00pm 3.00pm 35.55 ±11.21 2.46 8.84 35.50 41.60 160.00 34.30 13.39
3.15pm 4.15pm 21.44 ±6.31 2.46 7.62 37.17 39.40 167.90 33.80 10.16
4.30pm 5.30pm 17.62 ±3.13 2.69 9.52 39.00 39.30 178.00 33.00 5.66
5.45pm 6.45pm 11.56 ±2.19 2.91 9.11 42.67 37.60 176.70 31.30 0.86
Table 8. Dry season environmental data for Ilorin
Start of
sampling
End of
sampling
OX
(ppb)
NOx
(ppb)
SO
2
(ppb)
RELHUM
(%)
WND
ms
-1
DWND
(
o
C)
AIRTEMP
(
o
C)
Sun Exp
Wm
-2
6.30am 7.30am 14.26 12.40 10.72 90.58 3.07 107.02 25.99 -1.65
7.45am 8.45am 22.92 5.89 7.20 87.58 4.67 156.38 26.38 2.80
9.00am 10.0am 28.95 5.39 11.15 73.75 7.09 189.02 29.05 8.90
10.15am 10.0am 46.86 5.66 14.82 67.92 7.35 182.63 30.25 11.00
11.30am 12.30pm 43.21 6.41 10.51 63.50 8.76 170.67 31.30 12.06
12.45pm 1.45pm 85.31 5.68 12.74 60.33 10.11 159.55 32.00 17.30
2.00pm 3.00pm 73.77 6.45 16.62 60.08 10.36 155.00 31.98 15.10
3.15pm 4.15pm 26.06 6.84 15.47 62.67 10.94 163.79 31.37 13.20
4.30pm 5.30pm 12.23 5.72 16.48 67.00 10.21 165.22 30.38 10.70
5.45pm 6.45pm 8.58 6.90 19.21 72.75 8.99 166.64 29.20 3.30
Table 9. Dry season environmental data for Lagos
Air Pollution: A Case Study of Ilorin and Lagos Outdoor Air
59
This is showing typical results of statistical modeled analysis of Ilorin and Lagos during dry
season MLR with backward selection in stepwise mode (without intercept) results in the
following equation:
OX
ILO
= 6.092 x SO
2
+ 0.657 x RHUM – 2.653 x ATEMP + 4.385 x SUNEXP (28)
Where R = 0.981, F (4, 6) = 38.389, p < 0.000
This shows that only four of the variables are found to be significant for retention in the
model.
MLR using backward selection in stepwise mode (without intercept) results in the following
equation:
OX
Lag
= 1.679 x ATEMP + 5.622 x SUNEXP – 8.079 x WND (29)
where, R = 0.961, F (3, 7) = 27.874, p < 0.000
MLR shows that only three of the variables are significant for retention in the model.
A table Comparing the ozone measured concentration with calculated results from MLR
model equations
ILORIN LAGOS
RAIN DRY RAIN DRY
MEASURED 21.86 ± 2.47 32.44 ± 5.13 9.87 ± 0.99 36.22 ± 5.76
MODELED 16.12 ± 1.86 44.32 ± 4.25 9.89 ± 0.82 36.29 ± 3.87
Table 10. MLR equation modeled results for ozone compared with monitored results for the
two cities of interest during rainy and dry seasons (ppb)
7. General conclusion
The direction and spatial extent of transport and the relative contribution of transported
ozone and precursors to individual downwind areas are highly variable. A number of
factors influence site to site differences in ozone concentrations, including sources of
precursor’s emissions and meteorological conditions.
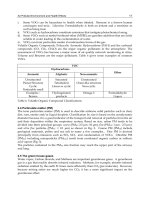
Data analysis also reveals that NO
x
and SO
2
as well as volatile organic compounds
contribute to ozone formation and this is in accordance with other researchers [Winer et al,
1974; Canada – US, 1999; chou et al, 2006]. The relative effectiveness of reductions of these
three precursors can vary with location and atmospheric condition. Overall the
concentrations of ozone could be said to be influenced globally by background
concentrations, locally generated concentrations and transported concentrations.
On the whole the chemometric multivariate analysis results confirmed our experimental
results and unfold the fact that meteorological influence plays a major role in the
atmospheric chemistry of ozone
.
Finally, these results and analysis suggested that ozone acting in concert with other
pollutants need to be recognized as important health and ecosystem related air quality
concern in Nigeria. Based on increasing evidence on regional transport of ozone all over the
world, there is need for recognition that ground – level ozone would be an appropriate issue
to be considered by the Nigerian government. In particular, a proactive measure has to be
formulated towards reducing NO
x
and SO
2
and by consequence O
3
in Nigeria.
Indoor and Outdoor Air Pollution
60
8. References
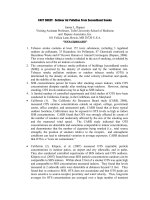
Abdul Raheem, A.M.O.; Adekola, F.A.; Obioh, I.B. (2009) Bull. Chem. Soc. Ethiop., 23 (3),
383 – 390
a
Abdul Raheem, A.M.O.; Adekola, F.A.; Obioh, I.B. (2009) Environ. Model. Assess. 14:487-509
b
Abdul Raheem, A. M. O; Adekola, F. A; Obioh, I. B. (2009) SCIENCE FOCUS, 14 (2)166 – 185
c
Abdul Raheem, A.M.O. (2007) Ph.D. Thesis, University of Ilorin, Nigeria
ACGIH (1991) American Conference of Governmental Industrial Hygienists Documentation
of Threshold Limit Values and Biological Exposure Indices, Vol. 2 pp 786-788. 6th ed.,
ACGIH Cincinnati
Alvarez, E., Pablo, F., Thomas, C., & Rivas, S. (2000) International Journal of Biometeorology,
44, 44–51.
Bakken, G. A., Long, D. R., & Kalvis, J. H. (1997) Examination criteria for local model
principal component regression. Applied Spectroscopy 51, 1814–1822.
Bloomfield, P., Royle, J. A., Steinberg, L. J., & Yang, Q. (1996) Atmospheric Environment 30,
3067
Chou, C. C K., Liu, S. C., Lin, C Y., Shiu, C J., & Chang, K H. (2006) Atmospheric
Environment 40, 3898–3908.
Cox, W. M., & Chu, S. H. (1992) Atmospheric Environment, 27B, 425.
Dara, S.S. (2004) A Textbook of Environmental Chemistry and Pollution Control, S. Chand and
Company Ltd. New Delhi 110055
ECE (1984) Effects of acidifying depositions and related pollutants on forest ecosystems, Executive
Body for the Convention on Long-Range Transboundary Air Pollution, Third
Session, Geneva; 5-9 March.
Einax, J. W., Zwanziger, H. W., & Geiss, S. (1997) Chemometrics in environmental analysis.
Weinheim: Wiley
Jackson, J. E. (1991) A user’s guide to principal components New York: Wiley
Jaffe, D. A. T., Covert, D., Kotchenruther, R., Trost, B., Danielson, J., Simpson, W., (1999)
Geophysical Research Letters 26, 711–714.
Klaus, D., Poth, A., & Voss, M. (2001) Atmosfera 14, 171–188.
Lengyel, A., Heberger, K., Paksy, L., Banhidi, O., & Rajko, R. (2004) Chemosphere 57, 889–896.
Menezes, K. A. & Shively, T. S. (2001) Environmental Science & Technology 35, 2554– 2561.
Norman, C. (1987) Analyzing multivariate data. San Diego, CA: Harcourt Brace Jovanovich
Onianwa, P.C.; Fakayode, S.O.; Agboola, B.O. (2001) Bull. Chem. Soc. Ethiop. 15, 71
Otto, M. (1999) Chemometrics statistics and computer application in analytical chemistry.
Weinheim: Wiley-VCH
Pissimanis, D. K., Notaridou, V. A., Kaltsounidis, N. A., & Viglas, P. S. (2000) Theoretical
and Applied Climatology 65, 49–62
Schutt, P.; Cowling, E.B. Plant Disease 1985, 69, 548.
Shively, T. S., & Sager, T. W. (1999) Environmental Science & Rechnology 33, 3873
Timm, N. H. (1985) Applied multivariate analysis. Englewood Cliffs, NJ: Prentice-Hill
Vautard, R., Builtjes, P. H. J., Thunis, P., Cuvelier, C., Bedogni, M., Bessagnet, B., (2007)
Atmospheric Environment 41, 173–188
Vogt, N. B. (1989) Chemometrics and Intelligent Laboratory Systems 7, 119–130
Watson, J. G. J. (1984) Air Pollution Control Association 34, 619–623
World Health Organization (WHO) (1981) Sulfur dioxide,
Environmental Health Criteria,
WHO: Geneva