báo cáo hóa học: " A radial basis classifier for the automatic detection of aspiration in children with dysphagia" doc
Bạn đang xem bản rút gọn của tài liệu. Xem và tải ngay bản đầy đủ của tài liệu tại đây (535.43 KB, 17 trang )
Journal of NeuroEngineering and
Rehabilitation
BioMed Central
Open Access
Research
A radial basis classifier for the automatic detection of aspiration in
children with dysphagia
Joon Lee1,3, Stefanie Blain1,2, Mike Casas1,4, Dave Kenny1,4, Glenn Berall1,5
and Tom Chau*1,2
Address: 1Bloorview Kids Rehab, Toronto, Ontario, Canada, 2Institute of Biomaterials and Biomedical Engineering, University of Toronto,
Toronto, Ontario, Canada, 3The Edward S. Rogers Sr. Department of Electrical and Computer Engineering, University of Toronto, Toronto,
Ontario, Canada, 4The Hospital for Sick Children, Toronto, Ontario, Canada and 5North York General Hospital, Toronto, Ontario, Canada
Email: Joon Lee - ; Stefanie Blain - ; Mike Casas - ;
Dave Kenny - ; Glenn Berall - ; Tom Chau* -
* Corresponding author
Published: 17 July 2006
Journal of NeuroEngineering and Rehabilitation 2006, 3:14
doi:10.1186/1743-0003-3-14
Received: 20 February 2006
Accepted: 17 July 2006
This article is available from: />© 2006 Lee et al; licensee BioMed Central Ltd.
This is an Open Access article distributed under the terms of the Creative Commons Attribution License ( />which permits unrestricted use, distribution, and reproduction in any medium, provided the original work is properly cited.
Abstract
Background: Silent aspiration or the inhalation of foodstuffs without overt physiological signs presents a serious
health issue for children with dysphagia. To date, there are no reliable means of detecting aspiration in the home
or community. An assistive technology that performs in these environments could inform caregivers of adverse
events and potentially reduce the morbidity and anxiety of the feeding experience for the child and caregiver,
respectively. This paper proposes a classifier for automatic classification of aspiration and swallow vibration signals
non-invasively recorded on the neck of children with dysphagia.
Methods: Vibration signals associated with safe swallows and aspirations, both identified via videofluoroscopy,
were collected from over 100 children with neurologically-based dysphagia using a single-axis accelerometer. Five
potentially discriminatory mathematical features were extracted from the accelerometry signals. All possible
combinations of the five features were investigated in the design of radial basis function classifiers. Performance
of different classifiers was compared and the best feature sets were identified.
Results: Optimal feature combinations for two, three and four features resulted in statistically comparable
adjusted accuracies with a radial basis classifier. In particular, the feature pairing of dispersion ratio and normality
achieved an adjusted accuracy of 79.8 ± 7.3%, a sensitivity of 79.4 ± 11.7% and specificity of 80.3 ± 12.8% for
aspiration detection. Addition of a third feature, namely energy, increased adjusted accuracy to 81.3 ± 8.5% but
the change was not statistically significant. A closer look at normality and dispersion ratio features suggest
leptokurticity and the frequency and magnitude of atypical values as distinguishing characteristics between
swallows and aspirations. The achieved accuracies are 30% higher than those reported for bedside cervical
auscultation.
Conclusion: The proposed aspiration classification algorithm provides promising accuracy for aspiration
detection in children. The classifier is conducive to hardware implementation as a non-invasive, portable
"aspirometer". Future research should focus on further enhancement of accuracy rates by considering other signal
features, classifier methods, or an augmented variety of training samples. The present study is an important first
step towards the eventual development of wearable intelligent intervention systems for the diagnosis and
management of aspiration.
Page 1 of 17
(page number not for citation purposes)
Journal of NeuroEngineering and Rehabilitation 2006, 3:14
Background
Dysphagia and aspiration
Dysphagia generally refers to any swallowing disorder.
Impaired swallowing may result from mechanical disorders due, for example, to the removal or reconstruction of
swallowing structures secondary to surgery for cancer [1]
or anatomic abnormalities of the mouth, nose, pharynx,
larynx, trachea and esophagus [2]. Compromised swallowing function can also be neurological in origin. Examples include lesions in the brain stem or peripheral cranial
neuropathies [3] and cortical lesions [4]. Disorders of
deglutition are common in neurological impairments due
to stroke, cerebral palsy or acquired brain injury. Children
with dysphagia often have heightened risk of aspiration.
Aspiration is entry of foreign material into the airway
below the true vocal cords [5] accompanied by inspiration
[6]. Approximately 25% of individuals at risk of aspiration do so in a "silent" manner [7], with no overt physiological signs (e.g. coughing, face turning red,
uncoordinated breathing) and care-givers may have no
warning that an aspiration has occurred.
Magnitude of problem
Dysphagia afflicts an estimated 15 million people in the
United States [8]. The incidence of dysphagia is particularly significant in acute care settings (25–45%) and longterm care units (50%) [9]. In the United States, approximately 50,000 persons die annually from aspiration
pneumonia [10].
Silent aspiration is especially prominent in children with
dysphagia, occurring in an estimated 94% of that population [11]. The occurrence of diffuse aspiration bronchiolitis in children with dysphagia is generally widespread
[12]. The increased risk of aspiration bears serious health
consequences such as dehydration, malnutrition, chronic
lung disease and acute aspiration pneumonia [2,11]. The
latter is an expensive outcome that often requires
extended hospitalization. Pulmonary aspiration can also
evolve to include systemic complications such as bacteremia, sepsis, and end-organ consequences of hypoxia and
death [13]. Chronic aspiration is therefore an insidious
problem that tremendously diminishes quality of life, not
only compromising a child's physical, but social, emotional and psychosocial well-being.
Current aspiration detection methodologies
Only the most prevalent methods of aspiration detection
in the current literature are reviewed. The modified barium swallow using videofluoroscopy is the current gold
standard for diagnosis of aspiration [14]. Its clinical utility
in dysphagia management continues to be asserted (e.g.,
[15,16]). The patient ingests barium-coated material and
a video sequence of radiographic images is obtained via X-
/>
radiation. The modified barium swallow procedure is
costly both in terms of time and labor (approximately
1,000 health care dollars per procedure in Canada), and
renders the patient susceptible to the nonstochastic effects
of radiation [17].
Fibreoptic endoscopy, an invasive technique in which a
flexible endoscope is inserted transnasally into the laryngopharynx, has also been widely applied, for example, in
the diagnosis of post-operative aspiration [18] and bedside identification of silent aspiration [19]. Fibreoptic
endoscopy is generally comparable to the modified barium swallow in terms of sensitivity and specificity for aspiration identification (e.g., [20,21]), with the advantage of
possible bedside assessment.
Pulse oximetry has also been proposed as a non-invasive
adjunct to bedside assessment of aspiration risk (e.g.,
[22,23]). However, several controlled studies comparing
pulse oximetric data to videofluoroscopic [24] and fibreoptic endoscopic evaluation [25,26] have raised doubts
about the existence of a relationship between arterial oxygen saturation and the occurrence of aspiration.
Cervical auscultation involves listening to the breath
sounds near the larynx by way of a laryngeal microphone,
stethoscope or accelerometer [27] placed on the neck. It is
generally recognized as a limited but valuable tool for
aspiration detection and dysphagia assessment in longterm care [27-29]. However, when considered against the
gold standard of videofluoroscopy, bedside evaluation
with cervical auscultation yields limited accuracy in
detecting aspirations [27] and abnormalities of swallowing [30]. Indeed, our recent research shows that aspirations identified by the clinician, represent only 45% of all
aspiration sounds [6].
Swallowing accelerometry [31] is closely related to cervical auscultation, but has entailed digital signal processing
and artificial intelligence as discrimination tools, rather
than the trained clinical ear. In clinical studies, accelerometry has demonstrated moderate agreement with videofluoroscopy in identifying aspiration risk [32] while the
signal magnitude has been linked to the extent of laryngeal elevation [31]. Fuzzy committee neural networks
have demonstrated extremely high accuracy at classifying
normal and "dysphagic" swallows [33].
Administration of existing procedures, such as videofluoroscopy or fibreoptic endoscopy, usually requires expensive equipment and specially trained professionals such as
a speech-language pathologist, radiologist or otolaryngologist [34]. Further, the invasive nature of procedures such
as fibreoptic endoscopy does not bode well with children
and therefore the method cannot be practically adminis-
Page 2 of 17
(page number not for citation purposes)
Journal of NeuroEngineering and Rehabilitation 2006, 3:14
tered for extended periods of feeding. Clearly, there is an
identified but unmet need for an economical [22], noninvasive and portable method of paediatric aspiration
detection [32], at the bedside [25] and outside of the institutional setting.
As an important step towards addressing this unmet need,
we present details of a classifier for automatic detection of
aspiration in children with dysphagia. In the next section,
we outline the methods pursued in developing the classifier. Subsequently, we report quantitative classification
results using different candidate feature sets. We also
briefly describe one possible hardware implementation of
the classifier. The paper closes with a discussion of the
merits and limitations of the classification algorithm and
future directions of research. It is anticipated that such a
classifier once implemented in a portable computing platform could assist caregivers in their interventions to manage heightened aspiration risk.
/>
signal was sampled at 10 kHz. The child was fed a bariumcoated bolus of varying consistencies as per the modified
barium swallow procedure [15]. Categories of consistencies included thick, medium and thin purées, honey, nectar, thin liquid and soup. Video X-rays were recorded on
tape in analog form (Panasonic VCR, model AG-6200),
while accompanying time-synchronized vibration signals
were amplified and recorded onto a laptop computer
(Apple PowerBook G3, 266 MHz) via an external 12-bit
data acquisition unit (Biopac, model MP100). The raw
data were denoised by wavelet soft-thresholding using a
Daubechies-4 filter. Video X-ray recording was triggered
by the initial activation of the X-ray emitter, operated by
the presiding radiologist. Time-stamping of the video
(FORA video timer, model VTG-55) and recording of the
vibration signal were triggered simultaneously, by the presiding pediatrician via a pushbutton switch, upon observation of swallow initiation. In this manner, the time code
on the analog video corresponded to the time index of the
digital recording of the vibration signal.
Methods
Representation of swallowing activity
Based on the clinical appeal of cervical auscultation and
the recent success of swallowing accelerometry described
above, we decided to represent swallowing activity, in particular, aspirations and safe swallows, by way of anteriorposterior vibrations at the neck. This choice of representation proved meaningful in our previous study of pediatric
aspirations [6].
Data collection for system design and evaluation
In order to construct an automatic classification method,
we required examples of aspiration and swallow vibrations. To this end, one hundred and seventeen children
suspected to be at risk of aspiration were recruited to this
study. Parents or caregivers gave their informed consent
prior to each child's participation. The protocol was
approved by the Research Ethics Board of Bloorview Kids
Rehab (Canada). The mean age of the participants was 6.0
± 3.9 years with 64 males and 53 females. Swallowing difficulty in all the participants was neurological in origin,
with the overwhelming majority having a primary diagnosis of cerebral palsy.
Lateral fluoroscopic video (General Electric X-ray System,
RFX-90) of the cervical region and simultaneous, timesynchronized accelerometric data were collected from
each child during routine videofluoroscopic examination.
As shown in Figure 1, a small single-axis accelerometer
(EMT 25-C, Siemens) was attached to the child by way of
double-sided tape, infero-anterior to the thyroid notch.
This accelerometer, with a sensitivity of 80 mV/g, was chosen for its flat frequency response, from 30 Hz to 20 kHz,
covering the previously reported range of frequencies relevant to swallowing activities [35,36]. The accelerometer
The video records were subjected to retrospective blind
review by a committee of three to four clinical experts, for
the purpose of aspiration identification. The vibration signals associated with the identified instances of aspirations
were carefully extracted, reviewed by committee and
checked for sound quality. Each aspiration sample was
further assigned one of four possible descriptive labels
based on a consensus classification of the sound by the
committee of the clinical experts. These labels are summarized in Table 1. Additional details of aspiration signal
extraction can be found in [6]. By this procedure, 94 aspiration and 100 swallow signals were extracted.
Feature extraction
Critical to any successful classifier is the prudent extraction and selection of discriminatory features. Stationarity,
normality, dispersion ratio, zero-crossings and energy features provided statistically different unidimensional distributions for swallows and aspirations, by a rank sum test
(p ≤ 8.5 × 10⁻⁴ for each of the five features). Note that stationarity, normality and dispersion ratio can be considered as capturing time domain information, whereas
energy and zero-crossing features relate to spectral information in the signals. Each of the five features is described
below.
Stationarity
Weak stationarity implies that the mean and variance of
the signal do not change over time. Determination of stationarity is important in selecting the appropriate analytical method, such as in the fractal characterization of time
series [37]. The reverse arrangement test is a simple, nonparametric test for stationarity [38]. For convenience, we
Page 3 of 17
(page number not for citation purposes)
Journal of NeuroEngineering and Rehabilitation 2006, 3:14
/>
Detector
Accelerometer
X-ray emitter
Trigger
Sensor amplifier
Time code
generator
Insert
timecode
Start
counting
Start recording
Video recorder
Lap top computer
Figure 1
Data collection set-up for the simultaneous acquisition of time-synchronized videofluoroscopic and accelerometric data
Data collection set-up for the simultaneous acquisition of time-synchronized videofluoroscopic and accelerometric data.
Page 4 of 17
(page number not for citation purposes)
Journal of NeuroEngineering and Rehabilitation 2006, 3:14
/>
Table 1: Descriptive labels of aspiration signals
Label
Outstanding quality in signal
squeak
crunch
click
clip
Characteristic high frequency inspiratory squeak
Dull crunching sound
Short single click
High amplitude sound with fuzzy quality
MAD =
1 n
∑ xi − med ( x )
n i =1
where med(x) is the median of the signal. The interquartile range, denoted here as IQR, is defined as
IQR = q0.75 - q0.25
used the associated test statistic as the stationarity feature,
that is,
z−A=
A − μA
σA
(1 )
Under the null hypothesis of stationarity, zA is distributed
as a standard normal with zero mean and unit variance.
Hence, at the 5% significance level, |zA| < 1.96 for a stationary signal. For a step-by-step procedure for calculating
the number of reverse arrangements, A, please see [38].
Normality
Normality measures the adherence of a signal's amplitude
distribution to that of an ideal normal distribution. Suppose we have a signal of length n. To compute this feature,
the signal's amplitude is first divided into a finite number
of intervals or bins, I, I <
falls into each bin, yielding so-called observed frequencies. For each bin, we can also compute an expected frequency, that is the number of observations one would
expect had the signal's amplitude been normally distributed. From these quantities, we derived a normality feature, N, on the basis of the Chi-square test for normality
[39], namely,.
I
ˆ
( ni − mi )2
i =1
ˆ
mi
N=∑
(2)
In the above, ni is the observed frequency in the ith bin, and
ˆ
mi is the expected frequency in the same bin under the
null hypothesis of a normal amplitude distribution.
Dispersion ratio
Dispersion ratio is the ratio between the mean absolute
deviation and the interquartile range of a signal. The
mean absolute deviation, MAD, can be found by,
(4)
where q0.25 and q0.75 are the first and third quartiles of the
signal's amplitude distribution. The dispersion ratio is
expressed as,
D=
Here, A is the number of reverse arrangements in the signal, and μA and σA, defined as in [6], only depend on the
length of the signal.
( 3)
MAD
IQR
( 5)
and can be interpreted as capturing the difference between
a non-robust (mean absolute deviation) and a robust
(interquartile range) estimate of spread. This feature thus
roughly reflects the nature and multiplicity of atypical
observations within the signal. In the absence of such a
typical observations, the ratio would tend to unity. For
further details about the constituent computations for this
feature, please see for example [40].
Zero-crossings
The number of zero-crossings in a signal is an often used
feature which can be easily computed in the time domain,
but loosely reflects the overall frequency content of the
signal. Suppose we have a signal with n samples,
{x1,...,xn}. We estimated the zero-crossing feature by,
Z = card{xi | sign(xi) ≠ sign(xi+1)} - card{xj | sign(xj) = 0}
(6)
for i = 1,...,n - 1 and j = 1,...,n. In the above, card denotes
cardinality of the set while sign(x) is the sign function. We
subtract the actual number of points whose value is zero
(the second term above) to avoid double-counting the
number of zero-crossings.
Energy
Since pediatric aspiration signals are often non-stationary
[6], we adopted a wavelet-based estimate of signal energy,
previously proposed as a discriminatory feature for the
classification of biomechanical signals [41,42]. In particular, the chosen energy feature was the sum of the squared
detailed coefficients at the fourth level of a five-level
Daubechies-4 wavelet transform [43]. This feature represents the energy of the low frequency components in the
observed accelerometry signal. Given a 5-level discrete
wavelet decomposition (DWT) of a signal xi into an
approximation (a5) and detail signals (d5,...,d1), i.e.,
DWT [xi] = [a5|d5, d4, d3, d2, d1]
(7)
Page 5 of 17
(page number not for citation purposes)
Journal of NeuroEngineering and Rehabilitation 2006, 3:14
the selected energy feature is simply given as
E=
n /16
2
∑ d4 j
(8)
/>
layers, i.e. every node is connected to every other node in
the next layer. The output function can be written as a linear summation of the gaussian kernels evaluated at the
current input vector, x,
j =1
M
where due to successive downsampling of the signal, there
are n/16 coefficients at the 4th level of decomposition. The
choice of this feature was motivated by the fact that swallowing signals tend to contain frequency peaks from a few
hundred Hertz to around 1 kHz [36,44], whereas our
observations suggest that aspirations signals have higher
pitched components.
Radial basis classifier design
A radial basis function network, a highly versatile and easily implementable classifier, was chosen to facilitate the
selection of decisive features. The radial basis function
network is a universal function approximator [45]. In
other words, given sufficient training samples and unlimited hidden units, the network is able to model any continuous function between the inputs and outputs. It has
also been argued that the radial basis network is suited to
multimodal data [46], sports favourable convergence
rates and provides statistically consistent estimation [47].
Additionally, radial basis function networks can be
trained with standard linear techniques, circumventing
gradient descent training issues that plague conventional
back-propagation trained feedforward networks [48].
Radial basis networks have been deployed frequently in
rehabilitation engineering, for example, in the control of
neural prostheses [49] and in the design of an intelligent
wheelchair guidance system [50].
For our experiments, the number of inputs to the network
equaled the number of features, ranging from 1 to 5. The
network had a single output, coded to represent aspirations by a numerical value of 0.9 and swallows with a
value of 0.1. These values were chosen to mitigate saturation of the basis functions. The gaussian radial basis function was selected for its proven approximation
capabilities. The number of radial basis units was
increased as necessary during training to achieve the targeted performance. Initially, all networks started with two
basis units and this was increased by five at each training
iteration to a maximum equal to the number of training
exemplars. The termination criterion for training was a
successive error of 0.1. This coarse error margin was considered sufficient since our target values of 0.1 and 0.9 can
be resolved at this precision. Figure 2 portrays the radial
basis function network architecture for the five input feature case. All other networks would have a subset of the
five features and hence fewer input nodes. For clarity, we
have intentionally omitted bias factors at each layer and
have used bold arrows to denote full connections between
f ( x ) = ∑ wi G ( || x − c i || )
( 9)
i =1
where wi is the weight from the ith radial basis to the output layer, G(·) is the radial basis kernel, ci is the center of
the ith radial basis function and ||·|| denotes Euclidean
distance. In Figure 2, we have x = [SNDZE]T. For further
details on radial basis network architectures and training
algorithms see [45,51]. The simulation experiments were
conducted in MATLAB.
Evaluation of feature sets
To identify which combinations of the above features
yield the best discriminatory potential with a radial basis
classifier, we formed all possible unique combinations of
one through five features. In total, there were
∑ m=1 C (5,
5
m) = 31 unique feature combinations, where C(n, m)
means n choose m combinations. For each feature combination, we performed a 10-fold cross-validation [48] estimate of various classification performance measures
described below. The 90%–10% split was deemed to provide a reasonably sized test set based on the sample size of
available data (100 swallows + 94 aspirations = 194
instances).
The interfeature correlations were calculated to gauge the
amount of overlapping information captured by each feature. Additionally, the correlations between each feature
and descriptive aspiration label (Table 1), bolus consistency, participant's age and gender were computed. These
correlations would hopefully help to ascertain the clinical
information, if any, reflected in each feature.
Classifier performance measures
To judge the relative merits of each feature combination,
we computed some standard performance measures.
Before discussing these measures, we need to clarify the
meaning of some terminology in the context of the
present application. Positive and negative detections refer
to classification decisions of aspirations and swallows,
respectively. Therefore, a false positive (FP) is the event of
classifying a vibration signal as an aspiration when a swallow has actually occurred, whereas a false negative (FN) is
the event of classifying a vibration signal as a swallow
when an aspiration has actually occurred. Likewise an
aspiration that is correctly classified as such is a true positive (TP) and a correctly classified swallow is a true nega-
Page 6 of 17
(page number not for citation purposes)
Journal of NeuroEngineering and Rehabilitation 2006, 3:14
/>
f(S,N,D,Z,E)
Output
Σ
Radial
basis
layer
...
Inputs
S
N
D
Z
E
Radial basis function architecture for aspiration detection, shown here with all five features
Figure 2
Radial basis function architecture for aspiration detection, shown here with all five features. S = stationarity, N = normality, D
= dispersion ratio, Z = zero-crossings, E = energy.
tive (TN). The most common measure of classifier
performance is accuracy, defined as
Accuracy =
TP + TN
TP + FP + TN + FN
( 10 )
where the denominator is simply the total number of
attempted classifications and corresponds to the size of
the test set in the each cross-validation iteration. Accuracy
only gives a global sense of classifier performance and
may not be very meaningful when the number of swallows and aspirations in the test set are unbalanced.
We thus also examine classifier performance on aspirations and swallows individually. Sensitivity is the proportion of actual aspirations that are correctly classified as
aspirations,
Page 7 of 17
(page number not for citation purposes)
Journal of NeuroEngineering and Rehabilitation 2006, 3:14
TP
Sensitivity =
TP + FN
workhorse microcontroller as all computations can be
made in the time domain, in real-time.
( 11 )
whereas specificity is the proportion of actual swallows
that are correctly classified as swallows,
Specificity =
TN
TN + FP
( 12 )
Lastly, the adjusted accuracy [52], a measure which
accounts for unbalanced sample sizes of positive (aspirations) and negative (swallows) events was also computed.
The adjusted accuracy, combines sensitivity and specificity into a single measure given simply by
Adjusted accuracy =
Sensitivity + Specificity
2
/>
( 13 )
Results
Sample signals
Figure 3 portrays some typical aspiration and swallow signals recorded from pediatric clients during the modified
barium swallow procedure. Immediately, one notices that
swallow signals are typically longer in duration and dominated by low frequency fluctuations. In contrast, aspiration signals are generally shorter, but can exhibit both
remarkable high frequency components (top and middle
graphs on the right hand side of Figure 3), as well as dominant low frequency trends (bottom right graph of Figure
3).
Optimum combination of features
The classification results with the 31 unique feature combinations are tabulated in Table 2. The size of the feature
set ranges from 1 to 5. The best feature combination for
each size of feature set is labeled with an asterisk. Examining the adjusted accuracy column, the best two-feature
combination is that of dispersion ratio and normality.
This duality is slightly more sensitive but less specific than
the best tripartite combination of dispersion ratio, energy
and normality. However, these differences are not statistically significant (p > 0.2) due to the large variability in
sensitivity and specificity values.
Going from the best three to four features (dispersion
ratio, energy, normality and stationarity), the classifier
becomes less sensitive but more specific at identifying
aspirations. Again, however the differences are not significant (p > 0.3).
Also noteworthy, the three-feature combination of dispersion ratio, normality, and stationarity yielded sensitivity
and specificity values most comparable to the dispersionnormality duo. Both these feature combinations would be
particularly amenable to implementation on a standard
We note that as the number of features increases, the performance improves initially, but stabilizes, then diminishes. This behavior is portrayed by the sequence of
notched box plots in Figure 4. Only the cross-validated
adjusted accuracies for the best feature combinations are
shown. There is a statistically significant increase in
adjusted accuracy from 1 to 2 features (p = 0.041) by the
Kruskal-Wallis test. There is no significant difference (p =
0.9) among the accuracies using 2, 3 and 4 features. However, from 4 to 5 features, there is significant decrease in
adjusted accuracy (p = 10-4). This trend is in agreement
with common wisdom in pattern recognition [48]. Hence,
performance is statistically equivalent with either the best
2, 3 or 4 features. From the perspective of computational
economy, the fewer the features, the more desirable the
solution.
Clinical correlates
Pairwise correlation coefficients among the five features
extracted from the accelerometry signals are given in Table
3. Apart from normality and zero-crossings which appear
to be somewhat positively correlated, the other features
are only weakly correlated. This suggests that the features
are generally representing different pieces of information
about the vibration signals. In conventional regression
analysis, it is usually desirable to have uncorrelated independent variables [53]. The general lack of correlation
implies that the selected features could also be exploited
by simpler classifiers based on multivariate regression
modeling.
Pairwise correlations among the extracted features for
aspirations and the four clinical variables are presented in
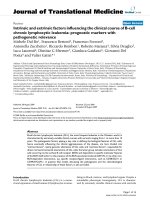
Table 4. Surprisingly, there were no noteworthy correlations, either positive or negative. This result implies that
the fundamental nature of aspiration signals, as represented by the extracted features, do not depend on bolus
consistency, age and gender of the participants. Moreover,
the criteria used by clinicians to assign a descriptive label
to the aspiration signal are likely very different from the
identified mathematical features.
Discussion
Features for pediatric aspiration detection
From our experiments, normality and dispersion ratio
form a good feature combination in terms of separating
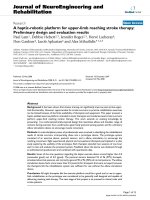
aspirations and swallows. Figure 5 depicts the feature
space for this optimal 2-dimensional feature combination. We can visually verify that swallows and aspirations
are roughly quadratically separable in this feature space.
Page 8 of 17
(page number not for citation purposes)
Journal of NeuroEngineering and Rehabilitation 2006, 3:14
/>
Swallows
Aspirations
5
0.6
0.4
0.2
0
0
−0.2
−0.4
0
50
100
150
200
250
300
350
400
1
−5
0
10
20
30
40
50
5
0
0
−1
−5
0
50
100
150
200
250
300
350
0
20
40
60
80
100
120
140
160
0.5
0.2
0
0
−0.2
−0.5
0
100
200
300
400
500
Time (ms)
0
100
200
300
400
500
600
Time (ms)
Figure 3
Sample swallow signals on the left and aspiration signals on the right
Sample swallow signals on the left and aspiration signals on the right. Note that swallows are typically longer in duration and
dominated by low frequency components. Aspirations come in many flavours, some with noticeable high frequency elements
(top and middle graphs on right side), but others with predominantly low frequency components (bottom right graph).
To understand the reason for the good separability by the
normality feature, we examine the skewness and kurtosis
of the empirical data. Here we use the convention that
normally distributed data have 0 skewness and 0 kurtosis.
Figure 6 portrays histograms of the skewness and kurtosis
of aspirations in the top 2 figures and the corresponding
statistics for swallows in the bottom 2 figures. While swallows have higher variability in skewness values, we see
that aspirations and swallows exhibit similar skewness
histograms (p = 0.542). These histograms suggest that
amplitude distributions of both aspiration and swallow
signals are generally symmetrical, although there are some
positively and negatively skewed signals. Hence, the difference in normality is likely not attributable to differences in skewness.
Moving on to kurtosis, we remark that the right half of Figure 6 clearly shows that swallows are significantly more
leptokurtic [38] than aspirations (p << 10-5). This marked
difference in kurtosis values is a highly probable reason
for observed statistical difference in normality between
aspirations and swallows. The leptokurtic nature of swallows suggests that they are more peaked than a normally
distributed signal, with thicker tails. In the present application, leptokurticity may be due to the heteroscedasticity
of the signals, that is, the changing variance of the signal
over the course of time. Particularly, the combination of
two normal signals with different variances can produce a
leptokurtic signal. This kind of heteroscedastic behaviour
has been identified in speech signals [54].
Examining the value of dispersion ratios in Figure 5, we
note that aspirations tend to have dispersion ratios less
than one. Bearing in mind the influence functions [55] for
mean absolute deviation and interquartile ranges, we
infer that aspiration signals generally sit in the "stable"
region of the influence function, where in fact, the mean
absolute value is less than the interquartile range. Practically, this means that aspiration signals have fewer atypical values, leading to a closer agreement between robust
and non-robust spread estimates. On the other hand,
swallows frequently have dispersion ratios in excess of
1.0, suggesting that outlying values are exerting undue
influence on the non-robust mean absolute deviation
value. In short, the normality and dispersion ratio features
seem to capture fundamental differences between aspiration and swallow signals and hence in concert, provide a
good feature space for classification.
In terms of adjusted accuracy, our present results indicate
that statistically, there is no need to include a third feature, at least, none of the ones we have selected.
It is important to note here that not all features are equally
implementable in hardware. For instance, the energy feature described in this paper is not easily implementable
Page 9 of 17
(page number not for citation purposes)
Journal of NeuroEngineering and Rehabilitation 2006, 3:14
/>
Table 2: Performance comparison of all possible feature combinations
Combination
*D
E
Z
N
S
D-E
D-Z
*D-N
D-S
E-Z
E-N
E-S
Z-N
Z-S
N-S
D-E-Z
*D-E-N
D-E-S
D-Z-N
D-Z-S
D-N-S
E-Z-N
E-Z-S
E-N-S
Z-N-S
D-E-Z-N
D-E-Z-S
*D-E-N-S
D-Z-N-S
E-Z-N-S
*D-E-Z-N-S
Accuracy
Sensitivity
Specificity
Adjusted Accuracy
0.711 ± 0.090
0.521 ± 0.084
0.584 ± 0.115
0.695 ± 0.126
0.642 ± 0.099
0.679 ± 0.101
0.579 ± 0.082
0.800 ± 0.078
0.642 ± 0.126
0.563 ± 0.117
0.758 ± 0.093
0.537 ± 0.138
0.595 ± 0.134
0.574 ± 0.164
0.742 ± 0.091
0.568 ± 0.128
0.821 ± 0.090
0.495 ± 0.097
0.584 ± 0.139
0.605 ± 0.127
0.784 ± 0.104
0.547 ± 0.109
0.553 ± 0.136
0.805 ± 0.093
0.542 ± 0.127
0.547 ± 0.109
0.547 ± 0.132
0.811 ± 0.090
0.542 ± 0.127
0.537 ± 0.116
0.537 ± 0.116
0.722 ± 0.133
0.489 ± 0.170
0.703 ± 0.242
0.780 ± 0.173
0.557 ± 0.178
0.656 ± 0.155
0.505 ± 0.195
0.794 ± 0.117
0.612 ± 0.183
0.452 ± 0.166
0.738 ± 0.181
0.456 ± 0.181
0.226 ± 0.133
0.482 ± 0.304
0.706 ± 0.146
0.481 ± 0.217
0.747 ± 0.160
0.436 ± 0.194
0.304 ± 0.241
0.507 ± 0.299
0.760 ± 0.176
0.071 ± 0.078
0.185 ± 0.133
0.658 ± 0.168
0.072 ± 0.091
0.071 ± 0.078
0.172 ± 0.119
0.670 ± 0.160
0.072 ± 0.091
0.052 ± 0.081
0.052 ± 0.081
0.698 ± 0.125
0.589 ± 0.174
0.536 ± 0.219
0.608 ± 0.165
0.720 ± 0.090
0.692 ± 0.137
0.673 ± 0.177
0.803 ± 0.128
0.641 ± 0.219
0.687 ± 0.109
0.764 ± 0.180
0.628 ± 0.200
0.958 ± 0.071
0.693 ± 0.187
0.783 ± 0.117
0.680 ± 0.180
0.878 ± 0.122
0.532 ± 0.103
0.868 ± 0.278
0.737 ± 0.160
0.809 ± 0.078
1.000 ± 0.000
0.911 ± 0.095
0.922 ± 0.090
1.000 ± 0.000
1.000 ± 0.000
0.911 ± 0.095
0.922 ± 0.090
1.000 ± 0.000
1.000 ± 0.000
1.000 ± 0.000
0.710 ± 0.089
0.539 ± 0.077
0.620 ± 0.120
0.694 ± 0.130
0.638 ± 0.095
0.674 ± 0.101
0.589 ± 0.077
0.798 ± 0.073
0.627 ± 0.137
0.569 ± 0.118
0.751 ± 0.090
0.542 ± 0.141
0.591 ± 0.085
0.588 ± 0.170
0.745 ± 0.097
0.581 ± 0.126
0.813 ± 0.085
0.484 ± 0.102
0.586 ± 0.090
0.622 ± 0.143
0.784 ± 0.110
0.536 ± 0.039
0.548 ± 0.083
0.790 ± 0.099
0.536 ± 0.046
0.536 ± 0.039
0.542 ± 0.077
0.796 ± 0.095
0.536 ± 0.046
0.526 ± 0.041
0.526 ± 0.041
Note: S = stationarity, N = normality, D = dispersion ratio, Z = zero-crossings, E = energy.
* denotes the best feature combination for each dimension of feature set.
with a standard microcontroller without digital signal
processing capabilities. In general, features requiring spectral analysis are more difficult to implement in hardware
than those requiring strictly time-domain computations.
Aspiration classifier
The proposed feature combinations and radial basis classifier achieved approximately 80% adjusted accuracy in
classifying aspirations and swallows. This accuracy level
already exceeds that achievable by the best trained clinician using cervical auscultation at the bedside, where one
typically achieves no better than 40 to 60% accuracy
[22,24]. Recently, in a study involving eleven expert
judges and a small sample of 20 stethoscopic sounds of
"normal" and "abnormal" swallowing, individual rater
specificity and sensitivity for aspiration/penetration detection were only 66% and 62%, respectively [30]. We thus
argue that the proposed classifier is an important first step
towards developing a non-invasive aspiration detection
method in the paediatric population.
A classifier can make false positive and false negative
errors, each with a potentially different associated cost.
From the medical perspective, clearly missing multiple
aspirations (false negatives) is a costly error bearing serious health consequences described previously. However,
from a caregiver perspective, rampant false alarms may
unnecessarily limit oral feeding, which in turn may have
negative nutritional impact. In developing a clinically useful system, the tradeoff between these two errors should
be carefully considered and perhaps tailored to the individual client and family situation.
While we have elected to use a universal function approximator in the radial basis function network, knowing
some discriminatory features, one could certainly con-
Page 10 of 17
(page number not for citation purposes)
Journal of NeuroEngineering and Rehabilitation 2006, 3:14
/>
0.95
0.9
Adjusted Accuracy
0.85
0.8
0.75
0.7
0.65
0.6
0.55
0.5
1
2
3
4
5
Number of Features
Figure 4
Notched boxplots showing change in adjusted accuracy as the number of features are increased from 1 to 5
Notched boxplots showing change in adjusted accuracy as the number of features are increased from 1 to 5. Only the best feature combination for each number of features is shown.
sider simpler alternatives such as a piecewise linear discriminant classifier [48] or a nearest-neighbour algorithm
[56] as a viable and perhaps more suitable solution for
micro-controller implementation.
Hardware implementation of the aspirometer
We contend that the proposed classifier can be easily realized in hardware as a portable and non-invasive swallowsafety monitor. In this section, we briefly describe one
Table 3: Correlation among extracted features
Dispersion Ratio
Zero-Crossings
Stationarity
Normality
Energy
Energy
Normality
Stationarity
-0.2486
-0.1417
0.3554
0.1881
-0.1331
-0.0690
-0.0829
0.6357
-0.3414
-0.3888
Page 11 of 17
(page number not for citation purposes)
Journal of NeuroEngineering and Rehabilitation 2006, 3:14
/>
Table 4: Correlation among features and clinical variables
Bolus Consistency
Gender
Clinical Class
-0.0098
0.0190
0.0285
-0.1808
0.0323
Dispersion Ratio
Energy
Normality
Stationarity
Zero-Crossings
Age
0.0971
-0.0223
0.1064
-0.0954
-0.0027
-0.1012
0.0275
0.0116
-0.1019
0.0262
-0.0968
0.0300
0.0219
-0.1817
0.1676
such implementation, noting that many other variations
are possible. We have coined the term "aspirometer" for
the the hardware device that encapsulates the proposed
250
classification algorithm. A working prototype of this
aspirometer has been constructed at Bloorview Kids
Rehab in Toronto, Canada.
Aspirations
Swallows
Normality
200
150
100
50
0.4
0.6
0.8
1
1.2
1.4
1.6
1.8
Dispersion ratio
Figure 5
Normality-dispersion ratio plane
Normality-dispersion ratio plane. With these 2 features, swallows and aspirations appear to be well separated. Note that one
outlying observation was omitted from this plot for the sake of clarity.
Page 12 of 17
(page number not for citation purposes)
Journal of NeuroEngineering and Rehabilitation 2006, 3:14
/>
Aspirations
40
50
40
30
30
20
20
10
0
10
−2
0
2
0
4
0
10
20
30
40
50
10
20
30
40
50
Swallows
25
20
20
15
15
10
10
5
5
0
−2
0
2
4
0
0
Skewness
Kurtosis
Figure 6
Skewness and kurtosis of aspirations (top row) and swallows (bottom row)
Skewness and kurtosis of aspirations (top row) and swallows (bottom row).
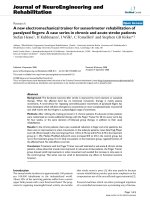
Figure 7 is a block diagram of the aspirometer. The prototype consists of a single-axis accelerometer (EMT-25C, Siemens), a custom sensory amplifier, a hardware codec
(AD1881A, Analog Devices), a microcontroller (ADSP
21160M, Analog Devices), a flash memory (M29W040B,
St. Microelectronics), a custom power distribution and
low battery indicator board and two LEDs (red and green)
for visual output. The accelerometer is attached to the
child's neck by way of double-sided tape. The amplifier
provides a twenty-times amplification with an anti-aliasing filter. The microcontroller performs data acquisition,
feature extraction, classificaiton and output LED control.
The microcontroller's memory is volatile, hence the soft-
ware is stored in the flash memory and retrieved by the
microcontroller each time the device is initialized. The red
and green LEDs indicate aspiration and swallow, respectively. The entire unit is powered by two high energy
nickel metal hydride (NiMh) batteries (2700 mAh, 1.2 V,
Sanyo).
Rehabilitative strategies
Upon aspiration notification by the aspirometer, the caregiver may intervene in a variety of different ways, in
accordance with recommendations by the clinical care
team. For example, the caregiver might encourage the
child to attempt a voluntary cough to bring up any residue
Page 13 of 17
(page number not for citation purposes)
Journal of NeuroEngineering and Rehabilitation 2006, 3:14
/>
Figure 7 of the aspirometer: one possible implementation of the proposed classifier
Overview
Overview of the aspirometer: one possible implementation of the proposed classifier.
Page 14 of 17
(page number not for citation purposes)
Journal of NeuroEngineering and Rehabilitation 2006, 3:14
that may have entered the airway. For subsequent feeding,
the bolus consistency may be appropriately modified or
the the position of the child may be adjusted [21]. The caregiver may also reduce the speed and/or volume of presentation of food to facilitate subsequent swallows.
Recurrent aspiration warnings, especially in combination
with clinical evidence such as chest disease particularly if
recurrent, evidence of aspiration on a chest X-Ray, recurrent fevers, unexplained choking with feeds, coughing
with feeds, a raspy breathing pattern, wet voice or deteriorating breathing pattern while feeding would indicate the
need for videofluoroscopic re-assessment by the clinical
care team.
Potential impact of an aspirometer
It is anticipated that an aspirometer device would have
significant impact in pediatric rehabilitation, primary and
tertiary care, particularly in individuals who tend to aspirate silently. Firstly, reliable, non-invasive aspiration
detection would be available at bedside, at home, at
school and in the community. Neither clinical experts nor
expensive equipment would be required. Caregivers
would have a peace of mind when feeding the child with
dysphagia. Secondly, an aspirometer device could potentially facilitate a better referral strategy for videofluoroscopic examinations (VFE). Currently, in many remote or
medically under-serviced communities, radiology suites
are in short supply and waiting lists can be many months
long. The aspirometer might serve as a pre-screening tool
to identify those for whom VFE is warranted. Waiting
times for videofluoroscopy could conceivably be reduced
as a result.
Limitations and future extensions
The current classifier formulates its decision solely on a
unidimensional vibration signal and has no knowledge of
other physiological indications, such as discoordinated
breathing, which may accompany aspiration. Hence, the
addition of other physiological data such as ventilation,
facial muscle activities, and heart rate may further
enhance and temporally advance aspiration detection.
However, it would be technically challenging to integrate
these different information sources into a portable and
self-contained device.
The current classifier was constructed from 94 aspiration
and 100 swallow samples. This sample limits the dimensionality of the feature space in which class densities may
be estimated, as per the curse of dimensionality [57]. The
sample size also constrains the number of folds used in
cross-validation. With larger samples, we may be able to
minimize the variance in the estimated performance indices. We note however, that as noted in [6], it is extremely
difficult to assemble a large database of pediatric aspira-
/>
tion signals due to their relatively infrequent occurrence
in a clinical setting.
The current results have been obtained only with pediatric
data and can not be generalized to adults. Future studies
employing similar methodology with adults are required
to ascertain the generalizability of automatic aspiration
detection using the proposed features and classifier.
We have discussed five candidate features in this paper.
Further research into discriminatory features may enhance
the dispersion-normality duality to provide even higher
specificity and sensitivity. Further, the generalization of
the swallow class to a generic non-aspiration class which
includes guttural sounds, vocalizations, coughing and crying noises may help to reduce false positives.
Conclusion
The proposed pediatric aspiration classifier provides
promising accuracies. It is particularly conducive to
implementation as a portable, non-invasive "aspirometer" device. Dispersion ratio and normality prove to be
especially good features for distinguishing aspirations
from safe swallows, while sub-band energy appears to be
a useful additional feature. A radial basis network offers a
versatile architecture for classifier exploration but simpler
classifiers may also be suitable on the basis of the proposed feature spaces. The proposed classifier can be further enhanced by considering other features and
expanding the scope of swallowing events for training.
The ultimate application of such a classifier might be a
wearable detection/intervention system for the management of aspiration risk.
Authors' contributions
JL wrote the abstract, methods, results and discussion sections of the manuscript. JL also generated the tables. SB
designed the hardware implementation of the classifier
algorithm, tested the microcontroller implementation
and contributed to the hardware section of the paper. She
also characterized the accelerometer employed in the
study. MC spearheaded the set-up of the instrumentation
and reviewed videofluoroscopic data. DK reviewed videofluoroscopic data and advised throughout the study. GB
recruited clients for the study, identified aspiration events
during videofluoroscopy, reviewed videofluoroscopic
data and contributed to parts of the discussion section.
MC, DK and GB initiated and completed pilot studies. TC
oversaw data collection and data analysis, wrote the background, data collection and selected portions of the methods, results and discussion sections of the manuscript. He
also generated the graphs in the results section.
Acknowledgements
The authors would like to acknowledge funding from the University of
Toronto (JL), Natural Sciences and Engineering Research Council (TC),
Page 15 of 17
(page number not for citation purposes)
Journal of NeuroEngineering and Rehabilitation 2006, 3:14
Canada Research Chairs Program (TC), Bloorview Childrens Hospital
Foundation (DK, MC, GB) and Rani Ghar Grotto Cerebral Palsy Foundation (DK, MC, GB). We are also indebted to the families and children who
participated in the many months of data collection. TC would also like to
acknowledge useful discussions with Catriona Steele and Pascal van Lieshout about clinical applications of the aspirometer.
/>
22.
23.
24.
References
1.
2.
3.
4.
5.
6.
7.
8.
9.
10.
11.
12.
13.
14.
15.
16.
17.
18.
19.
20.
21.
Groher M, Gonzalez E: Mechanical disorders of swallowing. In
Dysphagia: diagnosis and management Edited by: Groher M. Stoneham,
MA: Butterworth-Heinemann; 1992:53-84.
Sheppard J: Pediatric dysphagia and related medical, behavioral and developmental issues. In Dysphagia: a continuum of care
Edited by: Sonies B. Gaithersburg, MD: Aspen Publishers Inc;
1997:55-74.
Doty R: Neural organization of deglutition. In Handbook of physiology: alimenatray canal motility Edited by: Code C. Washington, DC:
American Physiological Society; 1998:1861-1902.
Zorowitz R, Robinson K: Pathophysiology of dysphagia and
aspiration. Topics in Stroke Rehabilitation 1999, 6(3):1-16.
Logemann J: Evaluation and treatment of swallowing disorders Austin, TX:
Pro Ed; 1997.
Chau T, Chau D, Casas M, Berall G, Kenny D: Investigating the
stationarity of paediatric aspiration signals. IEEE Transactions
on Neural Systems and Rehabilitation Engineering 2005, 13:99-105.
Smith C, Logemann J, Colangelo L, Rademaker A, Pauloski B: Incidence and patient characteristics associated with silent aspiration in the acute care setting. Dysphagia 1999, 14:1-7.
Hansel D, Heinemann D: Improving nursing practice with staff
education: the challenges of dysphagia. Gastroenterology nursing:
the official journal of the Society of Gastroenterology Nurses and Associates
1996, 19(6):201-6.
Finiels H, Strubel D, Jacquot J: Epidemiological aspects. Presse
Medicale 2001, 30(33):1623-1634.
Dray T, Hillel A, Miller R: Dysphagia caused by neurologic deficits. Otolaryngololic Clinics of North America 1998, 31(3):507-524.
Arvedson J, Rogers B, Buck G, Smart P, Small M: Silent aspiration
prominent in children with dysphagia. International Journal of
Pediatric Otorhinolaryngology 1994, 28(2–3):173-181.
Matsuse T, Teramoto S, Matsui H, Ouchi Y, Fukuchi Y: Widespread
occurrence of diffuse aspiration bronchiolitis in patients with
dysphagia irrespective of age. Chest 1998, 114:350-351.
Lazarus B, Murphy J, Culpepper L: Aspiration associated with
long-term gastric versus jejunal feeding – a critical analysis of
the literature. Archives of Physical Medicine and Rehabilitation 1990,
71:46-53.
Wright R, Wright F, Carson C: Videofluoroscopic assessment in
children with severe cerebral palsy presenting with dysphagia. Pediatric Radiology 1996, 26(10):720-722.
Martin-Harris B, Logemann J, McMahon S, Schleicher M, Sandidge J:
Clinical utility of the modified barium swallow. Dysphagia
2000, 15(3):136-141.
Scott A, Perry A, Bench J: A study of the interrrater reliability
when using videofluoroscopy as an assessment of swallowing.
Dysphagia 1998, 13(4):223-227.
Maresh M, Beck T, Gayler B: Radiation in video-recorded fluoroscopy. In Normal and abnormal swallowing: imaging in diagnosis and
therapy 2nd edition. Edited by: Jones B. New York: Springer-Verlag;
2003:1-9.
Brehmer D, Laubert A: The use of fiberoptic endoscopically
controlled methylene blue swallows in the diagnosis of postoperative dysphagia and aspiration. HNO 1999, 47(5):479-484.
Leder S, Sasaki C, Burell M: Fibreoptic endoscopic evaluation of
dysphagia to identify silent aspiration.
Dysphagia 1998,
13:19-21.
Madden C, Fenton J, Hughes J, Timon C: Comparison between
videofluoroscopy and milk-swallow endoscopy in the assessment of swallowing function. Clinical Otolaryngology 2000,
25(6):504-506.
Leder S, Karas D: Fibreoptic endoscopic evaluation of swallowing in the pediatric population.
Laryngoscope 2000,
110(7):1132-1136.
25.
26.
27.
28.
29.
30.
31.
32.
33.
34.
35.
36.
37.
38.
39.
40.
41.
42.
43.
44.
45.
46.
47.
Sherman B, Nisenboum J, Jesberger B, Morrow C, Jesberger J:
Assessment of dysphagia with the use of pulse oximetry. Dysphagia 1999, 14(3):152-156.
Lim S, Lieu P, Phua S: Accuracy of bedside clinical methods
compared with fibreoptic endoscopic examination (FEES) of
swallowing in determining the risk of aspiration in acute
stroke patients. Dysphagia 2001, 16:1-6.
Sellars C, Dunnet C, Carter R: A preliminary comparison of videofluoroscopy of swallow and pulse oximetry in the identification of aspiration in dysphagic patients. Dysphagia 1998,
13(2):82-86.
Leder S: Use of arterial oxygen saturation, heart rate and
blood pressure as indirect objective physiologic markers to
predict aspiration. Dysphagia 2000, 15(4):201-205.
Colodny N: Comparison of dysphagics and nondysphagics on
pulse oximetry during oral feeding.
Dysphagia 2000,
15(2):68-73.
Zenner P, Losinski D, Mills R: Using cervical auscultation in the
clinical dysphagia examination in long-term care. Dysphagia
1995, 10:27-31.
Cichero J, Murdoch B: Acoustic signature of the normal swallow: characterization by age, gender and bolus volume.
Annals of Otology, Rhinology and Laryngology 2002, 111(7):623-632.
Stroud A, Lawrie B, Wiles C: Inter- and intra-rater reliability of
cervical auscultation to detect aspiration in patients with
dysphagia. Clinical Rehabilitation 2002, 16(6):640-645.
Leslie P, Drinnan M, Finn P, Ford G, Wilson J: Reliability and validity of cervical auscultation: a controlled comparison using
videofluoroscopy. Dysphagia 2004, 19(4):231-240.
Reddy N, Katakam A, Gupta V, Unnikrishnan R, Narayanan J, Canilang
E: Measurements of acceleration during videofluorographic
evaluation of dysphagic patients. Medical Engineering & Physics
2000, 22(6):405-412.
Reddy N, Thomas R, Canilang E, Casterline J: Toward classification
of dysphagic patients using biomechanical measurements.
Journal of Rehabilitation Research and Development 1994,
31(4):335-344.
Das A, Reddy N, Narayanan J: Hybrid fuzzy logic committee
neural networks for recognition of swallow acceleration signals.
Computer Methods and Programs in Biomedicine 2001,
64(2):87-99.
Sonies B: Dysphagia: a model for differential diagnosis for
adults and children. In Clinical management of dysphagia in adults
and children Edited by: Cherney L. Gaithersburg: Aspen Publishers;
1994.
Cichero J, Murdoch B: The physiologic cause of swallowing
sounds: answers from heart sounds and vocal tract acoustics.
Dysphagia 1998, 13:39-52.
Bouguerra R, Bouchoucha M, Choufa T: Spectral analysis of swallowing sounds. Gastroenterology 1996, 110(4):A638.
Eke A, Herman P, Kocsis L, Kozak L: Fractal characterization of
complexity in temporal physiological signals. Physiological
Measurement 2002, 23:R1-R38.
Bendat J, Piersol A: Random data: analysis and measurement procedures
3rd edition. New York: John Wiley & Sons; 2000.
Thode H: Testing for normality New York: Marcel Dekker; 2002.
Huber P: Robust statistics Hoboken, New Jersey: John Wiley & Sons;
2003.
Tamura T, Sekine M, Ogawa M, Togawa T, Fukui Y: Classification of
acceleration waveforms during walking by wavelet transform. Methods of Information in Medicine 1997, 36(4–5):356-359.
Marghitu D, Nalluri P: An analysis of greyhound gait using wavelets. Journal of Electromyography and Kinesiology 1997, 7(3):203-212.
Daubechies I: Ten lectures on wavelets Philadelphia: SIAM; 1992.
Sandler R, Mansy H, Kumar V, Cline KF: Computerized analysis of
swallowing sounds (CASS) in normal subjects. Gastroenterology
1997, 112(4):A818.
Bishop C: Neural networks for pattern recognition New York: Oxford
University Press; 1995.
Wilkins M, Morris C, Boddy L: A comparison of radial basis function and backpropagation neural networks for identification
of marine-phytoplankton from multivariate flow-cytometry
data. Computer applications in the biosciences 1994, 10(3):285-294.
Xu L, Kryzak A, Yuille A: On radial basis function nets and kernal regression – statistical consistency, convergence-rates
and receptive field size. Neural Networks 1994, 7(4):609-628.
Page 16 of 17
(page number not for citation purposes)
Journal of NeuroEngineering and Rehabilitation 2006, 3:14
48.
49.
50.
51.
52.
53.
54.
55.
56.
57.
/>
Duda R, Hart P, Stork D: Pattern Classification second edition. New
York: Wiley-Interscience; 2001.
Iftime S, Egsgaard L, Popovic M: Automatic determination of synergies by radial basis function artificial neural networks for
the control of a neural prosthesis. IEEE Transactions on Neural
Systems and Rehabilitation Engineering 2005, 13(4):482-489.
Boquete L, Martin P, Mazo M, Garcia R, Barea R, Rodriguez F, Fernandez I: Hardware implementation of a new neurocontrol
wheelchair-guidance system. Neurocomputing 2002, 47(1–
4):145-160.
Haykin S: Neural Networks: A comprehensive foundation 2nd edition.
Upper Saddle River, NJ: Prentice Hall; 1998.
Tzanis G, Berberidis C, Alexandridou A, Vlahavas I: Improving the
accuracy of classifiers for the prediction of translation initiation sites in genomic sequences. In Advances in Informatics, of Lecture Notes in Computer Science Volume 3746. Springer-Verlag;
2005:426-236.
Tabachnick B, Fidell L: Using multivariate statistics 4th edition. Boston,
USA: Allyn and Bacon; 2001.
Kumar N, Andreou A: Heteroscedastic discriminant analysis
and reduced rank HMMs for improved speech recognition.
Speech Communication 1998, 26(4):283-297.
Huber P: Robust statistics New Jersey: Wiley-Interscience; 1981.
Dasarathy B: Nearest neighbor (NN) norms: nn pattern classification techniques Los Alamitos, California: IEEE Computer Society Press; 1991.
Scott D: Multivariate density estimation New York, New York: John
Wiley; 1992.
Publish with Bio Med Central and every
scientist can read your work free of charge
"BioMed Central will be the most significant development for
disseminating the results of biomedical researc h in our lifetime."
Sir Paul Nurse, Cancer Research UK
Your research papers will be:
available free of charge to the entire biomedical community
peer reviewed and published immediately upon acceptance
cited in PubMed and archived on PubMed Central
yours — you keep the copyright
BioMedcentral
Submit your manuscript here:
/>
Page 17 of 17
(page number not for citation purposes)