Báo cáo khoa học: "A machine learning approach to the automatic evaluation of machine translation" potx
Bạn đang xem bản rút gọn của tài liệu. Xem và tải ngay bản đầy đủ của tài liệu tại đây (86.87 KB, 8 trang )
A machine learning approach
to the automatic evaluation of machine translation
Simon Corston-Oliver, Michael Gamon and Chris Brockett
Microsoft Research
One Microsoft Way
Redmond WA 98052, USA
{simonco, mgamon, chrisbkt}@microsoft.com
Abstract
We present a machine learning
approach to evaluating the well-
formedness of output of a machine
translation system, using classifiers that
learn to distinguish human reference
translations from machine translations.
This approach can be used to evaluate
an MT system, tracking improvements
over time; to aid in the kind of failure
analysis that can help guide system
development; and to select among
alternative output strings. The method
presented is fully automated and
independent of source language, target
language and domain.
1 Introduction
Human evaluation of machine translation (MT)
output is an expensive process, often
prohibitively so when evaluations must be
performed quickly and frequently in order to
measure progress. This paper describes an
approach to automated evaluation designed to
facilitate the identification of areas for
investigation and improvement. It focuses on
evaluating the wellformedness of output and
does not address issues of evaluating content
transfer.
Researchers are now applying automated
evaluation in MT and natural language
generation tasks, both as system-internal
goodness metrics and for the assessment of
output. Langkilde and Knight (1998), for
example, employ n-gram metrics to select
among candidate outputs in natural language
generation, while Ringger et al. (2001) use n-
gram perplexity to compare the output of MT
systems. Su et al. (1992), Alshawi et al. (1998)
and Bangalore et al. (2000) employ string edit
distance between reference and output sentences
to gauge output quality for MT and generation.
To be useful to researchers, however,
assessment must provide linguistic information
that can guide in identifying areas where work is
required. (See Nyberg et al., 1994 for useful
discussion of this issue.)
The better the MT system, the more its
output will resemble human-generated text.
Indeed, MT might be considered a solved
problem should it ever become impossible to
distinguish automated output from human
translation. We have observed that in general
humans can easily and reliably categorize a
sentence as either machine- or human-generated.
Moreover, they can usually justify their
decision. This observation suggests that
evaluation of the wellformedness of output
sentences can be treated as a classification
problem: given a sentence, how accurately can
we predict whether it has been translated by
machine? In this paper we cast the problem of
MT evaluation as a machine learning
classification task that targets both linguistic
features and more abstract features such as n-
gram perplexity.
2 Data
Our corpus consists of 350,000 aligned Spanish-
English sentence pairs taken from published
computer software manuals and online help
documents. We extracted 200,000 English
sentences for building language models to
evaluate per-sentence perplexity. From the
remainder of the corpus, we extracted 100,000
aligned sentence pairs. The Spanish sentences in
this latter sample were then translated by the
Microsoft machine translation system, which
was trained on documents from this domain
(Richardson et al., 2001). This yielded a set of
200,000 English sentences, one half of which
were English reference sentences, and the other
half of which were MT output. (The Spanish
sentences were not used in building or
evaluating the classifiers). We split the 200,000
English sentences 90/10, to yield 180,000
sentences for training classifiers and 20,000
sentences that we used as held-out test data.
Training and test data were evenly divided
between reference English sentences and
Spanish-to-English translations.
3 Features
The selection of features used in our
classification task was motivated by failure
analysis of system output. We were particularly
interested in those linguistic features that could
aid in qualitative analysis, as we discuss in
section 5. For each sentence we automatically
extracted 46 features by performing a syntactic
parse using the Microsoft NLPWin natural
language processing system (Heidorn, 2000) and
language modeling tools. The features extracted
fall into two broad categories:
(i) Perplexity measures were extracted using the
CMU-Cambridge Statistical Language Modeling
Toolkit (Clarkson and Rosenfeld, 1997). We
calculated two sets of values: lexicalized trigram
perplexity, with values discretized into deciles
and part of speech (POS) trigram perplexity. For
the latter we used the following sixteen POS
tags: adjective, adverb, auxiliary, punctuation,
complementizer, coordinating conjunction,
subordinating conjunction, determiner,
interjection, noun, possessor, preposition,
pronoun, quantifier, verb, and other.
(ii) Linguistic features fell into several
subcategories: branching properties of the parse;
function word density, constituent length, and
other miscellaneous features
We employed a selection of features to
provide a detailed assessment of the branching
properties of the parse tree. The linguistic
motivation behind this was twofold. First, it had
become apparent from failure analysis that MT
system output tended to favor right-branching
structures over noun compounding. Second, we
hypothesized that translation from languages
whose branching properties are radically
different from English (e.g. Japanese, or a verb-
second language like German) might pollute the
English output with non-English characteristics.
For this reason, assessment of branching
properties is a good candidate for a language-
pair independent measure. The branching
features we employed are given below. Indices
are scalar counts; other measures are normalized
for sentence length.
¾ number of right-branching nodes across
all constituent types
¾ number of right-branching nodes for
NPs only
¾ number of left-branching nodes across
all constituent types
¾ number of left-branching nodes for NPs
only
¾ number of premodifiers across all
constituent types
¾ number of premodifiers within NPs only
¾ number of postmodifiers across all
constituent types
¾ number of postmodifiers within NPs
only
¾ branching index across all constituent
types, i.e. the number of right-branching
nodes minus number of left-branching
nodes
¾ branching index for NPs only
¾ branching weight index: number of
tokens covered by right-branching
nodes minus number of tokens covered
by left-branching nodes across all
categories
¾ branching weight index for NPs only
¾ modification index, i.e. the number of
premodifiers minus the number of
postmodifiers across all categories
¾ modification index for NPs only
¾ modification weight index: length in
tokens of all premodifiers minus length
in tokens of all postmodifiers across all
categories
¾ modification weight index for NPs only
¾ coordination balance, i.e. the maximal
length difference in coordinated
constituents
We considered the density of function words,
i.e. the ratio of function words to content words,
because of observed problems in WinMT
output. Pronouns received special attention
because of frequent problems detected in failure
analysis. The density features are:
¾ overall function word density
¾ density of determiners/quantifiers
¾ density of pronouns
¾ density of prepositions
¾ density of punctuation marks,
specifically commas and semicolons
¾ density of auxiliary verbs
¾ density of conjunctions
¾ density of different pronoun types: Wh,
1st, 2nd, and 3rd person pronouns
We also measured the following constituent
sizes:
¾ maximal and average NP length
¾ maximal and average AJP length
¾ maximal and average PP length
¾ maximal and average AVP length
¾ sentence length
On a lexical level, the presence of out of
vocabulary (OOV) words is frequently caused
by the direct transfer of source language words
for which no translation could be found. The
top-level syntactic template, i.e. the labels of the
immediate children of the root node of a
sentence, was also used, as was subject-verb
disagreement. The final five features are:
¾ number of OOV words
¾ the presence of a word containing a non-
English letter, i.e. an extended ASCII
character. This is a special case of the
OOV problem.
¾ label of the root node of the sentence
(declarative, imperative, question, NP,
or "FITTED" for non-spanning parses)
¾ sentence template, i.e. the labels of the
immediate children of the root node.
¾ subject-verb disagreement
4 Decision Trees
We used a set of automated tools to construct
decision trees (Chickering et al., 1997) based on
the features extracted from the reference and
MT sentences. To avoid overfitting, we
specified that nodes in the decision tree should
not be split if they accounted for fewer than fifty
cases. In the discussion below we distinguish the
perplexity features from the linguistic features.
4.1 Decision trees built using all
training data
Table 1 gives the accuracy of the decision trees,
when trained on all 180,000 training sentences
and evaluated against the 20,000 held-out test
sentences. Since the training data and test data
containanevensplitbetweenreferencehuman
translations and machine translations, the
baseline for comparison is 50.00%. As Table 1
shows, the decision trees dramatically
outperform this baseline. Using only perplexity
features or only linguistic features yields
accuracy substantially above this baseline.
Combining the two sets of features yields the
highest accuracy, 82.89%.
Features used Accuracy (%)
All features 82.89
Perplexity features only 74.73
Linguistic features only 76.51
Table 1 Accuracy of the decision trees
Notably, most of the annotated features
were selected by the decision tree tools. Two
features were found not to be predictive. The
first non-selected feature is the presence of a
word containing an extended ASCII character,
suggesting that general OOV features were
sufficient and subsume the effect of this
narrower feature. Secondly, subject-verb
disagreement was also not predictive, validating
the consistent enforcement of agreement
constraints in the natural language generation
component of the MT system. In addition, only
eight of approximately 5,200 observed sentence
templates turned out to be discriminatory.
For a different use of perplexity in
classification, see Ringger et al. (2001) who
compare the perplexity of a sentence using a
language model built solely from reference
translations to the perplexity using a language
model built solely from machine translations.
The output of such a classifier could be used as
an input feature in building decision trees.
Effect of training data size
66
67
68
69
70
71
72
73
74
75
76
77
78
79
80
81
82
83
84
0
1
0
,000
20,000
30
,0
00
4
0
,00
0
5
0
,00
0
60,000
70
,0
00
80
,0
00
9
0
,00
0
10
0
,000
110,000
1
20
,0
00
13
0
,00
0
14
0
,00
0
150,000
160
,0
00
1
70
,00
0
18
0
,000
Training cases
Avg best accuracy
All features Pe r p l e x i t y o n l y Linguistic only
Figure 1 Accuracy with varying amounts of training data
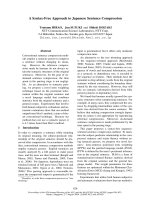
4.2 Varying the amount of training data
For our experiments, we had access to several
hundred thousand sentences from the target
domain. To measure the effect of reducing the
size of the training data set on the accuracy of
the classifier, we built classifiers using samples
of the training data and evaluating against the
same held-out sample of 20,000 sentences. We
randomly extracted ten samples containing the
following numbers of sentences: {1,000, 2,000,
3,000, 4,000, 5,000, 6,000, 12,000, 25,000,
50,000, 100,000, 150,000}. Figure 1 shows the
effect of varying the size of the training data.
The data point graphed is the average accuracy
over the ten samples at a given sample size, with
error bars showing the range from the least
accurate decision tree at that sample size to the
most accurate.
As Figure 1 shows, the models built using
only perplexity features do not benefit from
additional training data. The models built using
linguistic features, however, benefit
substantially, with accuracy leveling off after
150,000 training cases. With only 2,000 training
cases, the classifiers built using all features
range in accuracy from 75.06% to 78.84%,
substantially above the baseline accuracy of
50%.
5 Discussion
As the results in section 4 show, it is possible to
build classifiers that can distinguish human
reference translations from the output of a
machine translation system with high accuracy.
We thus have an automatic mechanism that can
perform the task that humans appear to do with
ease, as noted in section 1. The best result, a
classifier with 82.89% accuracy, is achieved by
combining perplexity calculations with a set of
finer-grained linguistic features. Even with as
few as 2,000 training cases, accuracy exceeded
75%. In the discussion below we consider the
advantages and possible uses of this automatic
evaluation methodology.
5.1 Advantages of the approach
Once an appropriate set of features has been
selected and tools to automatically extract those
features are in place, classifiers can be built and
evaluated quickly. This overcomes the two
problems associated with traditional manual
evaluation of MT systems: manual evaluation is
both costly and time-consuming. Indeed, an
automated approach is essential when dealing
with an MT system that is under constant
development in a collaborative research
environment. The output of such a system may
change from day to day, requiring frequent
feedback to monitor progress.
The methodology does not crucially rely on
any particular set of features. As an MT system
matures, more and more subtle cues might be
necessary to distinguish between human and
machine translations. Any linguistic feature that
can be reliably extracted can be proposed as a
candidate feature to the decision tree tools.
The methodology is also not sensitive to the
domain of the training texts. All that is needed
to build classifiers for a new domain is a
sufficient quantity of aligned translations.
5.2 Possible applications of the
approach
The classifiers can be used for evaluating a
system overall, providing feedback to aid in
system development, and in evaluating
individual sentences.
Evaluating an MT system overall
Evaluating the accuracy of the classifier against
held-out data is equivalent to evaluating the
fluency of the MT system. As the MT system
improves, its output will become more like the
human reference translations. To measure
improvement over time, we would hold the set
of features constant and build and evaluate new
classifiers using the human reference
translations and the output of the MT system at a
given point in time. Using the same set of
features, we expect the accuracy of the
classifiers to go down over time as the MT
output becomes more like human translations.
Feedback to aid system development
Our primary interest in evaluating an MT system
is to identify areas that require improvement.
This has been the motivation for using linguistic
features in addition to perplexity measures.
From the point of view of system development,
perplexity is a rather opaque measure. This can
be viewed as both a strength and a weakness. On
the one hand, it is difficult to tune a system with
the express goal of causing perplexity to
improve, rendering perplexity a particularly
good objective measurement. On the other hand,
given a poor perplexity score, it is not clear how
to improve a system without additional failure
analysis.
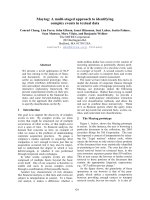
We used the
DNETVIEWER tool (Heckerman
et al., 2000), a visualization tool for viewing
decision trees and Bayesian networks, to explore
the decision trees and identify problem areas in
our MT system. In one visualization, shown in
Figure 2,
DNETVIEWER allows the user to adjust
a slider to see the order in which the features
were selected during the heuristic search that
guides the construction of decision trees. The
most discriminatory features are those which
cause the MT translations to look most awful, or
are characteristics of the reference translations
that ought to be emulated by the MT system. For
the coarse model shown in Figure 2, the distance
between pronouns (nPronDist) is the highest
predictor, followed by the number of second
person pronouns (n2ndPersPron), the number of
function words (nFunctionWords), and the
distance between prepositions (nPrepDist).
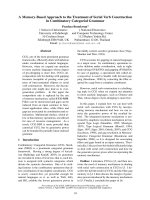
Using
DNETVIEWER we are able to explore
the decision tree, as shown in Figure 3. Viewing
the leaf nodes in the decision tree, we see a
probability distribution over the possible states
of the target variable. In the case of the binary
classifier here, this is the probability that a
sentence will be a reference translation. In
Figure 3, the topmost leaf node shows that
p(Human translation) is low. We modified
DNETVIEWER so that double-clicking on the leaf
node would display reference translations and
MT sentences from the training data. We display
a window showing the path through the decision
tree, the probability that the sentence is a
reference translation given that path, and the
sentences from the training data identified by the
features on the path. This visualization allows
the researcher to view manageable groups of
similar problem sentences with a view to
identifying classes of problems within the
groups. A goal for future research is to select
additional linguistic features that will allow us to
pinpoint problem areas in the MT system and
thereby further automate failure analysis.
Figure 2 Using the slider to view the best predictors
Figure 3 Examining sentences at a leaf node in the decision tree
Figure 4 Examining sentences at a leaf node in the decision tree
Decision trees are merely one form of
classifier that could be used for the automated
evaluation of an MT system. In preliminary
experiments, the accuracy of classifiers using
support vector machines (SVMs) (Vapnik, 1998;
Platt et al., 2000) exceeded the accuracy of the
decision tree classifiers by a little less than one
percentage point using a linear kernel function,
and by a slightly greater margin using a
polynomial kernel function of degree three. We
prefer the decision tree classifiers because they
allow a researcher to explore the classification
system and focus on problem areas and
sentences. We find this method for exploring the
data more intuitive than attempting to visualize
the location of sentences in the high-
dimensional space of the corresponding SVM.
Evaluating individual sentences
In addition to system evaluation and failure
analysis, classifiers could be used on a per-
sentence basis to guide the output of an MT
system by selecting among multiple candidate
strings. If no candidate is judged sufficiently
similar to a human reference translation, the
sentence could be flagged for human post-
editing.
6 Conclusion
We have presented a method for evaluating the
fluency of MT, using classifiers based on
linguistic features to emulate the human ability
to distinguish MT from human translation. The
techniques we have described are system- and
language-independent. Possible applications of
our approach include system evaluation, failure
analysis to guide system development, and
selection among alternative possible outputs.
We have focused on structural aspects of a
text that can be used to evaluate fluency. A full
evaluation of MT quality would of course need
to include measurements of idiomaticity and
techniques to verify that the semantic and
pragmatic content of the source language had
been successfully transferred to the target
language.
Acknowledgements
Our thanks go to Eric Ringger and Max
Chickering for programming assistance with the
tools used in building and evaluating the
decision trees, and to Mike Carlson for help in
sampling the initial datasets. Thanks also to
John Platt for helpful discussion on parameter
setting for the SVM tools, and to the members
of the MSR NLP group for feedback on the uses
of the methodology presented here.
References
Alshawi, H., S. Bangalore, and S. Douglas. 1998.
Automatic acquisition of hierarchical transduction
models for machine translation. In Proceedings of
the 36
th
Annual Meeting of the Association for
Computational Linguistics, Montreal Canada, Vol.
I: 41-47.
Bangalore, S., O. Rambow, and S. Whittaker. 2000.
Evaluation Metrics for Generation. In Proceedings
of the International Conference on Natural
Language Generation (INLG 2000), Mitzpe
Ramon, Israel. 1-13.
Chickering, D. M., D. Heckerman, and C. Meek.
1997. A Bayesian approach to learning Bayesian
networks with local structure. In Geiger, D. and P.
Punadlik Shenoy (Eds.), Uncertainty in Artificial
Intelligence: Proceedings of the Thirteenth
Conference. 80-89.
Clarkson, P. and R. Rosenfeld. 1997. Statistical
Language Modeling Using the CMU-Cambridge
Toolkit. Proceedings of Eurospeech97. 2707-
2710.
Heckerman, D., D. M. Chickering, C. Meek, R.
Rounthwaite, and C. Kadie. 2000. Dependency
networks for inference, collaborative filtering and
data visualization. Journal of Machine Learning
Research 1:49-75.
Heidorn, G. E., 2000. Intelligent writing assistance.
InR.Dale,H.MoislandH.Somers(Eds.).
Handbook of Natural Language Processing.New
York, NY. Marcel Dekker. 181-207.
Langkilde, I., and K. Knight. 1998. Generation that
exploits corpus-based statistical knowledge. In
Proceedings of the 36
th
Annual Meeting of the
Association for Computational Linguistics, and
17
th
International Conference on Computational
Linguistics, Montreal, Canada. 704-710.
Nyberg, E. H., T. Mitamura, and J. G. Carbonnell.
1994. Evaluation Metrics for Knowledge-Based
Machine Translation. In Proceedings of the 15
th
International Conference on Computational
Linguistics, Kyoto, Japan (Coling 94). 95-99.
Platt,J.,N.Cristianini,J.Shawe-Taylor.2000.Large
margin DAGs for multiclass classification. In
Advances in Neural Information Processing
Systems 12, MIT Press. 547-553.
Richardson, S., B. Dolan, A. Menezes, and J.
Pinkham. 2001. Achieving commercial-quality
translation with example-based methods.
Submitted for review.
Ringger, E., M. Corston-Oliver, and R. Moore. 2001.
Using Word-Perplexity for Automatic Evaluation
of Machine Translation. Manuscript.
Su, K., M. Wu, and J. Chang. 1992. A new
quantitative quality measure for machine
translation systems. In Proceedings of COLING-
92, Nantes, France. 433-439.
Vapnik, V. 1998. Statistical Learning Theory, Wiley-
Interscience, New York.