báo cáo hóa học: " Relationship between oxygen supply and cerebral blood flow assessed by transcranial Doppler and near – infrared spectroscopy in healthy subjects during breath – holding" doc
Bạn đang xem bản rút gọn của tài liệu. Xem và tải ngay bản đầy đủ của tài liệu tại đây (375.39 KB, 13 trang )
BioMed Central
Page 1 of 13
(page number not for citation purposes)
Journal of NeuroEngineering and
Rehabilitation
Open Access
Methodology
Relationship between oxygen supply and cerebral blood flow
assessed by transcranial Doppler and near – infrared spectroscopy
in healthy subjects during breath – holding
Filippo Molinari*
1
, William Liboni
2
, Gianfranco Grippi
2
and
Emanuela Negri
2
Address:
1
Biolab, Dipartimento di Elettronica, Politecnico di Torino, Torino, Italy and
2
S.C. Neurologia, Presidio Sanitario Gradenigo, Torino, Italy
Email: Filippo Molinari* - ; William Liboni - ;
Gianfranco Grippi - ; Emanuela Negri -
* Corresponding author
Abstract
Background: Breath – holding (BH) is a suitable method for inducing cerebral vasomotor
reactivity (VMR). The assessment of VMR is of clinical importance for the early detection of risk
conditions and for the follow-up of disabled patients. Transcranial Doppler ultrasonography (TCD)
is used to measure cerebral blood flow velocity (CBFV) during BH, whereas near-infrared
spectroscopy (NIRS) measures the concentrations of the oxygenated (O
2
Hb) and reduced (CO
2
Hb)
hemoglobin. The two techniques provide circulatory and functional-related parameters. The aim of
the study is the analysis of the relationship between oxygen supply and CBFV as detected by TCD
and NIRS in healthy subjects performing BH.
Methods: 20 healthy subjects (15 males and 5 females, age 33 ± 4.5 years) underwent TCD and
NIRS examination during voluntary breath – holding. VMR was quantified by means of the breath-
holding index (BHI). We evaluated the BHI based on mean CBFV, O
2
Hb and CO
2
Hb concentrations,
relating the baseline to post-stimulus values. To quantify VMR we also computed the slope of the
linear regression line of the concentration signals during BH. From the NIRS signals we also derived
the bidimensional representation of VMR, plotting the instantaneous O
2
Hb concentration vs the
CO
2
Hb concentration during the BH phase. Two subjects, a 30 years old current smoker female
and a 63 years old male with a ischemic stroke event at the left middle cerebral artery, were tested
as case studies.
Results: The BHI for the CBFV was equal to 1.28 ± 0.71 %/s, the BHI for the O
2
Hb to 0.055 ±
0.037
µ
mol/l/s and the BHI for CO
2
Hb to 0.0006 ± 0.0019
µ
mol/l/s, the O
2
Hb slope was equal to
0.15 ± 0.09
µ
mol/l/s and the CO
2
Hb slope to 0.09 ± 0.04
µ
mol/l/s. There was a positive correlation
between the CBFV and the O
2
Hb increments during BH (r = 0.865). The bidimensional VMR pattern
shows common features among healthy subjects that are lost in the control studies.
Conclusion: We show that healthy subjects present a common VMR pattern when counteracting
cerebral blood flow perturbations induced by voluntary BH. The proposed methodology allows for
the monitoring of changes in the VMR pattern, hence it could be used for assessing the efficacy of
neurorehabilitation protocols.
Published: 19 July 2006
Journal of NeuroEngineering and Rehabilitation 2006, 3:16 doi:10.1186/1743-0003-3-16
Received: 20 July 2005
Accepted: 19 July 2006
This article is available from: />© 2006 Molinari et al; licensee BioMed Central Ltd.
This is an Open Access article distributed under the terms of the Creative Commons Attribution License ( />),
which permits unrestricted use, distribution, and reproduction in any medium, provided the original work is properly cited.
Journal of NeuroEngineering and Rehabilitation 2006, 3:16 />Page 2 of 13
(page number not for citation purposes)
Background
Unlike the other organs, human brain needs a constant
oxygen supply in order to maintain its functional and
structural integrity. The local amount of oxygen stored in
the brain tissues is small compared to the metabolic
needs, hence a specific mechanism is necessary in order to
ensure the correct oxygenation levels. This mechanism has
to provide oxygen during both resting condition and focal
cortical activity. The strict coupling existing between "acti-
vation", local oxygen consumption, and increased
regional cerebral blood flow constitutes the basis of the so
called BOLD effect (Blood Oxygenation Level Dependent)
and, hence, of the functional magnetic resonance [1].
Thus, the assessment of cerebral hemodynamics is of par-
amount importance for determining the response of a
subject to an external stimulus or for quantifying cortical
activation.
Among the methods allowing a non – invasive and low –
cost assessment of cerebral hemodynamics, transcranial
Doppler ultrasonography (TCD) plays a fundamental role
[2,3]. By means of TCD it is possible to measure the cere-
bral arteries blood flow velocity (CBFV) and, hence, ana-
lyze the variation of the CBF. However, the limited spatial
resolution of this technique allows for the quantification
of CBFV only in the macro – vessels (essentially the arter-
ies constituting the Willis circle plus the middle cerebral
arteries), whereas a cortical localized modification of
blood velocity is impossible to track. Moreover, in about
25% of the patients, it is impossible to perform a TCD
examination due to poor skull acoustic windows.
By means of near – infrared spectroscopy (NIRS) it is pos-
sible to continuously monitor the local concentrations of
oxygenated (O
2
Hb) and reduced (CO
2
Hb) in the adult
brain. TCD provides a direct measurement of circulatory
parameters, whereas NIRS provides more functional and
activation-dependent informations. Specifically, it has
been demonstrated that NIRS can proficiently measure
cerebrovascular reactivity [4].
In clinical practice, cerebral autoregulation is usually
assessed during a CO
2
reactivity test [5]. It is known that
baroreceptors react to an increased partial pressure of CO
2
by inducing vasodilatation in the resistance vessels; hence,
the mean CBFV increases and the resistance of the vessels
drops [6]. This mechanism is often indicated as vasomo-
tor reactivity (VMR). CO
2
reactivity can be induced by
means of acetazolamide injection, by means of direct
CO
2
inhalation (usually at the 5% – 7% concentration), or
by means of simple breath – holding (BH).
In the last five years, a great variety of studies combining
TCD and/or NIRS have been devoted to the assessment of
VMR in subjects affected by acute and chronic patholo-
gies: microangiopathy [7], migraine [8], carotid artery
occlusion [9] and depression [10]. Recently, NIRS has
been also used for the cerebral activity quantification dur-
ing motion tasks [11]. From a rehabilitation point of view,
NIRS proved successful in monitoring motor reorganiza-
tion in hemiparetic stroke patients [12].
Traditionally, in response to a CO
2
test, VMR is quantified
by relating baseline values (these values can be the mean
CBFV as well as the concentrations of O
2
Hb and CO
2
Hb)
to post – stimulus values [9]; while the stimulus phase is
not taken into consideration. Since VMR determines a
continuous modification of such values during time,
omitting the analysis of the stimulus phase may lead to
uncertainties and poor comprehension of the VMR itself.
The aim of the study is the analysis of the relationship
between oxygen supply and CBFV as detected by TCD and
NIRS in healthy subjects performing BH. We studied a
population consisting of 20 healthy volunteers and we
showed the vasoreactivity patterns the subjects had during
BH. We introduced a bidimensional representation of
VMR based on the O
2
Hb and CO
2
Hb concentration
changes that we consider useful to gain a better compre-
hension of VMR. Finally, we showed that this methodol-
ogy could be used for assessing a subject's VMR condition,
comparing the data of two case studies to those of the nor-
mal population.
Methods
Subjects
Currently, we enrolled in this study 20 (15 males and 5
females) healthy non-smokers volunteers (age, mean ± sd
= 33 ± 4.5 years). Before being included in this study, all
the subjects underwent clinical examinations intended to
exclude cerebral, cardiac, and circulatory diseases. Accord-
ing to the rules of the local Hospital in which the tests
were hold, the subjects were asked to sign an informed
consent.
Case studies
We also tested several healthy current smokers subjects
and some pathologic subjects. Due to the great variability
of our sample population of smokers and pathologic sub-
jects, we decided to present in this paper only two case
reports which we found indicative of their category. The
first subject was a healthy current smoker 30 years old
female. She had been smoking for 12 years and she
smoked an average of 15 cigarettes/day. The subject (indi-
cated as subject A in the following) underwent the same
clinical examinations of the normal controls and did not
show any sign of cerebral, cardiac, and circulatory dis-
eases. The second subject was a post-stroke, 63 years old,
man. He had suffered from a ischemic stroke to the left
middle cerebral artery (MCA) about 2 years before being
Journal of NeuroEngineering and Rehabilitation 2006, 3:16 />Page 3 of 13
(page number not for citation purposes)
enrolled in the study, when he was tested for the first time.
He showed aphasia, motor impairment, and poor scores
in fluency and verbal tests. After a year of drug therapy
(antihypertensive and antiaggregating agents) and logo-
pedic therapy, this subject was tested for the second time.
He reported an improvement in motor control and reach-
ing tasks, and increased his AAT (Aachener Aphasie Test)
score from 52/60 to 56/60.
Measurement protocol
We applied TCD and NIRS during baseline conditions
and during CO
2
reactivity. To trigger CO
2
reactivity, we
chose the voluntary breath – holding technique. A major
advantage of this choice is simplicity, since, to induce
hypercapnia, there is no need for further devices (i.e. a
capnograph with a breathing mask). This technique, how-
ever, is subject dependent: it is impossible, in experimen-
tal conditions, to establish a BH duration equal for all the
subjects. To cope with this difficulty, we preliminary
instructed the subjects on how to perform the BH and we
let them test the procedure once before starting the record-
ings. In particular, we instructed the subjects to hold the
breath after a normal breathing, in order to avoid an
increase of the thoracic pressure, and we controlled they
could hold the breath for a minimum time of 20 s.
According to previously published experimental proto-
cols, we instructed the subjects to end breath – holding
when they felt comfortable [13].
The experimental protocol was the following:
• to derive baseline conditions, the subjects were allowed
to rest for about 10 minutes in a dimmed and quiet room,
laying comfortably in a supine position with eyes closed
and breathing room air;
• when we observed stable signals (i.e. when the concen-
trations of O
2
Hb and CO
2
Hb and the CBFV did not show
remarkable variations from their mean values), the sub-
jects were instructed to perform a breath – holding after a
normal inspiration;
• at the end of the apnea, the subjects were asked to rest
for 5 minutes and we collected signals related to the post
– stimulus conditions.
TCD recordings
We recorded the CBFV in both the middle cerebral arteries
simultaneously by means of a commercially available
transcranial Doppler device (Multidop X4, DWL, Ger-
many) equipped with 2 MHz probes. The transducers
were positioned in order to insonate the MCAs in their Ml
tract by the temporal bone windows. Probes positioning
and the obtained Doppler sounds were confirmed on the
basis of currently adopted clinical standards [14]. As an
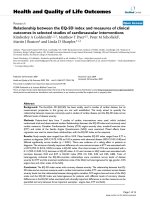
example, figure 1 depicts the modifications of the left
MCA CBFV of a healthy subject performing BH. The figure
reports the envelopes of the Doppler spectrum in function
of time. It can be noticed how CBFV progressively and
almost linearly increases while BH is maintained and then
quickly recovers baseline conditions after breath release.
NIRS recordings
Changes in the concentrations of O
2
Hb and CO
2
Hb were
measured by means of a near – infrared spectroscopy
device (NIRO 300, Hammamatsu Photonics, Australia).
The emitting probe of the NIRS equipment was placed on
the left frontal side of the subjects, 2 cm beside the mid-
line and about 3 cm above the supraorbital ridge. We
chose this positioning in order to avoid the sinuses and to
place the probes on a poorly perfused and very thin skin
layer. BH is supposed to induce a perturbation in cerebral
cortex that is systemic and not regional or localized, hence
the frontal lobe was a suitable location also for the
absence of hairs. The receiving sensor was fixed laterally to
the emitter at a distance of about 5 cm. According to pre-
vious studies and theoretical models already developed
[15], we set a differential pathlength factor equal to 5.97.
Previous works [15,16] demonstrated that with a source –
detector distance equal to approximately 5 cm the NIRS
equipment is capable of detecting effectively the chromo-
phores concentration changes on the surface of the cere-
bral cortex.
CBFV modifications during BH of a healthy subjectFigure 1
CBFV modifications during BH of a healthy subject.
Time course of the CBFV during BH: the figure reports the
entire Doppler spectra envelopes in function of time. The
increase of CBFV is almost linear in function of the BH dura-
tion. After breath release, CBFV returns to baseline condi-
tions quickly.
40
60
80
100
120
140
160
180
BH onset
BH offset
20 stime
CBFV (cm/s)
Journal of NeuroEngineering and Rehabilitation 2006, 3:16 />Page 4 of 13
(page number not for citation purposes)
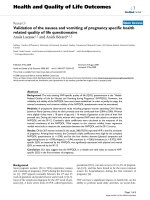
Chromophores concentration changes were acquired con-
tinuously at a sampling rate equal to 2 Hz. To avoid bias
from environmental light, a black cloth covered the NIRS
probe. As an example, figure 2 reports the time course of
the two types of hemoglobin during BH.
During the test, we also monitored the end-tidal CO
2
and
the mean arterial blood pressure by means of a specific
monitor equipped with a capnographic module.
Vasoreactivity quantification
According to previous studies [8], we used the breath –
holding index (BHI) to quantify vascular reactivity. This
index can be defined for any quantity related to the cere-
bral circulation, since it simply relates post – stimulus
quantities to pre-stimulus quantities.
From the TCD data, we derived a BHI based on the mean
blood flow velocity (MV). MV can approximately be
defined as [17]:
where:
• PV is the peak systolic blood flow velocity;
• EDV is the end – diastolic blood flow velocity.
Figure 3 sketches the meaning of the PV, EDV, and MV in
relation to the envelope of the CBFV during two cardiac
cycles.
The BHI derived from the MV (which is indicated as BHI
V
in the following) was then defined according to the fol-
lowing expression:
where:
• V
BASE
represents the MV averaged on a 10s time window
when in baseline conditions;
• V
BH
represents the MV averaged on a 10s time window
after the offset of the apnea;
• D
BH
is the time duration of the BH.
This index is expressed in %/s.
From the TCD data, we also calculated the Gosling's pul-
satility index (PI) of the MCA in baseline conditions and
in correspondence of the maximum CBFV increase during
the apnea. The PI is defined according to the following
expression:
This parameter indicates how the ratio between the
extreme velocities in the artery modifies as consequence
of vasoreactivity and it is often used in VMR studies as a
complement to the BHI [2]. To quantify VMR from the
NIRS data, we estimated the chromophores concentration
changes with respect to the BH duration [7]:
As in equation 2, O
2
Hb
BASE
is the oxygenated hemoglobin
concentration in baseline conditions, averaged on the
same 10s time window during which the V
BASE
is evalu-
ated, and O
2
Hb
BH
is the average concentration after the
release of the BH. We calculated the same index also for
the CO
2
Hb ().
MV
PV EDV
=
+
()
2
3
1
BHI
VV
VD
V
BH BASE
BASE BH
=
−
⋅
⋅
()
||
100
2
PI
PV EDV
MV
=
−
()
3
BHI
OHb OHb
D
O
BH BASE
BH
2
22
4
=
−
()
BHI
CO
2
O
2
Hb and CO
2
Hb concentration changes during BH of a healthy subjectFigure 2
O
2
Hb and CO
2
Hb concentration changes during BH
of a healthy subject. Time course of the O
2
Hb (blue line)
and CO
2
Hb (red line) concentration signals during BH. The
graph is relative to a healthy subject. Values are scaled in
order to set the initial (i.e., at the BH onset) concentration
equal to zero. 1) Initial phase with concentration similar to
the baseline values; 2) onset of vasoreactivity with strong
O
2
Hb increase; 3) end of the vasoreactivity and plateau
region for the O
2
Hb concentration, with increasing CO
2
Hb
concentration.
-1
0
1
2
3
4
5
20 stime
cromophore concentration (µmol/l)
O
2
Hb
CO
2
Hb
1
2
3
BH onset
BH offset
Journal of NeuroEngineering and Rehabilitation 2006, 3:16 />Page 5 of 13
(page number not for citation purposes)
These reactivity indexes are expressed in
µ
mol/l/s.
Beside the BHI, for each subject we also computed the
slope of the O
2
Hb and CO
2
Hb concentration signals. Spe-
cifically, we evaluated the angular coefficient of the linear
regression line traced from the minimum to the maxi-
mum concentration values on the chromophore concen-
trations time course during BH. Figure 4 depicts the
regression line and the slope evaluation procedures for
the O
2
Hb signal of a subject performing BH.
The mean variations of the O
2
Hb and of the CO
2
Hb were
computed by first normalizing each BH duration and then
averaging the chromophores concentrations on our sam-
ple population. The population averaged time course of
the two NIRS signals are reported by figure 5.
VMR bidimensional representation
To obtain the VMR bidimensional pattern during BH, we
lowpass filtered the O
2
Hb and CO
2
Hb concentration sig-
nals (15 order Chebyshev digital filter, with ripple in the
stop band, cutoff frequency equal to 50 mHz and at least
30 dB of discrimination) and set the initial concentrations
equal to zero. The O
2
Hb and CO
2
Hb concentration signals
were then normalized with respect to their maximum
value during the BH phase. Then, in a bidimensional
plane, for each time instant, we plotted the O
2
Hb vs the
CO
2
Hb concentration. Lowpass filtering was introduced
to obtain smooth profiles in the bidimensional represen-
tation; the zero setting of the initial conditions ensured
that all the bidimensional patterns started form the graph
origin, hence were direclty comparable. The resulting bidi-
mensional plot are reported by figure 6.
Results and discussion
Carbon dioxide reactivity triggered by breath – holding
As already pointed out, the three major techniques
adopted for triggering CO
2
reactivity are: hypercapnia,
acetazolamide injection, and breath – holding [5]. We
decided to carry on this study using BH as reactivity trig-
ger, since we planned to develop an experimental proto-
col that could be suitable for any subject, including
patients suffering from cerebrovascular, neurological, and
chronic diseases.
Breath – holding is obviously subject dependent; while
this poses the problem of dealing with different BH dura-
tions, we believe this technique is suitable for assessing
VMR as response to a sudden and abrupt change in the
oxygenation levels, which is a major risk condition for cer-
ebral autoregulation.
VMR quantification
The population averaged BH duration was 41.7s ± 8.3s
(95% confidence interval ranging from 38.1s to 45.4s).
Table 1 reports the BHI
V
and the PI values derived from
TCD measurements of the CBFV. The average increase in
the CBFV was equal to 1.28 %/s ± 0.71 %/s, whereas the
PI decrease from an initial average value equal to 0.86 to
Evaluation of the slope of the chromophore concentration changesFigure 4
Evaluation of the slope of the chromophore concen-
tration changes. Sketch of the slope computation for the
O
2
Hb concentration signal of a healthy subject during BH:
from the minimum and the maximum point of the concentra-
tion during BH, the angular coefficient of the linear regres-
sion line is computed. This slope is taken as index of VMR.
-1
0
1
2
3
4
time
cromophore concentration (µmol/l)
20 s
maximum
minimum
slope = 0.972 µmol/l / s
Representation of the peak systolic, end diastolic and mean CBFVsFigure 3
Representation of the peak systolic, end diastolic and
mean CBFVs. Envelope of two waves of CBFV derived by a
TCD scan of the left MCA of a healthy subject. The figure
reports the indications of the peak systolic velocity value
(PV), of the end diastolic value (EDV), and of the mean veloc-
ity value (MV) that are used for the calculation of BHI
V
and of
the pulsatility index.
50
70
90
110
130
CBFV (cm/s)
400 ms
time
PV
EDV
MV
Journal of NeuroEngineering and Rehabilitation 2006, 3:16 />Page 6 of 13
(page number not for citation purposes)
a post-apnea value of 0.66. These results are in line with
previously reported studies concerning the use of TCD for
the quantification of VMR [17]. From a methodological
point of view, the neat decrement of the PI confirms that
the experimental protocol was suitable for triggering vas-
omotor reactivity: during BH, the EDV increase was
greater than the PV increase, hence PI diminished. Usu-
ally, the decrement of the PI is used to confirm the drop
in the periferal vessel resistance, hence to ensure a correct
onset of VMR.
Table 2 summarizes the VMR indexes derived from the
NIRS data. The first and second rows of Table 2 report the
and the mean values for our testing pop-
ulation. The second column of the table reports the first
species probability error in testing the corresponding
value against zero (Student's t – test,
α
= 0.05), being zero
the condition of no reactivity. We found that during vol-
untary BH, the subjects showed a significant increase in
the O
2
Hb concentration level, whereas the variation of the
CO
2
Hb was not statistically significant. The third and
fourth rows of Table 2 report the average slopes of the
O
2
Hb and of the CO
2
Hb concentration signals, computed
as described in the materials section. Both the concentra-
tion signals were characterized by positive angular coeffi-
cients, but the slope of the O
2
Hb signal was greater than
that of the CO
2
Hb (0.15/0.09 vs. 0.09/0.04, mean/sd).
We believe that the quantification of VMR by means of the
BHIs derived by NIRS signals could be questioned.
According to literature, vasomotor reactivity is quantified
as the variation of a given physiological parameter as con-
sequence of an external stimulus (usually a CO
2
increase).
As a matter of fact, however, the above defined indices
only depends on the baseline and on the post-BH condi-
tions, but what happens during the BH phase is not taken
into consideration.
Mean CBFV increases during CO
2
reactivity tests as conse-
quence of a pial arteries vasodilation, but then it remains
almost constant for periods lasting several seconds [2].
Hence, the quantification of vasomotor reactivity based
on pre-apnea and post-apnea values is appropriate. Con-
versely, as our experimental results clearly show, the local
concentration of oxygenated hemoglobin measured by
BHI
O
2
BHI
CO
2
Table 1: BHI and PI indexes derived from TCD signals.
Population averaged values of the BHI and of the PIs derived
from the TCD measurements. The first row depicts the
percentage increment of the CBFV (BHI
V
), whereas the second
and third rows depict the PI during baseline and after BH
respectively. All the values are expressed as mean/sd.
Mean/sd
BHI
V
(%/s) 1.28/0.71
PI baseline 0.86/0.13
PI BH 0.66/0.12
Average O
2
Hb and CO
2
Hb concentration changes during BHFigure 5
Average O
2
Hb and CO
2
Hb concentration changes during BH. O
2
Hb (left graph) and CO
2
Hb (right graph) concentra-
tions during BH for the sample population. The superimposed vertical bars represent the standard error. The average graphs
were obtained by normalizing the BH phase of each subject.
0 20406080100
-2
-1
0
1
2
0 20406080100
BH duration (%) BH duration (%)
concentration (µmol/l)
O
2
Hb CO
2
Hb
Journal of NeuroEngineering and Rehabilitation 2006, 3:16 />Page 7 of 13
(page number not for citation purposes)
NIRS is a more rapidly evolving quantity, since it depends
on the CBFV, on the perfusion pressure, on the degree of
artery dilation and on the tissues oxygen extraction rate.
Moreover, vasoreactivity is triggered by a CO
2
increase, but
the quantification of VMR itself is usually done by taking
into account the increases in both oxygenated and
reduced hemoglobin; this because VMR is a functional
physiological process aiming at maintaining a proper
chromophores concentration in brain tissues. Hence, we
believe that for a proper interpretation and evaluation of
the VMR during BH it is necessary to observe the reactivity
pattern during the apnea phase. We propose to measure
the slopes of the O
2
Hb and of the CO
2
Hb concentration
signals and to use them for quantifying VMR during vol-
untary breath-holding. This quantity, in fact, is strictly
related to the time course of the hemoglobin concentra-
tion signal. This index is also implicitly normalized with
respect to the BH duration; this enables direct a compari-
son of the results among different subjects.
Our results also revealed a good correlation between the
BHI
V
and the slopes of the O
2
Hb and of the CO
2
Hb con-
centration signals: figure 7 reports the scatter diagrams of
the BHI
V
and of the slopes (O
2
Hb on the left panel and
CO
2
Hb on the right panel) for our sample population.
The black line represents the linear regression of the data.
The Pearson's correlation coefficients were found equal to
0.865 (BHI
V
vs slope of the O
2
Hb signal; P < 3·10
-7
,
α
=
0.05) and 0.603 (BHI
V
vs slope of the CO
2
Hb signal; P <
4·10
-3
,
α
= 0.05). The figure also depicts the 95% confi-
dence intervals for the estimated correlation coefficients.
The and did not show any correlation
with BHI
V
. The variation of the O
2
Hb concentration,
which is greater than that of CO
2
Hb, has a greater correla-
tion with the increase in CBFV; this is not surprising since
O
2
Hb concentration is predominant in the cerebral cortex.
Approximating the increase of the regional cerebral blood
volume with the O
2
Hb concentration increase, in healthy
subjects performing our experimental protocol, an
increase in CBFV is almost linearly correlated with the
increase of the local cerebral blood volume.
NIRS vasoreactivity patterns
As pointed out above, the BHI is a measure of VMR that
relates the baseline to the post-stimulus values. Cerebral
concentrations of O
2
Hb and CO
2
Hb, however, strongly
vary during BH as consequence of vasodilation and of the
local oxygen demand; thus, a more complete evaluation
of VMR should be made by taking into account what hap-
pens during the BH phase.
Figure 2 reports an example of the changes occurring in
the O
2
Hb (red line) and CO
2
Hb (blue line) concentrations
during BH of a single healthy subject. Three main features
BHI
O
2
BHI
CO
2
Table 2: BHIs derived from NIRS signals. Population averaged
values of the BHI and of the slope of the O
2
Hb and CO
2
Hb
concentration signals derived from the NIRS data (all the values
are expressed in
µ
mol/l/s). The first and the second rows report
the BHIs derived from the concentration changes of oxygenated
and reduced hemoglobin, the third and fourth rows report the
slopes of the time course of the concentration signals during the
BH phase (all the values are expressed as mean/sd). The second
column reports the first species probability error of a Student's t
– test to test the BHI and the slope values against zero (i.e.
against no modification induced by the BH) with a confidence
level equal to 95%.
Mean/sd P value
0.055/0.037 4·10
-6
0.0006/0.0019 >0.05
0.15/0.09 < 7·10
-7
0.09/0.04 < 5·10
-10
BHI
O
2
BHI
CO
2
slope
O
2
slope
CO
2
Bidimensional VMR representation derived by NIRS signalsFigure 6
Bidimensional VMR representation derived by NIRS
signals. Bidimensional VMR patterns as assessed by NIRS
signals for the sample population. Each red circle represents
the instantaneous concentration of CO
2
Hb (horizontal axis)
and O
2
Hb (vertical axis). The concentration values are nor-
malized with respect to their maximum value during the BH
phase. The dotted lines depict the first and third quadrants
bisectors. The reactivity pattern is always comprised into the
region delimited by the two bisectors, evidencing a greater
increase in the O
2
Hb level with respect to the CO
2
Hb con-
centration level.
-1 -0.5 0.5 1
-0.5
0.5
1
CO
2
Hb (a.u.)
O
2
Hb (a.u.)
Journal of NeuroEngineering and Rehabilitation 2006, 3:16 />Page 8 of 13
(page number not for citation purposes)
can be observed on the time course of the two concentra-
tions:
1. an initial phase, similar to the the baseline, in which the
two chromophores concentrations do not significantly
change;
2. the VMR phase, in which there is a strong increase of the
O
2
Hb (and, hence, of the total hemoglobin, that roughly
corresponds to the regional cerebral blood volume) while
the CO
2
Hb is kept at a baseline level;
3. a plateau phase when the vasodilation has already
reached its maximum, characterized by an almost con-
stant level of O
2
Hb and a progressive increase of the
CO
2
Hb level.
At the end of the BH, a recovery phase takes the concen-
tration signals to baseline values. Despite the great varia-
bility affecting the NIRS signals, we found these common
features in all the subjects we tested, provided that the BH
duration was at least of 20 seconds. Figure 5 reports the
population averaged O
2
Hb (left diagram) and CO
2
Hb
(right diagram) concentration signals during BH. In order
to make the signals comparable, we normalized the BH
duration of each subject and set the initial concentrations
(i.e., at the BH onset) equal to zero. The superimposed
vertical bars represent the instantaneous standard error.
Starting from 20% of the BH duration, the O
2
Hb signal
depicts an increase in the variability that is due to the fact
that, by that time, VMR had its onset. The linear increase
of the O
2
Hb continues until 80% of the BH duration, then
variability reduces and a region of plateau can be
observed. Conversely, the CO
2
Hb shows a more variable
behavior, but its average concentration remains at base-
line values almost until the 90% the BH, when an
increase, which cannot be further compensated, deter-
mines the end of the BH.
Bidimensional VMR representation
Vasoreactivity is a physiological mechanism that ensures
the correct brain oxygenation both in baseline conditions
and dynamically in consequence of perturbations to the
blood oxygenation level. Specifically, during hypoxaemia,
the decrease of the arterial partial pressure of oxygen, and
the consequent increase of the arterial partial pressure of
carbon dioxide, triggers VMR. The mechanisms that deter-
mine the onset of vasoreactivity are still debated [18].
If TCD is useful to document the increased CBFV as a
physiological response to an increased oxygen demand by
the brain tissue and to estimate the drop of the pial arter-
ies resistance, NIRS could be proficiently used to monitor
VMR in relation to the local amount of oxygen consump-
Correlation between BHI
V
and slopes of the hemoglobin signalsFigure 7
Correlation between BHI
V
and slopes of the hemoglobin signals. Scatter diagram of the BHI
V
and of the (left
graph) and (right graph) values for the 20 subjects. The increment of the CBFV shows a good correlation with the
increment of the O
2
Hb, which can be taken, in this experimental protocol, as an estimate of the increment of the cerebral
blood volume.
00.511.522.53
0
0.1
0.2
0.3
0.4
BHI
V
(% / s)
O
2
slope (µmol/l / s)
0 0.5 1 1.5 2 2.5 3
CO
2
slope (µmol/l / s)
r = 0.865
C.I. [0.685; 0.945]
r = 0.603
C.I. [0.219; 0.825]
slope
O
2
slope
CO
2
Journal of NeuroEngineering and Rehabilitation 2006, 3:16 />Page 9 of 13
(page number not for citation purposes)
tion and extraction. To this purpose, we propose to
observe the VMR pattern in a two-dimensional plane,
where it is possible to monitor the instantaneous balanc-
ing of the two types of hemoglobin and to determine how
autoregulation varies the concentration of the two
chromophores.
Figure 6 reports the bidimensional BH patterns as
assessed by means of the NIRS signals. The horizontal axis
reports the instantaneous concentration of CO
2
Hb (nor-
malized with respect to its maximum value during BH),
whereas the vertical axis reports the O
2
Hb one (normal-
ized with respect to its maximum value during BH). The
dotted lines represent the first and third quadrant bisec-
tors: when the VMR pattern is in the region comprised
between the two bisectors, it means that the oxygenated
hemoglobin concentration is increasing and, more specif-
ically, it is increasing more than the reduced hemoglobin
concentration. It is possible to notice that the VMR pattern
is always comprised into this region. An initial increase in
the CO
2
Hb concentration is rapidly compensated by a
steep increase in the O
2
Hb concentration. Contemporarly,
Bidimensional VMR pattern for 4 healthy subjectsFigure 8
Bidimensional VMR pattern for 4 healthy subjects. Bidimensional reactivity pattern as derived by the NIRS signals for
four healthy subjects. Each red circle represents the instantaneous concentration of CO
2
Hb (horizontal axis) and O
2
Hb (vertical
axis). All the values are normalized with respect to the maximum. The dotted lines depict the first and third quadrants bisec-
tors. All the graphs present characteristics of the VMR pattern of healthy subjects and are almost always comprises into the
region delimited by the two bisectors. 15 subjects showed patterns similar to A and B, 4 subjects showed a pattern similar to
graph C, whereas graph D is relative to the subject that showed the shorter plateau region.
-1 -0.5 0.5 1
-0.5
0.5
1
-1 -0.5 0.5 1
-0.5
0.5
1
-1 -0.5 0.5 1
-0.5
0.5
1
-1 -0.5 0.5 1
-0.5
0.5
1
CO
2
Hb (a.u.)
O
2
Hb (a.u.)O
2
Hb (a.u.)
CO
2
Hb (a.u.)
A
B
CD
Journal of NeuroEngineering and Rehabilitation 2006, 3:16 />Page 10 of 13
(page number not for citation purposes)
CO
2
Hb is kept at a concentration a little lower than the
initial one. When the vasodilation has reached its maxi-
mum, there's a plateau region in which the O
2
Hb concen-
tration remains almost constant, while the CO
2
Hb
concentration starts increasing; afterwards, BH ends. This
behavior was found for all the healthy subjects tested: fig-
ure 8 depicts the bidimensional VMR pattern for four dif-
ferent subjects. Even though the four patterns are
different, there are common features that are characteristic
of an intact autoregulation mechanism: i) after a very
short initial phase, the VMR pattern is always comprised
into the region delimited by the first and third quadrant
bisectors; ii) CO
2
Hb is kept at baseline concentrations
during the VMR phase, or, in some subjects, may decrease
its concentration (graph C); iii) the final portion of the
BH is characterized by a plateau region during which
O
2
Hb is almost constant and CO
2
Hb tends to increase (a
brief plateau region is observable in graph D, this pattern
is relative to the subject that showed the minimum and
shorter plateau phase).
A validation of these result is not straightforward: there
are no studies, that we are aware of, that derived such bidi-
mensional patterns from NIRS signals. However, the
highly repeatable pattern we found in normal subjects
suggests that cerebral autoregulation shows common fea-
tures when counteracting the effects of BH. From a meth-
odological point of view, we believe that the observation
of the bidimensional pattern may be of help in interpret-
ing more complex practical situations where autoregula-
tion is impaired: in these conditions, a different balancing
of the two chromophore concentrations could be
expected. The following section reports two case studies,
whose TCD and NIRS data are compared to our normative
data.
Case reports
Subject A – current smoker
This subject could voluntary hold the breath for 24 sec-
onds, hence significantly less than the average of the nor-
mal controls. The first row of Table 3 summarizes the TCD
and NIRS indexes for this subject. Similar to those of nor-
mal subjects were the BHI
V
(equal to 0.82 %/s) and the PIs
before and after the BH (equal to 0.86 and 0.70 respec-
tively). By means of the NIRS recordings, we computed a
similar to that of normal subjects (0.054
µ
mol/l/
s), but a greater (0.051
µ
mol/l/s). The slope of
the O
2
Hb signal was equal to 0.132
µ
mol/1/s and the
slope of the CO
2
Hb was equal to 0.158
µ
mol/1/s. These
results are explained by the left panel of figure 9, which
represents the time course of the two hemoglobin concen-
trations during BH. It can be noticed how O
2
Hb starts
increasing only at the end of the BH phase, whereas
CO
2
Hb rapidly increases during all the apnea and is never
compensated. With respect to the average behavior of the
normal population, this subjects depicts a delayed onset
of VMR, a lack of increase in the O
2
Hb concentration, and
an uncompensated increase of the CO
2
Hb concentration.
BHI
O
2
BHI
CO
2
NIRS signals and VMR pattern for subject AFigure 9
NIRS signals and VMR pattern for subject A. Time course of the O
2
Hb and CO
2
Hb concentration signals for subject A
(healthy current smoker) during BH (left panel) and bidimensional VMR pattern (right panel). The signals reveal an uncompen-
sated increase of the CO
2
Hb level, that determines a VMR pattern always out of the two bisectors region. Also, the onset of
VMR is delayed and the VMR pattern never reaches a plateau condition.
-1
0
1
2
3
4
5
10 s
time
concentration (µmol/l)
O
2
Hb
CO
2
Hb
BH onset
BH offset
-1 -0.5 0.5 1
-0.5
0.5
1
CO
2
Hb (a.u.)
O
2
Hb (a.u.)
Journal of NeuroEngineering and Rehabilitation 2006, 3:16 />Page 11 of 13
(page number not for citation purposes)
Moreover, BH ends without reaching a plateau condition.
The right panel of figure 9 shows the bidimensional VMR
pattern derived by the NIRS data. It is evident that vasore-
activity is different from the pattern of normal subjects:
the VMR pattern constantly moves in the 2D plane
towards the increasing CO
2
Hb concentration direction
and the increase in the O
2
Hb concentration is insufficient.
As a consequence, the VMR pattern is never comprises
between the two bisectors. Breath – holding, also, ends
without reaching a plateau phase, hence it is impossible to
state if this subject could compensate by reaching his max-
imum vasodilation. Several studies have already been
devoted to the quantification of VMR in healthy current
smokers (see [19,20] among others), even though results
are not always in accordance each other: if some authors
found a reduced cerebral blood volume during hypercap-
nia [21,22], other investigators did not find repeatable
VMR patterns [23]. By means of our technique, we could
document the delayed onset of VMR, the uncompensated
CO
2
Hb concentration rise during BH, the VMR bidimen-
sional pattern always out of the bisectors region, and the
absence of a plateau region, that could stand for a chronic
alteration of current smoking on the baroreceptor control
[24].
Subject B – post-stroke subject
During the first test, this subject could hold the breath for
47 seconds. Despite the good duration of BH, the second
row of Table 3 reveals how VMR was strongly impaired:
the BHI
V
was very small, and there was no drop of resist-
ance in the peripheral vessels due to apnea (PI greater after
BH than in baseline conditions). NIRS data confirmed
this absence of VMR: , , and
were extremely low. Figure 10 (left panel)
BHI
O
2
BHI
CO
2
slope
O
2
slope
CO
2
Table 3: BHIs derived from TCD and NIRS signals for the case studies. Values of the BHI and of the slope of the O
2
Hb and CO
2
Hb
concentration signals derived from the NIRS data for the two case studies. The first row reports the BH indicators for subject A, the
second row reports the same indicators for the first test of subject B, and the third row reports the same indicators for the second test
of subject B.
BHI
V
(%/s) PI baseline PI BH
(
µ
mol/1/s)
(
µ
mol/1/s)
(
µ
mol/1/s)
(
µ
mol/1/s)
Subject A 0.82 0.86 0.70 0.054 0.051 0.132 0.158
Subject B – 1st test 0.05 0.61 0.64 0.0075 0.0005 0.015 0.0004
Subject B – 2nd test 0.9 0.63 0.60 0.046 -0.0048 0.026 0.046
BHI
O
2
BHI
CO
2
slope
O
2
slope
CO
2
NIRS signals and VMR pattern for subject B – 1st testFigure 10
NIRS signals and VMR pattern for subject B – 1st test. Time course of the O
2
Hb and CO
2
Hb concentration signals for
subject B (post-stroke subject) during BH (left panel) and bidimensional VMR pattern (right panel). Data are realtive to the first
test, i.e. before the subject underwent therapy. The NIRS signals reveal the absence of vasoreactivity; the 2D pattern shows no
functional organization.
BH onset
BH offset
-1
0
1
2
3
4
5
20 s
time
concentration (µmol/l)
O
2
Hb
CO
2
Hb
CO
2
Hb (a.u.)
O
2
Hb (a.u.)
-1 -0.5 0.5 1
-0.5
0.5
1
Journal of NeuroEngineering and Rehabilitation 2006, 3:16 />Page 12 of 13
(page number not for citation purposes)
shows that there were no remarkable modifications in the
O
2
Hb and CO
2
Hb concentrations during BH. The right
panel of figure 10 depicts the bidimensional VMR pattern
and confirms the absence of vasoreactivity: the hemo-
globin concentrations change with no functionally signif-
icant coordination. Clinically, this subject suffered form
an ischemic event to the left MCA, which determined a
peripheral vasodilation and the onset of a compensatory
circulation in the other branches of the Willis' circle.
Hence, this subject was unable to react to a carbon dioxide
increase since, to counteract the effects of stroke, its arteri-
olar bed was already in vasodilation conditions.
After being treated with drugs and logopedic therapy for
one year, the subject improved his motor and phasic per-
formances. The results of the BH test reveal the effects of
the therapy: the BHI
V
increases and the PI shows a drop
during BH, meaning a little vasodilation is now present.
Also, , and increased, demon-
strating that the subjects improved its reaction to the
apnea. Figure 11 depicts the O
2
Hb and CO
2
Hb concentra-
tions during BH (left panel) and the bidimensional VMR
pattern (right panel) derived from the NIRS data collected
after therapy. It can be noticed how the O
2
Hb presents
greater variations during BH: these changes determine a
bidimensional pattern that is, at least in a portion, com-
prised by the two bisectors. Moreover, VMR has now func-
tionally sounding characteristics: O
2
Hb increases while
CO
2
Hb is kept at low values.
Even though further studies are required, we believe this
analysis methodology could be useful for monitoring and
quantifying the effects of neurorehabilitation trials.
Conclusion
In this paper we proposed a methodology for the assess-
ment of VMR during voluntary BH. This methodology
relates oxygen supply to cerebral blood flow by calculat-
ing BHIs based on TCD and NIRS data. We introduced a
bidimensional representation of VMR during BH that we
consider important to monitor the unbalancing between
O
2
Hb and CO
2
Hb as consequence to a varied local oxygen
demand.
On a population of 20 healthy subjects, we showed that
the increment of the cerebral blood flow velocity in the
middle cerebral artery is linearly correlated to the incre-
ment of the O
2
Hb when vasoreactivity is triggered by vol-
untary breath holding. Moreover, we provided normative
BHI values on this sample population.
We observed that the vasoreactivity pattern of healthy
subjects is characterized by common features that are not
present if autoregulation is impaired: as an example we
presented two case studies (a current smoker healthy sub-
BHI
O
2
slope
O
2
slope
CO
2
NIRS signals and VMR pattern for subject B – 2nd testFigure 11
NIRS signals and VMR pattern for subject B – 2nd test. Time course of the O
2
Hb and CO
2
Hb concentration signals for
subject B (post-stroke subject) during BH (left panel) and bidimensional VMR pattern (right panel). Data are realtive to the sec-
ond test, i.e. after one year of drug and logopedic theraphy. The NIRS signals reveal an little increase in the O
2
Hb concentration
that was not observable in previous examination; the 2D pattern shows that a functional response is present since O
2
Hb
increases while CO
2
Hb is kept at low levels. This changes in the VMR data are in accordance with the clinical evaluation, which
reported an improvement in motor and phasic scores.
BH onset
BH offset
O
2
Hb
CO
2
Hb
-1
0
1
2
3
4
5
20 s
time
concentration (µmol/l)
CO
2
Hb (a.u.)
O
2
Hb (a.u.)
-1 -0.5 0.5 1
-0.5
0.5
1
Journal of NeuroEngineering and Rehabilitation 2006, 3:16 />Page 13 of 13
(page number not for citation purposes)
ject and a post-stroke subject) and reported their BHIs and
their bidimensional VMR patterns.
We believe these normative data could be useful when
assessing vasoreactivity of subjects suffering both from
chronic than acute pathologies with a direct impact on
cerebral circulation.
From a methodological point of view, this joint analysis
of TCD and NIRS signals could be used as a low-cost pro-
cedure for the bedside assessment of patients. Even
though further studies are required in order to test the
technique's performances, we consider this methodology
as promising and we are planning protocols to monitor
the effects of neurorehabilitation protocols in post-stroke
patients.
Competing interests
The author(s) declare that they have no competing inter-
ests.
Authors' contributions
FM carried out the data analysis, participated in the exper-
imental protocol design, and drafted the manuscript. WL
designed the experimental protocol, participated in draft-
ing the manuscript, and was responsible for the clinical
evaluation of the subjects involved in the study. GG was
responsible for the TCD data acquisition, participated in
the TCD data analysis, and participated in the definition
of the experimental protocol. EN was responsible for the
NIRS data acquisition, participated in the NIRS data anal-
ysis, and participated in the definition of the experimental
protocol. All authors read, commented, reviewed and
approved the final manuscript.
Acknowledgements
The Authors would like to thank Dr. Silvia Delsanto (Biolab, Dipartimento
di Elettronica, Politecnico di Torino) who revised the final draft of the man-
uscript and who suggested technical improvements, and Dr. Pierangela
Giustetto (visiting scientist at the Presidio Sanitario Gradenigo, Torino)
who helped in the interpretation of early studies and in the experimental
protocol refinement.
References
1. Ogawa S, et al.: Functional brain mapping by blood oxygena-
tion level-dependent contrast magnetic resonance imaging.
A comparison of signal characteristics with a biophysical
model. Biophys J 1993, 64(3):803-812.
2. Newell D, Aaslid R: Transcranial Doppler New York: Raven Press;
1992.
3. Alexandrov A, Joseph M: Transcranial Doppler: an overview of
its clinical applications. The Internet J of Emergency and Intensive
Care Medicine 2000, 4:.
4. Smielewsky P, Kirkpatrick P, Minhas P, Pickard J, Czosnyka M: Can
Cerebrovascular Reactivity Be Measured With Near-Infra-
red Spectroscopy? Stroke 1995, 26:2285-2292.
5. Provinciali L, Minciotti P, Ceravolo G, Sanguinetti C: Investigation
of cerebrovascular reactivity using transcranial Doppler
sonography. Evaluation and comparison of different meth-
ods. Fund Neurol 1990, 5:33-41.
6. Piepgras A, Schmiedek P, Leisinger G, Haberl R, Kirsch C, Einhöupl K:
A simple test to assess cerebrovascular reserve capacity
using transcranial Doppler sonography and acetazolamide.
Stroke 1990, 21:1306-1311.
7. Terborg C, Felix G, Weiller C, Röther J: Reduced Vasomotor
Reactivity in Cerebral Microangiopathy. A Study With Near-
Infrared Spectroscopy and Transcranial Doppler Sonogra-
phy. Stroke 2000, 31:924-929.
8. Silvestrini M, et al.: Basilar and middle cerebral arteries reactiv-
ity in patients with migraine. Headache 2004, 44:29-34.
9. Vernieri F, et al.: Transcranial Doppler and Near-Infrared Spec-
troscopy Can Evaluate the Hemodynamic Effect of Carotid
Artery Occlusion. Stroke 2004, 35:64-72.
10. Tiemeier H, Bakker S, Koudstaal P, MMB B: Cerebral haemody-
namics and depression in the elderly. J Neurol Neurosurg Psychi-
atry 2002, 73:34-39.
11. Kuboyama N, Nabetani T, Shibuya K, Machida K, Ogaki T: The
Effect of Maximal Finger Tapping on Cerebral Activation. J
Physiol Anthropol Appl Human Sci 2004, 23:105-110.
12. Kato H, Izumiyama M, Koizumi H, Takahashi A, Itoyama Y: Near-
Infrared Spectroscopic Topography as a Tool to Monitor
Motor Reorganization After Hemiparetic Stroke. A Com-
parison With Functional MRI. Stroke 2002, 33:2032-2036.
13. Safonova L, Michalos A, Wolf U, Wolf M, Hueber D, Choi J, Gupta R,
Plzonetti C, Mantulin WEG: Age-correlated changes in cerebral
hemodynamics assessed by near-infrared Spectroscopy. Arch
Gerontol Geriatrics 2004, 39:207-225.
14. Bartels E: Color-Coded Duplex Ultrasonography of the Cerebral Vessels
Stuttgart, Germany: Schattauer; 1999.
15. Okada E, Firbank M, Schweiger M, Arridge S, Cope M, Delpy D: The-
oretical and experimental investigation of near infrared light
propagation in a model of the adult head. Appl Opt 1997,
36:21-31.
16. Firbank M, Okada E, DT D: A theoretical study of the signal con-
tribution of regions of the adult head to near – infrared spec-
troscopy studies of visual evoked potentials. Neuroimage 1998,
8(1):69-78.
17. Tegeler C, Babikian V, Gomez C: Neurosonology St Louis, Missouri,
USA: Mosby – Year Book; 1996.
18. Johnston A, Steiner L, Gupta A, Menon D: Cerebral oxygen vaso-
reactivity and cerebral tissue oxygen reactivity. Br J Anaesth
2003, 90(6):774-786.
19. Terborg C, Bramer S, Weiller C, Röther J: Short-term effect of
cigarette smoking on CO2-induced vasomotor reactivity in
man: A study with near-infrared spectroscopy and tanscra-
nial Doppler sonography. J Neurol Sci 2002, 205:15-20.
20. Terborg C, Birkner T, Bärbel S, Witte O: Acute effects of ciga-
rette smoking on cerebral oxygenation and hemodynamics:
A combined study with near-infrared spectroscopy and tran-
scranial Doppler sonography. J Neurol Sci 2002, 205:71-75.
21. Kubota K, Yamaguci T, Abe Y, Fujiwara T, Hatazawa JTM: Effects of
smoking on regional cerebral blood flow in neurologically
normal subjects. Stroke 1983, 14:720-724.
22. Rogers R, Meyer J, Shaw T, Mortel K, Hardenberg J, Zaid R: Ciga-
rette smoking decreases cerebral blood flow suggesting
increased risk for stroke. JAMA 1983, 250:2796-2800.
23. Kimura K, Matsumoto M, Handa N, Hashikawa K, Moriwaki H: Non-
invasive assessment of acute effects of cigarette smoking on
cerebral circulation. Yakubutsu Seishin Kodo 1993, 13:183-190.
24. Gerhardt U, Vorneweg P, Riedasch M, Hohage H: Acute and per-
sistant effects of smoking on the baroreceptor function. J
Auton Pharmacol 1999, 19(2):105-108.