báo cáo hóa học: " Quantification of functional weakness and abnormal synergy patterns in the lower limb of individuals with chronic stroke" pdf
Bạn đang xem bản rút gọn của tài liệu. Xem và tải ngay bản đầy đủ của tài liệu tại đây (501.52 KB, 11 trang )
Journal of NeuroEngineering and
Rehabilitation
BioMed Central
Open Access
Research
Quantification of functional weakness and abnormal synergy
patterns in the lower limb of individuals with chronic stroke
Nathan Neckel*1,3, Marlena Pelliccio1,2, Diane Nichols1,2 and
Joseph Hidler1,3
Address: 1Center for Applied Biomechanics and Rehabilitation Research(CABRR), National Rehabilitation Hospital, 102 Irving Street, NW,
Washington, DC 20010, USA, 2Physical Therapy Service, National Rehabilitation Hospital, 102 Irving Street, NW, Washington, DC 20010, USA
and 3Department of Biomedical Engineering, Catholic University, 620 Michigan Ave., NE, Washington, DC 20064, USA
Email: Nathan Neckel* - ; Marlena Pelliccio - ; Diane Nichols - ;
Joseph Hidler -
* Corresponding author
Published: 20 July 2006
Journal of NeuroEngineering and Rehabilitation 2006, 3:17
doi:10.1186/1743-0003-3-17
Received: 01 December 2005
Accepted: 20 July 2006
This article is available from: />© 2006 Neckel et al; licensee BioMed Central Ltd.
This is an Open Access article distributed under the terms of the Creative Commons Attribution License ( />which permits unrestricted use, distribution, and reproduction in any medium, provided the original work is properly cited.
Abstract
Background: The presence of abnormal muscle activation patterns is a well documented factor limiting
the motor rehabilitation of patients following stroke. These abnormal muscle activation patterns, or
synergies, have previously been quantified in the upper limbs. Presented here are the lower limb joint
torque patterns measured in a standing position of sixteen chronic hemiparetic stroke subjects and sixteen
age matched controls used to examine differences in strength and coordination between the two groups.
Methods: With the trunk stabilized, stroke subjects stood on their unaffected leg while their affected foot
was attached to a 6-degree of freedom load cell (JR3, Woodland CA) which recorded forces and torques.
The subjects were asked to generate a maximum torque about a given joint (hip abduction/adduction; hip,
knee, and ankle flexion/extension) and provided feedback of the torque they generated for that primary
joint axis. In parallel, EMG data from eight muscle groups were recorded, and secondary torques
generated about the adjacent joints were calculated. Differences in mean primary torque, secondary
torque, and EMG data were compared using a single factor ANOVA.
Results: The stroke group was significantly weaker in six of the eight directions tested. Analysis of the
secondary torques showed that the control and stroke subjects used similar strategies to generate
maximum torques during seven of the eight joint movements tested. The only time a different strategy was
used was during maximal hip abduction exertions where stroke subjects tended to flex instead of extend
their hip, which was consistent with the classically defined "flexion synergy." The EMG data of the stroke
group was different than the control group in that there was a strong presence of co-contraction of
antagonistic muscle groups, especially during ankle flexion and ankle and knee extension.
Conclusion: The results of this study indicate that in a standing position stroke subjects are significantly
weaker in their affected leg when compared to age-matched controls, yet showed little evidence of the
classic lower-limb abnormal synergy patterns previously reported. The findings here suggest that the
primary contributor to isometric lower limb motor deficits in chronic stroke subjects is weakness.
Page 1 of 11
(page number not for citation purposes)
Journal of NeuroEngineering and Rehabilitation 2006, 3:17
Background
Muscle weakness, or the inability to generate normal levels of force, has clinically been recognized as one of the
limiting factors in the motor rehabilitation of patients following stroke [1,2]. In the lower limbs, this muscle weakness can be attributed to disuse atrophy [3] and/or the
disruption in descending neural pathways leading to
inadequate recruitment of motorneuron pools [1,4-6]. It
has also been reported that weakness following stroke
may be the result of co-contraction of antagonistic muscles [7-9]. Spasticity has also been proposed as an alternative explanation for lower limb impairments in
hemiparetic stroke [10,11], but more recent studies have
found that spasticity may not play a significant role in gait
abnormalities [12,13].
A well documented factor limiting the motor rehabilitation of patients following stroke is the presence of abnormal muscle activation patterns. Following stroke, some
patients lose independent control over select muscle
groups, resulting in coupled joint movements that are
often inappropriate for the desired task [14,15]. These
coupled movements are known as synergies and, for the
lower limb, have been grouped into the extension synergy
(internal rotation, adduction, and extension of the hip,
extension of the knee and extension and inversion of the
ankle) and the flexion synergy (external rotation, abduction, and flexion of the hip, flexion of the knee, and flexion and eversion of the ankle) [16,17] with varying levels
of completeness [18] and dominance [19].
Much of the literature attempting to quantify these abnormal muscle synergies is focused on the paretic upper limb
of stroke patients. In isometric conditions, it has been
shown that stroke patients have a limited number of
upper limb synergies available to them due to abnormal
muscle coactivation patterns [20]. In dynamic tasks,
abnormal synergy patterns exist in the paretic upper limb
between shoulder abduction with elbow flexion as well as
shoulder adduction with elbow extension [21]. These,
and other inappropriate upper limb muscle synergy patterns were attributed to abnormal torque generation
about joints secondary to the intended, or primary, joint
axis during maximal voluntary isometric contractions
[22].
This analysis technique of quantifying torques at joints
secondary to the intended joint axis was applied to the
lower limbs of cerebral palsy patients in a seated position,
where abnormal secondary joint torques were expressed
during maximal hip and knee extension [23]. However, it
has been shown that gravity can influence the control of
limb movements by affecting sensory input [24] and altering task mechanics [25,26]. When acute (<6 weeks postinjury) stroke subjects were placed in a functionally rele-
/>
vant weight-bearing anti-gravity standing position, no
such abnormal secondary joint torque patterns during
maximal voluntary isometric contractions were found,
even though primary joint torques deficits were observed
[27].
The goal of this study was to quantify lower limb weakness and coordination in chronic (> 1 year post-injury)
stroke patients in a functionally relevant standing position. Subjects were asked to generate maximum isometric
contractions about a given joint while torques at joints
secondary to the desired exertion were simultaneously calculated and recorded. This allowed us to quantify weakness as a torque deficit and coordination as the generation
of any synergy patterns in the lower limbs of hemiparetic
stroke patients. Additionally, EMG activity of relevant
muscles was simultaneously recorded to quantify the
presence of abnormal muscle activation patterns.
Methods
Subjects
Sixteen subjects (9 male, 7 female) with hemiparesis
resulting from a single unilateral cortical or sub-cortical
brain lesion at least one year prior to testing participated
in this study along with sixteen (9 male, 7 female) neurologically intact age-matched controls. Subjects were
excluded from the study if they were too severely impaired
to voluntarily move about the ankle, knee, and hip joints,
measured by a Fugl-Meyer lower limb score below 10 out
of 34. Subjects with a Fugl-Meyer lower limb score greater
than 30 out of 34 were deemed very highly functional and
excluded. The synergy control sub-score of the Fugl-Meyer
assessment was also used to characterize subjects. This
clinical score (0–22) reflects the ability to move within
(0–14), to combine (15–18), or to move out of (19–22)
classically defined dynamic synergy patterns. Although
some subjects scored high on the Fugl-Meyer lower limb
and synergy control sub-score, all subjects exhibited difficulty in walking typical of hemiplegic stroke subjects. Subjects were also screened for cognitive and communication
impairments and only those with Mini Mental State
Examination scores greater or equal to 22 were tested. All
subjects were excluded for any uncontrolled cardiovascular, neurological, or orthopaedic conditions, such as high
blood pressure, arthritis, or history of seizure, that would
inhibit exercise in a standing position. Informed consent
was obtained before testing and all protocols were
approved by the local institutional review boards. The
clinical characteristics of each subject group is shown in
Table 1.
Instrumentation
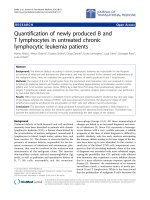
Each subject was placed in a custom setup that allowed for
the study of strength and coordination of the lower
extremities in a standing posture (Figure 1). The subject's
Page 2 of 11
(page number not for citation purposes)
Journal of NeuroEngineering and Rehabilitation 2006, 3:17
A
/>
B
Figure 1
Experimental Set-up
Experimental Set-up. A. Subjects were secured in a standing position with foam bumpers pinching the hips from four sides
and a safety harness prevented subjects from slipping down. The subject's foot was attached to a boot that was fixed to a six
DOF load cell that would measure joint torques about the hip, knee and ankle. A monitor provided feedback on the torque
generated in the primary joint direction. EMG activity was recorded from eight muscles. B. Photograph of experimental setup.
affected foot was securely placed inside a custom foot
retainer which in turn was connected to a 6-axis load cell
(JR3, Woodland CA). The foot retainer was angled down
30 degrees with respect to the horizontal so that all subjects had an ankle angle of 100 degrees and a knee angle
of 135 degrees. Large foam bumpers were used to support
the subject's trunk during the exertions. Because the tests
were done with the subject in a standing posture, a harness was placed around the subject's abdomen and
attached to an over-head body-weight support system in
order to prevent falls. No support was provided by the system during the tests. Some subjects did, however, sit down
in the harness between trials to rest their support leg.
Additionally, a heart rate monitor was placed around the
subject's chest which was repeatedly checked during testing by a physical therapist to ensure the exertions did not
elevate the subject's heart rate to unsafe levels. A monitor
for biofeedback was placed in front of the subjects to reinforce exertions along each joint axis.
Electromyographic (EMG) recordings were collected
using a Bagnoli-8 EMG system (Delsys, Inc., Boston, MA)
with surface electrodes placed above the muscle belly's of
the tibilias anterior, gastrocnemius, biceps femoris, vastus
medialis, rectus femoris, gluteus maximus, gluteus
medius, and adductor longus, and a common reference
electrode placed on the patella. Electrode sites were
abraded with a rough sponge and cleaned with isopropyl
alcohol. The Ag-AgCl electrodes (contact dimension 10
mm × 1 mm, contact spacing 10 mm) were prepped with
adhesive stickers and electrode gel. The preamplifiers provided a gain of ×10+-2%, the amplifiers a gain selectable
from ×100 to ×10,000 with a bandwidth of 20–450 Hz.
Page 3 of 11
(page number not for citation purposes)
Journal of NeuroEngineering and Rehabilitation 2006, 3:17
The common mode rejection ratio was >80 dB at 60 Hz
and the input impedance was >1015//0.2 ohm//pF.
EMG data, along with the forces and torques from the
load cell, were anti-alias filtered at 500 Hz prior to sampling at 1000 Hz using a 16-bit data acquisition board
(Measurement Computing, PCI-DAS 6402, Middleboro,
MA) and custom data acquisition software written in Matlab (Mathworks Inc. Natick, MA) and stored for later analysis.
Protocol
Subjects were asked to generate maximum voluntary torques (MVTs) about eight different joint directions (ankle,
knee, and hip flexion and extension, as well as hip abduction and adduction). For each joint direction, the subject
was allowed to practice until they understood the task,
after which three trials were recorded. Subjects were
watched closely to make sure that they maintained their
legs in the proper geometry. Trials were discarded and recollected if subjects attempted to change leg geometry in
order to achieve maximum torques. A minimum of one
minute rest period was given between each trial. The subjects would start in a relaxed state and slowly ramp up to
a maximum which was held for approximately 4 seconds.
Visual feedback of the torque generated only along the
desired direction was provided by a speedometer style display on the monitor. The order of joint movements was
selected to minimize subject fatigue (hip adduction, knee
/>
flexion, hip extension, ankle flexion, hip abduction, knee
extension, hip flexion, ankle extension). All subjects followed the same order of selected joint torques. Verbal
encouragement and instructions were provided throughout the experiment.
Data analysis
For each trial the MVT, or primary torque, as well as the
three secondary torques were measured along with the
EMG data from the eight selected muscles. The different
joint torques were computed by taking the forces and torques measured by the load cell (denoted frame {o}) and
transforming them back to the different joints using a
homogeneous transformation matrix [28]. From the load
cell, ankle torques can be calculated from:
a
03×3 ⎤ ⎡ Fo ⎤
⎡ Fa ⎤ ⎡ 0 R
⎥⎢ ⎥
⎢T ⎥ = ⎢ a
a
a
⎣ a ⎦ ⎢ Po ×o R o R ⎥ ⎣ To ⎦
⎣
⎦
(1)
a
where o R is a 3 × 3 rotation matrix from {o} to {a},
a
a
Po ×o R is a 3 × 3 skew matrix from {o} to {a}, and Fi
and Ti denote force and torque in each respective frame.
Ankle forces and moments can then be transformed back
to the knee as:
Table 1: Clinical Characteristics of Subjects
Group
Gender
Age (years)
Paretic Leg Tested
Months Post-Stroke
Synergy Control
(max. = 22)
Fugl-Meyer Score %
Stroke Survivors
F
F
F
F
F
F
F
M
M
M
M
M
M
M
M
M
30
36
48
51
53
57
64
44
50
50
55
56
59
63
68
69
R
R
R
L
L
L
R
R
R
R
R
R
L
L
L
R
39
26
13
54
36
26
14.5
149
194
29
34
30
13.5
23
20
18.5
13
21
21
21
6
20
9
17
16
14
10
15
16
11
19
11
79
88
68
91
53
53
88
71
53
56
68
47
44
47
47
76
Stroke
Average
9 male
7 female
53.31
(+/-10.68)
10 right leg
6 left leg
44.97
(51.18)
15
(4.72)
64.34
(16.46)
Control Average
9 male 7
female
57.13 (+/8.85)
10 right leg 6 left leg
/
/
/
Standard Deviation in parenthesis
Page 4 of 11
(page number not for citation purposes)
Journal of NeuroEngineering and Rehabilitation 2006, 3:17
k
03×3 ⎤ ⎡ Fa ⎤
⎡ Fk ⎤ ⎡ a R
⎥⎢ ⎥
⎢T ⎥ = ⎢ k
⎣ k ⎦ ⎢ Pa ×k R k R ⎥ ⎣ Ta ⎦
a
a ⎦
⎣
(2)
Statistical analyses was performed with the software package SPSS (SPSS Inc, Chicago, IL) and a confidence level of
0.05 was used for all comparisons.
The role of co-activation of antagonistic muscles on
observed joint weakness was investigated by computing a
co-contraction index (CI) for each primary torque direction as follows:
And from the knee to hip as:
h
03×3 ⎤ ⎡ Fk ⎤
⎡ Fh ⎤ ⎡ k R
⎢
⎥⎢ ⎥
⎢T ⎥ = h
⎣ h ⎦ ⎢ Pk ×h R h R ⎥ ⎣ Tk ⎦
k
k
⎣
⎦
/>
( 3)
The skew and rotation matrices are formed from anatomical measurements while the subject is in the setup (shank
and thigh lengths, knee and shank angles).
A MVT was defined as the peak torque sustained for 200
ms observed across any one of the 3 trials for that primary
joint direction. The corresponding secondary torques
exerted along the other joint axes during the 200 ms MVT
window were also identified. For example, during maximum voluntary knee flexion exertions, secondary torques
consisted of those generated along the ankle flexionextension axis, hip flexion-extension axis, and hip abduction-adduction axis. Secondary torques generated during
all trials were normalized to the MVT measured for that
particular joint direction. Cases where a secondary torque
exceeded 100% MVT indicated that the subject generated
less torque while attempting to maximize that particular
direction than when they were trying to maximize a different direction.
The EMG activity from the eight selected muscle groups
was band-pass filtered (20–450 Hz), full-wave rectified,
and then smoothed using a 200-point RMS algorithm.
Each EMG trace was then normalized to the maximum
EMG value observed across all trials for the respective
muscle. This allowed for muscle activity demonstrated
during the 200 ms MVT window to be expressed as the
percentage of peak activity observed in each muscle.
Statistical analysis
A single factor ANOVA was used to compare the means of
the chronic stroke subjects to the control subjects for each
of the eight primary joint torque directions. A single factor
ANOVA was used to compare the mean secondary torques, as well as the mean EMGs, between the stroke and
control groups. An independent Student's t-test was used
to identify secondary torques that were significantly
greater than zero (P < 0.05). Correlations (Pearson's, 2tailed) between joint torque were found by grouping all
data from the eight primary torque directions and comparing all instances of one torque direction with the activity at the other three joints. For example, all instances of
hip abduction were compared with the torques of the hip,
knee and ankle, regardless if it was flexion or extension.
CI =
∑ PCSAi ∗ EMGagonist ,i
∑ PCSA j ∗ EMGantagonist , j
(4)
where PCSA is the physiological cross sectional area of the
healthy adult muscle [29]. The total activity demonstrated
in the agonist muscle groups divided by the total muscle
activity demonstrated in the antagonistic muscle groups
results in the CI for that primary torque direction. One or
more of the eight muscles recorded from were regarded as
agonist/antagonist muscles for each primary torque direction (ankle flexor – tibilias anterior, ankle extensor – gastrocnemius, knee flexors – gastrocnemius and biceps
femoris, knee extensors – vastus medialis and rectus femoris, hip flexor – rectus femoris and adductor longus, hip
extensors – gluteus maximus and biceps femoris, hip
abductor – gluteus medius, hip adductor – adductor longus and gluteus maximus). It was important to scale the
muscle activity by the PCSA since activity in large muscle
groups generated significantly higher forces than activity
in muscles with smaller cross-sectional area. The CI is a
simple numerical measure of how much co-activation of
antagonistic muscle groups subjects exhibit. Low CI
occurs when subjects simultaneously activate agonist and
antagonist muscle groups, whereas high CI is indicative of
low levels of co-contraction. High levels of co-contraction
(Low CI) would result in decreasing levels of torque
exerted at the joint. A single factor ANOVA test was used
to compare the mean CI values of the chronic stroke subjects to the control subjects with a significance level of p <
0.05.
Results
Maximum voluntary torque
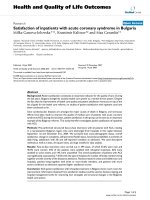
The maximum voluntary primary torques for the eight
joint directions are shown in figure 2. The stroke group
was significantly weaker (p < 0.05) for all joint directions
except for knee extension and hip flexion. The average
stroke hip flexion torque was less than the control group,
but with a higher variability. The average stroke knee
extension torque was actually larger than the control
group, but again, with a higher variability.
Secondary torque and EMG patterns
Figures 3 through 6 show the normalized secondary
torque patterns as well as the normalized EMG activity for
all control subjects and all but one stroke subject during
Page 5 of 11
(page number not for citation purposes)
Journal of NeuroEngineering and Rehabilitation 2006, 3:17
/>
150
140
Flexion
Extension
Flexion
Abduction
100
120
Flexion
Abduction
50
Torque Nm
% MVT
100
80
0
-50
*
*
-100
60
*
Flexion
-150
ip
H
Ankle Flexion
ip
H
ee
Kn
kle
An
ip
H
ip
H
Ankle
Flexion
*
ee
Kn
*
Extension
*
kle
An
40
*
Ankle
Extension
Ankle Extension
90
20
80
70
0
kle
An
Fl
ex
io
n
kle
Kn
Ex
te
ns
io
n
ee
Kn
Fl
ex
io
n
ee
Ex
Hi
te
ns
io
n
p
Hi
Fl
ex
io
n
p
Ex
Hi
te
ns
io
n
p
Ab
Hi
du
ct
io
n
*
p
Ad
*
*
*
60
du
ct
io
n
Figure 2
Maximum Voluntary Torques
Maximum Voluntary Torques. The maximum voluntary
joint torques for the stroke (red) and control (blue) groups
expressed in Newton meters for the eight primary directions
ankle flexion through hip adduction. Error bars represent
95% confidence interval. Significant differences (p < 0.05) are
denoted *.
the eight different primary directions. EMG data for one
stroke subject was improperly collected and has hence
been omitted. The stick figure diagrams illustrate the secondary torque generation that was significantly greater
than zero (P < 0.05). A more detailed discussion of the different joint directions is presented below.
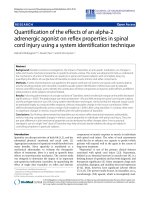
Ankle flexion/extension
As illustrated in Figure 3, during ankle flexion, both controls and stroke subjects generated knee extension and hip
flexion secondary torques. While generating maximal
ankle flexion, the stroke subjects had significantly less
tibilias anterior activity but significantly greater gastrocnemius, biceps femoris, gluteus maximus, and gluteus
medius activity. During maximal ankle extension exertions, the stroke subjects generated a knee flexion secondary torque that was significantly higher than the control
subjects (p < 0.05). The EMG pattern on the right side of
figure 3 shows that the stroke subjects had significantly
less gastrocnemius muscle activity and significantly
greater tibilias anterior, biceps femoris, vastus medialis,
rectus femoris, gluteus maximus, and adductor longus
muscle activity during maximal ankle extension exertions.
Knee flexion/extension
During maximal knee flexion exertions, both groups generated ankle extension, hip extension and hip adduction
secondary torques that were not different from each other
(Figure 4). Interestingly, the stroke subjects had significantly greater gluteus maximus, and gluteus medius activ-
% Maximum
An
50
*
*
*
*
*
*
*
*
40
30
20
10
0
Ti T G G Bi H Va V ReR G G G G AdA
dd
b ib as as F am s as c ec lut lu lutlu
t
An An
em S t Mt M t Ft F Mt M M M d L L
t t
tr
ed ed emem axax eded onogng
Ankle Flexion
Ad
T iT
GG
BH
A
G
G
i F m VVas RRec G luu Gllu
a
e
aa
b ib
a
l
An n s s
emS st tM ct tFF ttM utt M d L
A
M
M
M
on
tt
eem
ax
ed
ax
tr
eed
m
d
g
Ankle Extension
Figure 3
Secondary Torques During Ankle Flexion/Extension
Secondary Torques During Ankle Flexion/Extension.
The top graphs show the secondary joint torques for the
stroke (red) and control (blue) groups expressed in %MVT
for ankle flexion (left) and ankle extension (right). The stick
figures show the primary joint direction (green) as well as the
secondary torques of the control (blue) and stroke (red) for
the secondary joint torques that are significantly greater than
zero. Abduction is denoted as a circled dot (out of the page),
adduction is denoted a circled X (into the page). The bottom
graph shows the EMG activity for the stroke (red) and control (blue) groups expressed in % maximum value during
ankle flexion MVT (left) and ankle extension MVT (right).
Error bars represent 95% confidence interval. Significant differences between groups (p < 0.05) are denoted *. Tib Ant –
tibilias anterior, Gas – gastrocnemius, Bi Fem – biceps femoris, Vast Med – vastus medialis, Rect Fem – rectus femoris,
Glut Max -gluteus maximus, Glut Med – gluteus medius, Add
Long – adductor longus.
ity during maximum knee flexion exertions despite the
fact that they did not produce larger hip extension secondary torque. For knee extension, both groups produced
ankle flexion, hip flexion and hip abduction secondary
torques however the ankle flexion secondary torque was
significantly larger in the stroke group, and significantly
greater than 100%. The hip flexion secondary torque was
also greater than 100% in the control group but not significantly different than the stroke group. The EMG pattern
illustrates that the stroke group had a greater gastrocnemius and biceps femoris activity during knee extension
MVT.
Page 6 of 11
(page number not for citation purposes)
Journal of NeuroEngineering and Rehabilitation 2006, 3:17
/>
350
150
*
Flexion
300
100
250
Flexion
Extension
Flexion
Abduction
200
50
% MVT
% MVT
150
100
0
50
-50
0
Extension
Flexion
Adduction
-100
-50
Extension
-100
Hip Flexion
Hip
Extension
ip
ip
H
Knee Flexion
H
H
ip
Adduction
ip
H
ip
Kn
ee
Extension
ee
Kn
ip
An
kl
e
e
kl
H
An
H
Kn
ee
e
kl
An
kl
e
Flexion
-150
Hip
Flexion
Knee
Extension
Adduction
ip
H
Extension
ip
H
Flexion
ee
Kn
Extension
-150
An
Knee
Flexion
Hip Extension
90
Knee Extension
90
80
*
80
*
70
70
*
50
% Maximum
% Maximum
*
60
*
*
60
*
*
*
*
*
50
40
40
30
30
20
20
10
10
0
G
lu
Ad
d
tM
Lo
ed
n
g
ng
ed
Lo
tM
m
ax
ed
ax
d
tM
tM
lu
lu
lu
Ad
G
G
em
Fe
m
ct
F
G
Re
M
ed
ct
Va
st
M
t
St
r
st
Fe
m
Re
Bi
Ha
Va
An
An
t
as
b
G
as
G
ng
ed
Lo
tM
m
ax
ed
Fe
tM
d
lu
lu
Ti
b
Ti
G
G
ct
m
Hip Flexion
Ad
Ad
G
G
Re
Va
l
lu
d
st
ct
t M ut M
Lo
M
Fe
ed
ax
ed
ng
m
M
St
r
st
m
Re
Ha
Fe
t
g
as
Va
G
An
t
An
ng
ed
Lo
n
Lo
tM
tM
ed
Bi
b
Ad
d
d
m
ax
ax
em
lu
tM
G
lu
as
Ti
G
lu
tM
ed
Fe
M
ed
G
lu
ct
ct
F
Ad
G
Re
Re
St
r
M
t
m
Va
st
st
m
Fe
An
Ha
Bi
b
as
ng
An
t
G
as
Va
G
Ti
b
Ti
ed
Lo
tM
m
ax
ed
Fe
tM
d
lu
lu
ct
Knee Flexion
Ad
G
G
Re
m
M
t
Ad
G
G
Re
Va
l
lu
d
st
ct
t M ut M
Lo
M
Fe
St
ed
ax
ed
ng
r
m
st
m
Fe
An
Ha
Va
b
as
as
An
t
G
Bi
G
Ti
Ti
b
G
Ti
b
0
Hip Extension
Knee Extension
Figure 4
Secondary Torques During Knee Flexion/Extension
Secondary Torques During Knee Flexion/Extension.
The top graphs show the secondary joint torques for the
stroke (red) and control (blue) groups expressed in %MVT
for knee flexion (left) and knee extension (right). The stick
figures show the primary joint direction (green) as well as the
secondary torques of the control (blue) and stroke (red) for
the secondary joint torques that are significantly greater than
zero. Abduction is denoted as a circled dot (out of the page),
adduction is denoted a circled X (into the page). The bottom
graph shows the EMG activity for the stroke (red) and control (blue) groups expressed in % maximum value during
knee flexion MVT (left) and knee extension MVT (right).
Error bars represent 95% confidence interval. Significant differences between groups (p < 0.05) are denoted *. Tib Ant –
tibilias anterior, Gas – gastrocnemius, Bi Fem – biceps femoris, Vast Med – vastus medialis, Rect Fem – rectus femoris,
Glut Max -gluteus maximus, Glut Med – gluteus medius, Add
Long – adductor longus.
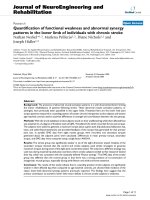
Hip flexion/extension
Figure 5 illustrates the secondary torques generated during
hip flexion, where it can be seen that neither group generated significant secondary torques. However the stroke
group produced greater activity in the gastrocnemius,
biceps femoris, rectus femoris, gluteus maximus, and gluteus medius muscles. During hip extension MVT, both
groups produced a secondary knee flexion torque and the
control group produced additional ankle extension and
Figure 5
Secondary Torques During Hip Flexion/Extension
Secondary Torques During Hip Flexion/Extension.
The top graphs show the secondary joint torques for the
stroke (red) and control (blue) groups expressed in %MVT
for hip flexion (left) and hip extension (right). The stick figures show the primary joint direction (green) as well as the
secondary torques of the control (blue) and stroke (red) for
the secondary joint torques that are significantly greater than
zero. Abduction is denoted as a circled dot (out of the page),
adduction is denoted a circled X (into the page). The bottom
graph shows the EMG activity for the stroke (red) and control (blue) groups expressed in % maximum value during hip
flexion MVT (left) and hip extension MVT (right). Error bars
represent 95% confidence interval. Significant differences
between groups (p < 0.05) are denoted *. Tib Ant – tibilias
anterior, Gas – gastrocnemius, Bi Fem – biceps femoris, Vast
Med – vastus medialis, Rect Fem – rectus femoris, Glut Max gluteus maximus, Glut Med – gluteus medius, Add Long –
adductor longus.
hip adduction secondary torques that were not significantly different from the stroke. The EMG pattern in figure
5 shows that the stroke group had greater gastrocnemius
and gluteus medius activity during hip extension MVT.
Hip abduction/adduction
During hip abduction, the control group produced a hip
extension secondary torque while the stroke group produced a hip flexion secondary torque, the difference being
significantly different (Figure 6). During hip abduction
MVT, the stroke subjects had significantly greater gastroc-
Page 7 of 11
(page number not for citation purposes)
Journal of NeuroEngineering and Rehabilitation 2006, 3:17
/>
150
Flexion
Extension
Flexion
Abduction
100
*
% MVT
50
0
-50
-100
Extension
Hip
Abduction
Flexion
Extension
Adduction
Hip
Adduction
-150
An
kl
e
Hi
p
Kn
ee
An
kl
e
Hi
p
Hi
p
Kn
ee
Hip Abduction
Hi
p
Hip Adduction
90
80
70
*
% Maximum
*
*
60
*
*
G
H
*
*
50
40
30
20
10
0
Ad
G
ng
ed
Lo
tM
d
lu
m
ax
ed
Fe
tM
ct
lu
Re
m
St
r
M
t
Ad
G
G
R
Va
ec
l
lu
d
st
t M ut M
tF
Lo
M
em
ed
ax
ed
ng
st
Fe
An
am
G
H
Va
b
as
as
An
t
Bi
G
Ti
Ti
b
G
ng
ed
m
ax
Lo
tM
tM
d
lu
lu
ed
Fe
Hip Abduction
Ad
G
ct
m
G
R
Ad
G
ec
l
lu
d
t M ut M
tF
Lo
em
ed
ax
ng
M
ed
M
t
St
r
G
Va
st
st
Fe
am
Re
Bi
An
as
Va
b
An
t
as
b
G
Ti
Ti
Hip Adduction
Figure 6
Secondary Torques During Hip Abduction/Adduction
Secondary Torques During Hip Abduction/Adduction. The top graphs show the secondary joint torques for
the stroke (red) and control (blue) groups expressed in
%MVT for hip abduction (left) and hip adduction (right). The
stick figures show the primary joint direction (green) as well
as the secondary torques of the control (blue) and stroke
(red) for the secondary joint torques that are significantly
greater than zero. Abduction is denoted as a circled dot (out
of the page), adduction is denoted a circled X (into the page).
The bottom graph shows the EMG activity for the stroke
(red) and control (blue) groups expressed in % maximum
value during hip abduction MVT (left) and hip adduction MVT
(right). Error bars represent 95% confidence interval. Significant differences between groups (p < 0.05) are denoted *.
Tib Ant – tibilias anterior, Gas – gastrocnemius, Bi Fem –
biceps femoris, Vast Med – vastus medialis, Rect Fem – rectus femoris, Glut Max -gluteus maximus, Glut Med – gluteus
medius, Add Long – adductor longus.
nemius and biceps femoris activity than the control subjects. For hip adduction MVT, none of the secondary
torques were significantly different. The EMG pattern on
the right side of figure 6 illustrates how the stroke group
had greater gastrocnemius, vastus medialis, rectus femoris, gluteus maximus, and gluteus medius activity than the
control subjects during hip adduction MVT.
Summary of secondary torques
For each group the secondary torques significantly greater
than zero for the eight primary joint directions (figures 3
through 6) are summarized in Table 2. For each primary
joint direction listed on the left, the secondary torques significantly greater than zero are marked with an 'X'. Additionally, significant correlations (p < 0.05) between joint
torques within each group are marked with an 'O'. To find
these correlations all instances (primary or secondary) of
a torque were pooled and compared to the other three
joint torques. For example, all trials where ankle flexion
was present were pooled and ankle flexion was compared
to knee flexion/extension, hip flexion/extension, and hip
abduction/adduction. The arrangement of rows and columns in Table 2 leads to the grouping of the primary joint
directions into synergies. These synergies are based on the
direction of the moment arm of the joint torque in the
sagittal plane. Ankle flexion, knee extension, and hip flexion secondary torques are grouped as the Anterior Synergy
while ankle extension, knee flexion, and hip extension are
grouped as the Posterior Synergy. The frontal plane joint
torques of hip abduction and adduction are differently
grouped. Hip adduction is part of the posterior synergy in
the control group but not part of any synergy in the stroke
group. Hip abduction is part of the anterior synergy in the
stroke group but part of the posterior synergy in the control group.
Co-contraction index
Figure 7 shows the co-contraction index for the eight primary torque directions. The stroke group produced a significantly lower index, and thus greater co-contraction of
antagonistic muscle groups during ankle flexion, ankle
extension and knee extension. This was especially true
during ankle extension where the stroke subjects exerted
significantly higher tibialis anterior activity than the control subjects.
Discussion
Primary joint torques
As expected, stroke subjects were weaker than agematched controls for ankle flexion and extension, hip
extension, abduction and adduction, and knee flexion.
Surprisingly there were no significant differences in hip
flexion and knee extension. Even more surprising was that
the stroke subjects were, on average, stronger than the
control group in knee extension. Median analysis confirms that this is not just the result of a few exceptional
stroke subjects. The median stroke knee extension torque
was 90.60 Nm while the median control knee extension
torque was 81.01 Nm. A closer inspection of the stroke
subjects that generated large knee extension or hip flexion
torques reveals that these stroke subjects were only
stronger in one joint direction, and often generated below
average MVT in the other joint directions tested. It is not
unreasonable for an ambulatory, active stroke subject to
use knee extension as part of a compensatory strategy, and
Page 8 of 11
(page number not for citation purposes)
Journal of NeuroEngineering and Rehabilitation 2006, 3:17
/>
Table 2: Secondary Torque Synergies
Control
Primary
Torque
Ankle
Flexion
Knee
Extension
Hip Flexion
X
X
Knee Extension
Hip Flexion
Hip Abduction
Hip Adduction
Ankle Extension
Knee Flexion
Hip Extension
XO
XO
Hip
Adduction
Ankle
Extension
Knee
Flexion
Hip
Extension
XO
Ankle Flexion
Hip
Abduction
XO
XO
XO
O
XO
XO
XO
X
O
X
XO
XO
XO
Stroke
Ankle Flexion
Knee Extension
Hip Flexion
Hip Abduction
Hip Adduction
Ankle Extension
Knee Flexion
Hip Extension
XO
XO
O
O
XO
XO
O
X
O
XO
X
XO
O
Anterior Synergy
O
XO
Posterior Synergy
over time, have it be as strong, or stronger, than an agematched control.
was found. However such conclusions are somewhat limited due to our sample size.
Other factors influencing MVT, such as age, sex, or time
post stroke were checked, but no significant correlation
Secondary joint torque patterns
Abnormal coordination patterns in the upper limbs of
hemiparetic stroke subjects have been quantified as the
generation of torque in joints secondary to the primary
joint axis [22]. When this analysis of secondary joint torques was applied to the lower limbs of cerebral palsy subjects, abnormal secondary torques were produced at the
hip and knee [23] which were consistent with the classically defined extension synergy [15,16,30]. Presented here
is evidence that such classically defined extension and
flexion synergy patterns are not present in the lower limbs
of chronic stroke subjects while in a functionally relevant
standing, weight bearing position.
60
Co-contraction Index
50
40
30
20
10
*
*
0
*
An
k le
An
Fl
ex
io
n
k le
Kn
Ex
te
ns
io
n
ee
Kn
Fl
ex
io
n
ee
Hi
Ex
te
ns
io
n
p
Fl
Hi
ex
io
n
p
Ex
Hi
te
ns
io
n
p
Ab
Hi
du
ct
io
n
p
Ad
du
ct
io
n
Figure 7
Co-contraction Index
Co-contraction Index. Cocontraction index for the eight
primary joint torques. Larger values represent lower levels of
cocontraction. Error bars represent 95% confidence interval.
Significant differences between groups (p < 0.05) are denoted
*.
Torque patterns of healthy subjects
When asked to generate MVTs along the hip, knee, and
ankle flexion and extension axes, the healthy control subjects produced secondary torques in the directions that
were consistent with both the mechanical demands of the
task and the physical properties of the musculature of the
legs. For instance, when asked to generate a maximum
knee extension torque, healthy subjects produced secondary hip and ankle flexion torques. So the presence of positive secondary torques of hip and ankle flexion are
consistent with mechanical demands of the task. Not surprisingly healthy subjects had a high level of rectus femo-
Page 9 of 11
(page number not for citation purposes)
Journal of NeuroEngineering and Rehabilitation 2006, 3:17
ris activity during knee extension MVT. The rectus femoris
is known as both a knee extensor and hip flexor so the
generation of secondary hip flexion during knee extension
is consistent with the physical properties of the leg musculature. This led to the grouping of the sagittal plane torques into two synergies. The posterior synergy consisted
of hip extension, knee flexion, and ankle extension while
the anterior synergy consisted of hip flexion, knee extension, and ankle flexion.
When asked to generate MVTs in the frontal plane joint
directions of hip abduction and adduction, healthy subjects produced secondary torques that were not necessarily
consistent with the physical properties of the musculature
of the legs. The adductor longus is known as a hip flexor
as well as adductor, but during high levels of adductor
longus activity there was no production of significant hip
flexion torque. However, the lower fibers of the gluteus
maximus are known to adduct the hip [31] and during
high gluteus maximus activity, there were significant secondary hip adduction torques. To further classify the
torque patterns of healthy subjects in the frontal plane
(joint exertions of hip abduction and adduction) a summary chart of significant secondary torques and correlated
joint moments was constructed. Table 2 shows that hip
adduction torque was correlated to knee flexion torque
(marked 'O'), whereas hip adduction secondary torques
were present during knee flexion and hip extension MVTs
(marked 'X'). This led to classifying hip adduction as part
of the posterior synergy. Even though hip abduction secondary torques were produced during a MVT of an anterior synergy component (knee extension) it has been
classified as part of the posterior synergy because hip
abduction torque was correlated to knee flexion and hip
extension. The presence of hip abduction secondary torques during ankle extension MVT further justifies the posterior synergy classification.
Torque patterns of chronic stroke subjects
During MVTs in the sagittal plane, chronic stroke subjects
showed no evidence of the classic extensor and flexor synergies and behaved similarly to the healthy subjects. The
torque patterns of the chronic stroke subjects differed
from the healthy subjects only during hip abduction MVT.
While healthy subjects produced significant hip extension
torques, chronic stroke subjects produced significant hip
flexion torque. This abnormal coupling of hip abduction
and hip flexion is consistent with the classically defined
flexion synergy.
A closer investigation into the secondary torque patterns
generated during knee extension revealed that secondary
torques were sometimes larger than the torques generated
voluntarily. While we cannot conclude this origin for certain, we postulate that a strategy used to generate a MVT
/>
may unknowingly involve certain levels of co-contraction
that would reduce the net torque. That is, it could be that
the agonist muscles may be more active and the antagonistic muscles more relaxed during a strategy used to generate a MVT about a different joint. This would result in a
net secondary torque that is larger than a net primary
torque. This is not too unusual in the case of chronic
stroke subjects generating secondary ankle flexion
moments twice as large as their voluntary maximums. The
majority of the stroke subjects had poor control at their
ankle and often struggled to produce substantial ankle
flexion torque. However while concentrating on knee
extension exertions, any small increase in a synergistic
ankle flexion exertions would be a rather large percentage.
The slight increase in tibilias anterior activity from 35.32
% maximum during ankle flexion MVT to 38.78% maximum during knee extension MVT further supports this.
Unfortunately this phenomena gets a little more unusual
when the levels of co-contraction are compared. A recalculation of ankle co-contraction index during knee extension MVT generation shows that there is a similar amount
of co-contraction about the ankle during both voluntary
ankle flexion (0.393 +/- 0.279 stdv) and voluntary knee
extension (0.396 +/- 0.378 stdv), although recordings of
the superficial leg muscles were made. It is likely that had
more muscles been recorded from (e.g. soleus) a better
understanding for the observed behavior could be
explained.
The interesting finding that in control subjects, hip flexion
secondary torques were greater than 100% MVT might be
explained by the activity of the rectus femoris. During hip
flexion MVT control subjects seamed to rely on moderate
levels of both rectus femoris (42% maximum) and adductor longus (52% maximum) to achieve hip flexion torques. But during knee extension MVT the rectus femoris
activity of the control subjects was higher (54% maximum). A recalculation of hip co-contraction index during
knee extension MVT shows that there is less co-contraction about the hip during voluntary knee extension (3.58
+/- 1.39 stdv) than during voluntary hip flexion (2.73 +/0.68 stdv). However these findings are not significantly
different and had more muscles been recorded from a better understanding for the observed behavior could be
explained.
Weakness in chronic stroke
In a functionally relevant standing position, chronic
stroke subjects produced significantly lower torques in six
of the eight joint directions tested. Weakness in stroke has
been attributed to inadequate recruitment of motorneuron pools [1,4,6] spasticity [10,11], disuse atrophy [3] and
the co-contraction of antagonists [7-9]. In an attempt to
quantify the amount of co-contraction during the generation of MVTs a co-contraction index was calculated. The
Page 10 of 11
(page number not for citation purposes)
Journal of NeuroEngineering and Rehabilitation 2006, 3:17
chronic stroke subjects produced significantly more cocontraction during ankle flexion and ankle extension
which may partially explain the joint torque deficits in
those directions. But the stroke subjects produced significantly more co-contraction during knee extension even
though they produced a similar level of torque. While
inadequate recruitment of motorneuron pools can not be
ruled out, it does appear that the co-contraction of antagonistic muscle groups may at least contribute to the
observed weakness in the chronic stroke subjects tested.
This is consistent with our previous work that demonstrated significant co-activation of antagonistic muscle
groups in acute stroke subjects [27].
/>
6.
7.
8.
9.
10.
11.
12.
Conclusion
Presented here for the first time is a quantitative analysis
of lower limb weakness and synergy patterns of chronic
stroke subjects in a functionally relevant standing weightbearing position. In a standing position with added vestibular inputs, stroke subjects showed little evidence of
the classic abnormal synergy patterns in seven of the eight
directions tested. The findings here suggest that the primary contributor to lower limb motor deficits in chronic
stroke subjects is weakness, which is at least partially due
to co-contraction of antagonistic muscles.
13.
14.
15.
16.
17.
Declaration of competing interests
18.
19.
The author(s) declare that they have no competing interests.
20.
Authors' contributions
NN carried out the experiments, collected and analyzed
the data, and drafted the manuscript. MP prepared subjects and assisted with the experiments. DN prepared subjects and assisted with the experiments. JH designed the
experiment, developed data collection software, and
helped draft the manuscript. All authors read, edited, and
approved the final manuscript.
21.
22.
23.
24.
Acknowledgements
We would like to extend our sincere thanks to the subjects who participated in the study. This work was funded by the Whitaker Foundation
(Arlington, VA; PI: J. Hidler).
25.
26.
References
1.
2.
3.
4.
5.
Bourbonnais D, Vanden Noven S: Weakness in patients with
hemiparesis. Am J Occup Ther 1989, 43(5):313-9.
Duncan PW, Badke MB: Stroke Rehabilitation: The Recovery of Motor
Control Chicago, Year Book Medical Pub; 1987.
Scelsi R, Lotta S, Lommi G, Poggi P, Marchetti C: Hemiplegic atrophy. Morphological findings in the anterior tibial muscle of
patients with cerebral vascular accidents. Acta Neuropathol
1984, 62(4):324-31.
McComas AJ, Sica RE, Upton AR, Aguilera N: Functional changes
in motoneurones of hemiparetic patients. J Neurol Neurosurg
Psychiatry 1973, 36(2):183-93.
Newham DJ, Hsiao SF: Knee muscle isometric strength, voluntary activation and antagonist co-contraction in the first six
months after stroke. Disability and Rehabilitation 2001, 23:379-386.
27.
28.
29.
30.
31.
Tang A, Rymer WZ: Abnormal force-EMG relations in paretic
limbs of hemiparetic human subjects. J Neurol Neurosurg Psychiatry 1981, 44(8):690-8.
Chae J, Yu DT: Neuromuscular electrical stimulation for
motor restoration in hemiparesis. Top Stroke Rehabil 2002,
8(4):24-39. Winter
Knuttson E, Richards C: Different types of disturbed motor control in gait of hemiparetic patients. Brain 1979, 102:405-430.
Knutsson E, Martensson A: Dynamic motor capacity in spastic
paresis and its relation to prime mover dysfunction, spastic
reflexes and antagonist co-activation. Scand J Rehabil Med 1980,
12(3):93-106.
Bobath B: Adult Hemiplegia: Evaluation and Treatment London, William
Heinnemann; 1978.
Corcos DM, Gottlieb GL, Penn RD, Myklebust B, Agarwal GC:
Movement deficits caused by hyperexcitable stretch reflexes
in spastic humans. Brain 1986, 109(Pt 5):1043-58.
Dietz V, Quintern J, Berger W: Electrophysiological studies of
gait in spasticity and rigidity. Evidence that altered mechanical properties of muscle contribute to hypertonia. Brain
1981, 104(3):431-49.
Yelnik A, Albert T, Bonan I, Laffont I: A clinical guide to assess the
role of lower limb extensor overactivity in hemiplegic gait
disorders. Stroke 1999, 30(3):580-5.
Brunnstrom S: Movement Therapy in Hemiplegia New York, Harper
and Row; 1970.
Twitchell TE: restoration of motor function following hemiplegia in man. Brain 1951, 74(4):443-80.
Brunnstrom S: Associated reactions of the upper extremity in
adult patients with hemiplegia; an approach to training. Phys
Ther Rev 1956, 36(4):225-36.
Waters RL, Frazier J, Garland DE, Jordan C, Perry J: Electromyographic gait analysis before and after operative treatment
for hemiplegic equinus and equinovarus deformity. J Bone Joint
Surg Am 1982, 64(2):284-8.
Michels E: Synergies in hemiplegia. Clin Manag 1982, 1:9-16.
Sawner K, LaVigne J: Brunnstrom's movement therapy in hemiplegia : a
neurological approach 2nd edition. Philadelphia, JB Lippincott;
1992:276.
Dewald JP, Pope PS, Given JD, Buchanan TS, Rymer WZ: Abnormal
muscle coactivation patterns during isometric torque generation at the elbow and shoulder in hemiparetic subjects.
Brain 1995, 118(Pt 2):495-510.
Beer RF, Given JD, Dewald JP: Task-dependent weakness at the
elbow in patients with hemiparesis. Arch Phys Med Rehabil 1999,
80(7):766-72.
Dewald JP, Beer RF: Abnormal joint torque patterns in the
paretic upper limb of subjects with hemiparesis. Muscle Nerve
2001, 24(2):273-83.
Thelen DD, Riewald SA, Asakawa DS, Sanger TD, Delp SL: Abnormal coupling of knee and hip moments during maximal exertions in persons with cerebral palsy. Muscle Nerve 2003,
27(4):486-93.
Young LR: Perception of the body in space: mechanisms. In
Handbook of Physiology, Sect 1 Volume 3. Issue Pt 2 Edited by:
Brookhart JM, Mountcastle VB, Darian-Smith. Bethesda: American
Physiological Society; 1984:1023-66.
McMahon TA: Muscles, reflexes, and locomotion Princeton, Princeton
University Press; 1984.
Davis BL, Cavanagh PR: Simulating reduced gravity: a review of
biomechanical issues pertaining to human locomotion
[Review]. Aviat Space Environ Med 1993, 64(6):557-66.
Hidler J, Carroll M, Federovich E, Lacsamana C: Loss of differential
muscle control leads to weakness and discoordination in
individuals with acute hemiparetic stroke. IEEE Engineering in
Medicine and Biology Society, Cancun, Mexico; 2003.
Craig JJ: An Introduction to Robotics: Mechanics and Control 1989.
Friederich JA, Brand RA: Muscle fiber architecture in the human
lower limb. J Biomech 1990, 23(1):91-5.
Sutherland DH, Davids JR: Common gait abnormalities of the
knee in cerebral palsy. Clin Orthop Relat Res 1993:139-47.
Hollinshead WH, Rosse C: Textbook of Anatomy 4th edition. Philadelphia, Harper & Row; 1985:398.
Page 11 of 11
(page number not for citation purposes)