báo cáo hóa học: "Co-activation: its association with weakness and specific neurological pathology" pptx
Bạn đang xem bản rút gọn của tài liệu. Xem và tải ngay bản đầy đủ của tài liệu tại đây (283.83 KB, 8 trang )
BioMed Central
Page 1 of 8
(page number not for citation purposes)
Journal of NeuroEngineering and
Rehabilitation
Open Access
Research
Co-activation: its association with weakness and specific
neurological pathology
Monica E Busse*
1
, Charles M Wiles
2
and Robert WM van Deursen
1
Address:
1
Department of Physiotherapy, Cardiff University, Cardiff, UK and
2
Department of Neurology, Cardiff University, Cardiff, UK
Email: Monica E Busse* - ; Charles M Wiles - ; Robert WM van Deursen -
* Corresponding author
Abstract
Background: Net agonist muscle strength is in part determined by the degree of antagonist co-
activation. The level of co-activation might vary in different neurological disorders causing
weakness or might vary with agonist strength.
Aim: This study investigated whether antagonist co-activation changed a) with the degree of
muscle weakness and b) with the nature of the neurological lesion causing weakness.
Methods: Measures of isometric quadriceps and hamstrings strength were obtained. Antagonist
(hamstring) co-activation during knee extension was calculated as a ratio of hamstrings over
quadriceps activity both during an isometric and during a functional sit to stand (STS) task (using
kinematics) in groups of patients with extrapyramidal (n = 15), upper motor neuron (UMN) (n =
12), lower motor neuron (LMN) with (n = 18) or without (n = 12) sensory loss, primary muscle
or neuromuscular junction disorder (n = 17) and in healthy matched controls (n = 32). Independent
t-tests or Mann Witney U tests were used to compare between the groups. Correlations between
variables were also investigated.
Results: In healthy subjects mean (SD) co-activation of hamstrings during isometric knee
extension was 11.8 (6.2)% and during STS was 20.5 (12.9)%. In patients, co-activation ranged from
7 to 17% during isometric knee extension and 15 to 25% during STS. Only the extrapyramidal
group had lower co-activation levels than healthy matched controls (p < 0.05). Agonist isometric
muscle strength and co-activation correlated only in muscle disease (r = -0.6, p < 0.05) and during
STS in UMN disorders (r = -0.7, p < 0.5).
Conclusion: It is concluded that antagonist co-activation does not systematically vary with the site
of neurological pathology when compared to healthy matched controls or, in most patient groups,
with strength. The lower co-activation levels found in the extrapyramidal group require
confirmation and further investigation. Co-activation may be relevant to individuals with muscle
weakness. Within patient serial studies in the presence of changing muscle strength may help to
understand these relationships more clearly.
Published: 20 November 2006
Journal of NeuroEngineering and Rehabilitation 2006, 3:26 doi:10.1186/1743-0003-3-26
Received: 05 June 2006
Accepted: 20 November 2006
This article is available from: />© 2006 Busse et al; licensee BioMed Central Ltd.
This is an Open Access article distributed under the terms of the Creative Commons Attribution License ( />),
which permits unrestricted use, distribution, and reproduction in any medium, provided the original work is properly cited.
Journal of NeuroEngineering and Rehabilitation 2006, 3:26 />Page 2 of 8
(page number not for citation purposes)
Background
Muscle weakness can develop as result of infection, neu-
rological problems, endocrine disorders, inflammatory
conditions, rheumatologic diseases, genetic or metabolic
conditions or may even be electrolyte or drug-induced [1].
Agonist muscle atrophy, failure of agonist muscle activa-
tion or excessive co-activation of antagonist muscle
groups crossing the same joint may each in principle con-
tribute to muscle weakness. Failure of agonist muscle acti-
vation (with or without secondary muscle atrophy) can be
the result of neurological pathology at any level in the vol-
untary motor pathway but the extent to which co-activa-
tion processes are affected by pathology at different sites is
unknown. Co-activation occurs during normal movement
patterns and may improve movement efficiency during
the performance of lower limb activities [2,3] with
increased joint stabilization and protection. By contrast,
excessive co-activation may result in impaired movement
and weakness, particularly in the presence of neurological
impairment [4].
Clinically increased muscle tone (e.g. spasticity in upper
motor neuron syndrome, rigidity in Parkinsonism) might
be expected to be associated with increased co-activation
during voluntary muscle contraction. Co-activation has
been quantified both during isometric muscle contrac-
tions [5,6], isokinetic contractions [7-9] and during the
performance of functional activities [2][10-12]. Most
neurology based co-activation studies have however been
undertaken in stroke patients or children with "cerebral
palsy" where hypoxic ischaemic pathology relatively non
selectively involves multiple CNS pathways and is associ-
ated with marked increases in muscle tone [13]. Such CNS
involvement may however include pyramidal, para-
pyramidal and extrapyramidal, cortical, subcortical and
cerebellar structures as well as sensory and association
pathways. It was therefore of interest to investigate patient
groups with weakness due to different pathologies to see
whether more selective patho-physiological causes of
weakness were associated with differing levels of co-acti-
vation. Furthermore, it was unclear from the literature
whether the level of co-activation systematically altered
with the degree of weakness.
We hypothesised that antagonist co-activation would not
be related to muscle strength per se but would be depend-
ent on the site of the neurological lesion causing weak-
ness. We expected that individuals with disorders of the
extra-pyramidal and pyramidal systems would demon-
strate higher levels of co-activation than healthy subjects.
Co-activation of the hamstrings was studied both during
isometric knee extension and a dynamic activity (sit to
stand).
Methods
Study design
A between-subject design (case: control) was used. Five
groups of patients (each n = 12 to n = 18) were compared
to an age and sex matched control group from a pool of
32 of healthy subjects. Pilot study data suggested mean
differences between neurology patients and healthy sub-
jects of 8.3% for isometric co-activation, 55 N.m for quad-
riceps strength and 23.6 N.m for hamstrings strength. This
equated to effect sizes of 1.38, 2.33 and 1.9 respectively. A
sample size of 15 in each group would achieve a power of
0.94 with an α-level of 0.05 [14]. In the situation of lower
numbers of cases being recruited e.g. n = 12, the equal
allocation power was 80%, power increases were obtained
by using unequal allocation of cases and controls [15].
Subjects
Subjects were recruited from patients seen at the neurol-
ogy clinics of the University Hospital Wales, Cardiff. The
main inclusion criteria for the subjects with neurological
deficits ('neurology patients') were that the individual: a)
had a condition causing lower limb weakness or perceived
weakness (usually bilaterally) diagnosed in one of the cat-
egories in table 1 by a specialist neurologist according to
their clinical assessment and b) able to stand and walk for
a short distance either independently or with crutches or
another type of walking aid. The categories of neurologi-
cal deficit (see Table 1) represented a spectrum of causes
of neurological muscle weakness based on the recognised
pathology of the diagnosed disorder.
A convenience sample of 32 healthy volunteers was
recruited from local volunteer, charity and social groups
to the study. This sample was sufficiently large enough to
allow for matching of case to control in each of the 5
groups according to gender, age, height and weight. The
main inclusion criteria for the healthy volunteers were
that they were resident in the local vicinity and had no
mobility restrictions or general health problems.
Recruited volunteers were involved in a representative
range of normal activities with none participating in elite
sports activities.
The study was approved by the Bro Taf local research eth-
ical committee. Subjects were required to provide
informed written consent. In total, 74 neurology subjects
who satisfied the inclusion criteria for the study were
recruited to the study. Demographic details of each group
are shown in Table 1.
Functional ability
As a general measure of self reported mobility the River-
mead (RMI) mobility index score [16] was evaluated (see
Table 1).
Journal of NeuroEngineering and Rehabilitation 2006, 3:26 />Page 3 of 8
(page number not for citation purposes)
Isometric strength
The strength of the right quadriceps and hamstrings mus-
cles were evaluated using a KINCOM dynamometer (KIN-
COM 125E plus; Chattecx Corporation, Oxfordshire, OX6
0JX, UK). The subject being tested was seated with hips
and knees flexed to 90°. The right leg was secured into an
instrumented cuff positioned at a point approximately
equi-distant between the knee and ankle joint (the
moment arm was recorded and used in processing of
strength data) with a stabilization strap across the thigh of
the leg being tested. A seat belt was used to secure the sub-
ject in the sitting position and prevent them from altering
the position during the data collection. The subjects were
asked not to hold onto the chair with their hands during
muscle contractions. They were required to initiate and
maintain a maximal voluntary contraction for 5 seconds
before relaxing. Verbal encouragement was given. The
maximum force produced over 4 isometric contraction
attempts was used for further analysis. A one minute rest-
ing period between each repetition of a muscle contrac-
tion was maintained.
The comparison between diagnostic groups (not matched
for age, gender and weight) necessitated the use of pre-
dicted muscle strengths. To incorporate the confounding
influence of gender, age, height and weight on muscle
strength values, the mean absolute quadriceps and ham-
string muscle strength in Newton metre (N.m) were
expressed as a percentage of the mean predicted muscle
strength in N.m. The predicted strength in kg was calcu-
lated using the National Isometric Muscle Strength Con-
sortium regression equations [17] (right knee extension =
(- (age * 0.38) + (sex * 18.44) + ((weight/height squared)
* 0.62) + 34.41) and right knee flexion = (- (age * 0.16) +
(sex * 8.78) + ((weight/height squared) * 0.08) + 22.47)).
Gender was assigned a value of 1 for male and 0 for
female. Thereafter, the predicted strength in kg was con-
verted to strength in N.m by multiplying by 9.81 and the
approximate moment arm for height according to pub-
lished anthropometric data [18]. The moment arm was
that of the distance between the knee and point of force
application at the ankle as used in normative data collec-
tion protocol for the determination of the regression
equations.
Sit-to-stand (STS)
Subjects were asked to stand up, without the use of their
arms for assistance if possible, from an armless, backless
height adjustable chair (RH Support Froli; RH Form, Lon-
don SW2 2AL, UK). The chair height was set to correspond
to 100% of knee joint height to the floor of subject. The
chair was placed on a force plate (Kistler 9253A12 Multi-
component force plate; Kistler Instruments Ltd, Hamp-
shire, GU34 2QJ, UK) whilst the subject's feet were placed
on a second force plate situated adjacent to the first plate.
Foot position was standardised to placement on this sec-
ond force plate in an area of 40 centimetres (width) by 40
centimetres (depth) with variation in medio-lateral and
anterior posterior placement of +/- 2.5 centimetres from
the centre of the force plate permitted. This variation was
necessary due to the nature of the included conditions;
some individuals were unable to perform the task of STS
without a marginal amount of flexibility in where they
placed their feet. This allowed for a truer representation of
the ways in which people with muscle weakness achieved
a standing position. During STS, kinematics were
Table 1: Specific categories along with the illustrative diagnoses, numbers in each group, mean age, gender and functional scores
represented by the Rivermead Mobility Index (RMI) for each category
Category Illustrative specific diagnoses Mean (SD) age in years; Gender:
male/female
Median (range) RMI Control mean (SD) age in years;
Gender: male/female
Primary muscle or
neuromuscular junction
disorder (n = 17)
Muscular dystrophy (n = 9)
Polymyositis (n = 5)
Myasthenic syndrome (n = 1)
Acid-maltase deficiency (n = 1)
Familial periodic paralysis (n = 1)
53.4 (12.4)
8 male, 9 female
12 (9 to 15) 51.7 (11.0)
8 male, 9 female (n = 17)
Peripheral nerve disorder with
sensory loss (n = 18)
Guillain Barré syndrome (n = 9)
Chronic inflammatory demyelinating
polyneuropathy or sensory/motor
neuropathy (n = 7)
Axonal sensory/motor polyneuropathy (n =
1)
Sensory peripheral polyneuropathy (n = 1)
56.7 (13.9)
7 male, 11 female
11.5 (4 to 15) 56.7 (11.0)
7 male, 11 female (n = 18)
Lower motor neuron (LMN)
disorder with no or minor
sensory loss (n = 12)
Motor neuropathy (n = 3)
Motor neuron disease (clinical LMN signs
only) (n = 3)
Spinal muscular atrophy (n = 5)
Lower motor neuron syndrome (n = 1)
52.9 (14.9)
10 male, 2 female
12 (4 to 15) 57.0 (13.5)
14 male; 9 female (n = 24)
Upper motor neuron lesions
(UMN) (n = 12)
Hereditary spastic paraplegia Motor neuron
disease with clinical UMN signs only (n = 1)
Pyramidal Adrenoleukodystrophy
(manifesting carrier) (n = 1)
51.6 (11.6)
7 male, 5 female
11.5 (7 to 14) 56.8 (14.5)
14 male; 9 female (n = 24)
Extra-pyramidal disorder (n =
15)
Parkinson's disease (PD) (n = 15) 64.3 (10.4)
11 male, 4 female
14 (9 to 15) 64.7 (9.5)
11 male, 4 female
Journal of NeuroEngineering and Rehabilitation 2006, 3:26 />Page 4 of 8
(page number not for citation purposes)
obtained in the sagittal plane using the VICON 512
motion analysis system with reflective markers placed on
the lower limbs of the subject being tested (VICON
Motion systems, Oxford, OX2 OJB, UK). The phases of
STS [33] were identified as follows; movement initiation
was determined as the point when the trunk first started
to lean forwards; the force plate under the chair was used
to identify seat off as the time when it was fully unloaded.
Kinetics during STS were calculated from the ground reac-
tion force obtained from Kistler force plates. An inverse
dynamic approach using a linked segment model of the
human body was used to calculate the net knee moment
during STS.
Determination of co-activation
Surface EMG (SEMG) at rest during the maximum isomet-
ric voluntary contractions (MVC) and during STS was
recorded at 1000 Hz (sampling frequency) for the quadri-
ceps and hamstring muscles using an 8 cable telemetry
system (Octopus; Bortec Electronics Inc., Alberta, Canada;
amplifier input impedance: 10 GOhm; frequency
response: 10–1000 Hz; common mode rejection ratio:
115 Db). Differential pre-amplifiers were used, which
allowed for early suppression of noise and movement arti-
fact in the raw signal [19,20]. Silver/silver chloride elec-
trodes with a conductive area of 10 mm2 (Kendall
Meditrace 230; Tyco Healthcare, Hampshire, UK) were
applied to the right quadriceps (Vastus Medialis, Vastis
Lateralis, Rectus Femoris) and hamstrings (Semi-Tendino-
sus, Biceps Femoris) of each subject according to the Sur-
face electromyography for the non-invasive assessment of
muscles (SENIAM) European recommendations for sur-
face electromyography [21]. The raw SEMG signal for each
muscle component was rectified and low pass filtered
(digital Butterworth filter: 2nd order, bi-directional zero
phase lag, 20 Hz cut-off frequency) to create a linear enve-
lope for further analysis using Matlab 6.5 software (The
MathWorks, Natick, MA). The SEMG signals were then
averaged to provide a representative signal for each mus-
cle group (quadriceps and hamstrings). The average
SEMG activity in a 50 ms. epoch, associated with the max-
imum isometric strength, was calculated at the point of
the maximal force achieved (incorporating a 50 ms. elec-
tromechanical delay representing the temporal delay
between muscle electrical activity and realization of
force). The same approach was used during STS to relate
EMG activity to the maximal knee moment.
The net knee moment was considered the resultant of the
agonist minus the antagonist (see Table 2, equation 1).
For the net MVC extension moment this was the Quadri-
ceps muscle moment minus the Hamstrings muscle
moment (equation 2). The net MVC flexion moment was
considered the Hamstring muscle moment minus the
Quadriceps muscle moment (equation 3). The estimated
Quadriceps muscle moment in both conditions was
assumed to be represented by an unknown constant (a)
multiplied by the EMG value for quadriceps (equation 4).
Equally, the Hamstring muscle moment was assumed to
be represented by an unknown constant (b) multiplied by
the EMG value for hamstrings (equation 5). Estimated
muscle moments were determined by solving for the con-
stants (a) and (b) using two equations (2 & 3 in combina-
tion with 4 & 5) (one for extension and one for flexion)
with two unknowns. The co-activation coefficient (equa-
tion 6) under isometric conditions was then calculated as
the estimated moment of antagonist divided by the esti-
mated moment of the agonist and multiplied by 100% to
produce the percentage co-activation as used by for
instance Ikeda et al. [5]. The estimated muscle moments
were used in this equation to account for the difference in
muscle mass. (Quadriceps femoris is approximately twice
the size of the hamstrings and therefore much stronger).
Since STS requires a net extensor moment at seat off, the
quadriceps was assumed to be the agonist and hamstrings
the antagonist during the calculation of co-activation dur-
ing STS [22,23]. The co-activation during STS was
obtained by applying the same constants (a & b) as
obtained during the isometric calculation of co-activation
at the point of the maximum net knee moment [5].
Statistical analysis
Each group was compared with a control group matched
on marginal distributions of means for age, height and
weight. Inferential testing was completed using The Statis-
tical Package for the Social Sciences (SPSS) version 11.
Normality and equal variances of the data was assessed to
Table 2: Equations used to calculate co-activation co-efficient
Net knee moment = moment (agonist) - moment (antagonist) (Eq. 1)
Extension knee moment = Quadriceps moment - Hamstrings moment (Eq. 2)
Flexion knee moment = Hamstrings moment - Quadriceps moment (Eq. 3)
Quadriceps muscle moment = constant (a) × Quadriceps EMG (Eq. 4)
Hamstrings muscle moment = constant (b) × Hamstring EMG (Eq. 5)
Co - activation 100%=
×
×
×
()
bHMSEMG
aQCSEMG
Eq .6
Journal of NeuroEngineering and Rehabilitation 2006, 3:26 />Page 5 of 8
(page number not for citation purposes)
allow for the appropriate choice of statistical test. Inde-
pendent t-tests and in cases where normality was not
shown, the non-parametric Mann Witney U test were used
to compare between the 2 unrelated groups. In order to
explore relations between co-activation and muscle
strength, correlations between variables for the pooled
healthy control subjects as well as the separate neurology
patient groups were explored using a two-tailed Pearson's
correlation co-efficient. Significance was established at
0.05 level.
Results
Functional ability
All patients tested in this study were able to walk 10
metres independently. RMI scores ranged from 4 to the
maximal possible 15 across the diagnostic groups (see
Table 1).
Isometric strength
All patient groups had weaker knee flexors and knee
extensors than matched healthy controls although this
did not reach significance in the PD and LMN (without
sensory loss) groups with respect to knee extension (see
Table 3). The degree of weakness varied both within and
between groups: for example patients with primary mus-
cle disease were the weakest overall (see Table 3). Muscle
strengths in the healthy control groups were close to the
values predicted for both the quadriceps and hamstrings
muscles equating to a mean (SD) absolute value of 152.3
(88.9) N.m for quadriceps and 82.2 (40.3) N.m for ham-
strings muscles respectively.
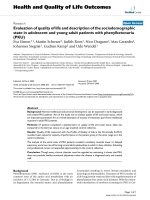
Co-activation
In healthy subjects mean (SD) co-activation of hamstrings
during isometric knee extension was 11.8 (6.2)% and dur-
ing STS was 20.5 (12.9)%: in neurology patient groups
mean values for co-activation during isometric knee
extension ranged from 7 to 17% (see Figure 1) and during
STS from 15 to 25%. Levels of co-activation did not differ
significantly between healthy and neurology groups either
during isometric knee extension or during STS with the
exception of the extra-pyramidal group who demon-
strated significantly lower levels of co-activation (isomet-
ric (p < 0.01) and STS (p < 0.05)) than their matched
healthy control group.
Relationship between muscle strength and co-activation
In healthy subjects there were no correlations between
isometric muscle strength and co-activation of hamstrings
during knee extension under either isometric or STS con-
ditions.
In neurology patients correlation analysis by diagnostic
group showed a significant negative correlation between
isometric quadriceps strength and co-activation of ham-
strings during isometric knee extension only in muscle
disease patients (r = -0.6; p < 0.05). A significant negative
correlation was also identified between isometric quadri-
ceps strength and co-activation during STS in the UMN
group (r = -0.7; p < 0.05) but not in any other group (see
Table 4).
Discussion
The present study aimed to investigate whether antagonist
co-activation was related to muscle weakness and whether
the degree of co-activation was different according to the
site of the causative neurological lesion. Uniquely, co-acti-
vation was evaluated during both isometric contractions
and a functional activity (sit-to-stand).
Although all patients tested were significantly weaker with
respect to knee extensors and/or flexors when compared
to an age, height and weight matched control group, there
were some systematic strength differences between neu-
rology diagnostic groups which potentially could be con-
founding factors in interpreting the findings of this study.
Table 3: Mean (SD) muscle strength and co-activation variables across all diagnostic groups (* p ≤ 0.05; ** p ≤ 0.01 when compared to
a matched control group)
Diagnostic groups Mean (SD) (95% CI difference)
predicted strength: quadriceps
(%)
Mean (SD) (95% CI mean
difference) predicted strength:
hamstrings (%)
Mean (SD) (95% CI mean
difference) isometric co-
activation (%)
Mean (SD) (95% CI mean
difference) co-activation during
STS (%)
Muscle disease (n = 17) 50.6 (30.1) **
36.9 to 88.7
55.9 (42.7) **
32.7 to 85.4
17.4 (15.2)
-1.2 to 15.1
22.3 (23.4)
-18.5 to 7.9
LMN (sensory loss) (n = 18) 87.4 (27.5)
-45.3 to 0.6
61.4 (22.4) **
31.4 to 66.2
7.3 (5.1)
-6.9 to 0.6
15.7 (11.0)
-14.2 to 1.5
LMN (sensory intact) (n = 12) 53.4 (38.0) **
21.5 to 78.3
55.6 (20.5) *
30.2 to 70.5
12.7 (10.9)
-5.3 to 9.2
16.3 (10.6) Δ
-12.8 to 6.5
UMN (n = 12) 67.2 (30.7) **
12.1 to 65.4
55.9 (33.5) **
19.4 to 67.1
9.4 (9.3)
-7.7 to 2.9
24.7 (16.5)
-7.5 to 13.6
Extra-pyramidal lesion (n = 15) 81.3 (36.4)
-48.8 to 11.6
65.7 (30.6) *
13.9 to 57.0
6.7 (4.3) **
-11.2 to -3.9
14.7 (13.3) *
-17.9 to 0.9
Control subjects (n = 32) 102.4 (37.0) 103.2 (30.1) 11.8 (6.2) 20.5 (12.9)
non-parametric comparisons between groups were used hence, it is only possible to present approximate confidence intervals
Δ based on the means of data from 8 subjects. 4 subjects in this group used hip and trunk flexion strategies to achieve STS thus preventing
calculation of co-activation at the point of the maximum knee extension moment.
Journal of NeuroEngineering and Rehabilitation 2006, 3:26 />Page 6 of 8
(page number not for citation purposes)
The range of functional abilities was similar across diag-
nostic groups. It is important to note that a pragmatic
approach of investigating the SEMG and isometric
strength data only from the right leg of each individual
was used. This was necessary as it was important that the
subjects were not encumbered by numerous SEMG telem-
etry cables and fatigued by a lengthy data collection proc-
ess requiring performance of functional activities that
were challenging for many of the subjects. We did how-
ever collect the strength data bilaterally; there was no indi-
cation of major asymmetry of strength between sides and
clinically there was no indication of a difference in diag-
nostic causation of weakness between right and left sides.
In healthy subjects, co-activation levels of hamstrings dur-
ing isometric knee extension and co-activation during STS
were similar to those previously reported. Co-activation
during isometric quadriceps contraction has been found
to range from 10.7 to 14.7% in 20 healthy sedentary
males (mean (SD) age 22.1 (0.9))[24]. In 12 healthy con-
trol subjects (aged 25–59), antagonist hamstrings activity
during a maximal isometric contraction of the quadriceps
muscle was approximately 13% (+/- 5.8) [10]. During
functional tasks such as standing up from a chair as well
as sitting down and walking up and down stairs, ham-
strings co-activation levels have previously been found to
range from 17% to 25% [25].
Table 4: Relationships between isometric quadriceps muscle strength and co-activation identified using Pearson's correlation co-
efficients (r) for each group (* p ≤ 0.05; ** p ≤ 0.01)
Diagnostic group Extra-pyramidal UMN lesions LMN (sensory intact) LMN (sensory loss) Muscle disease
Isometric co-activation r = -0.09 r = -0.3 r = -0.4 r = -0.1 r = -0.7 **
Co-activation during STS r = -0.06 r = -0.7 * r = 0.06 r = 0.4 r = -0.4
Isometric comparative mean hamstrings co-activation during quadriceps agonist activity across the included diagnostic groups (mean control group isometric co-activation was approximately 11%; represented by solid black line) (* p ≤ 0.05; ** p ≤ 0.01 when compared to a matched control group)Figure 1
Isometric comparative mean hamstrings co-activation during quadriceps agonist activity across the included diagnostic groups
(mean control group isometric co-activation was approximately 11%; represented by solid black line) (* p ≤ 0.05; ** p ≤ 0.01
when compared to a matched control group)
Journal of NeuroEngineering and Rehabilitation 2006, 3:26 />Page 7 of 8
(page number not for citation purposes)
In the patients tested in this study, co-activation levels
across neurology groups were variable but comparable
and mostly not different to that seen in healthy subjects
(co-activation ranged from 7 to 17% during isometric
knee extension and 15 to 25% during STS). This is similar
to what has been seen in the literature, for example co-
activation in stroke patients during an isometric quadri-
ceps maximal contraction was found to be 14.2% (+/- 7.3)
[10] and 12.2% (+/- 14.4%) during knee extension in
children with cerebral palsy [5].
Interestingly, neither the presence of an "upper motor
neuron" syndrome nor the presence of sensory impair-
ment alongside weakness appeared to systematically
result in increased co-activation above levels seen in
healthy subjects. A range of studies have assessed co-acti-
vation in people with stroke, PD, spinal cord injury and in
children with cerebral palsy [26-28]. We are not aware of
studies which have measured levels of co-activation in a
wide range of diagnostic categories or in individuals with
peripherally mediated weakness or sensory impairment.
Comparisons with healthy subjects are also not readily
apparent. Of potential relevance to these findings is the
large variation within each subject group for the co-activa-
tion measures. Differences may not have been detected
due to insufficient observed statistical power. Observed
effect sizes (ranging from 0.24 to 0.96 for each group and
their matched control group) were substantially lower
than that used for the initial power calculations. Further
investigation would be required using larger numbers of
participants to confirm or refute these non-significant
findings.
Unexpectedly, Parkinson's disease (PD) patients demon-
strated significantly lower co-activation levels (both iso-
metric and during STS) when compared to a matched
healthy control group. Patients with PD experience diffi-
culty in initiation of movements that has been attributed
to bradykinesia, muscle weakness and excessive co-activa-
tion as well as the clinical feature of limb rigidity [23,29].
Rigidity gives rise to muscular stiffness with clinical hyper-
tonicity in agonist and antagonist muscle groups on pas-
sive movement [30] suggesting intuitively that higher
levels of co-activation might be anticipated. Selective
weakness did not explain these lower levels of co-activa-
tion since the level of force produced during the isometric
hamstring test (agonist) was well above that generated
during co-activation (antagonist) activity. It is possible
that the reduced co-activation identified is linked with the
benefits of the medication used to treat PD, however this
study was not specifically designed to investigate medi-
cated versus non-medicated patients as all subjects were
tested in the 'on phase' of medication. This may be worthy
of sequential study within individuals on and off medica-
tion.
Overall there was some evidence for a link between
increasing weakness and increasing level of co-activation
in muscle disease patients during isometric knee exten-
sion and in patients with UMN lesions during STS. Co-
activation could critically contribute to a reduction of net
agonist force output in such disorders and in UMN lesions
muscle activation during weight bearing might be influ-
enced by altered stretch reflex sensitivity. However the
data requires independent confirmation as conceivably
altered kinematics of STS and/or the range of compensa-
tory strategies used by neurology patients could have
influenced the data. Exploration of relationships between
co-activation, kinematic and kinetic characteristics of STS
did not however reveal any significant correlations.
Patients who were very weak and/or unable to walk the
required distance and hence complete the testing protocol
were excluded from this study and so the lowest end of the
muscle strength spectrum is not represented. Further
exploration across a range of diagnostic groups with spe-
cific reference to very weak individuals or serial investiga-
tions of patients recovering from severe weakness (e.g.
Guillain-Barré syndrome) may be of interest in consider-
ing whether co-activation critically limits net agonist
activity and joint movement.
In conclusion, co-activation levels did not appear to vary
systematically between diagnostic neurology groups when
compared to healthy subjects with the possible exception
of extra-pyramidal disorder where co-activation tended to
be lower both during isometric and STS conditions. Sec-
ondly, co-activation did not systematically vary according
to muscle strength in healthy subjects or in neurology
patient groups during two activities (isometric knee exten-
sion and STS) except in muscle disease (isometric) and
UMN lesions (STS) where there was an indication of
increasing co-activation with increasing weakness.
The study demonstrates approximately 10% co-activation
of hamstrings during knee extension in both healthy indi-
viduals and in neurology patients during isometric quad-
riceps contractions and 20% during STS which overall
remains fairly stable in the presence of neurological dis-
ease. We suggest that co-activation should be taken into
account in evaluating net agonist strength and potentially
may be an element which can be manipulated therapeuti-
cally to improve function. Within-patient serial studies in
the presence of changing muscle strength may help to
understand the role of co-activation more clearly.
Competing interests
The author(s) declare that they have no competing inter-
ests.
Publish with BioMed Central and every
scientist can read your work free of charge
"BioMed Central will be the most significant development for
disseminating the results of biomedical research in our lifetime."
Sir Paul Nurse, Cancer Research UK
Your research papers will be:
available free of charge to the entire biomedical community
peer reviewed and published immediately upon acceptance
cited in PubMed and archived on PubMed Central
yours — you keep the copyright
Submit your manuscript here:
/>BioMedcentral
Journal of NeuroEngineering and Rehabilitation 2006, 3:26 />Page 8 of 8
(page number not for citation purposes)
Authors' contributions
RVD and CMW conceived of the study, and participated in
its design and coordination and helped to draft the man-
uscript. MB participated in the design, recruitment of sub-
jects, acquisition of data, analysis and interpretation of
data; all authors read and approved the final manuscript.
Acknowledgements
This study was funded by the Wales Office for Research and Development
(DTA 00_2_008). The authors of this study would like to acknowledge the
staff in the Department of Neurology, University Hospital of Wales and
Rookwood Hospital as well as the Research Centre for Clinical Kinaesiol-
ogy, Schools of Healthcare Studies and Medicine, Cardiff. The assistance of
healthy subjects and neurological patients is also gratefully acknowledged.
References
1. Saguil A: Evaluation of the patient with muscle weakness. Am
Fam Physician 2005, 71:1327-1336.
2. Doorenbosch CA, Harlaar J, Roebroeck ME, Lankhorst GJ: Two
strategies of transferring from sit-to-stand; the activation of
monoarticular and biarticular muscles. J Biomech 1994,
27:1299-1307.
3. Van Ingen Schenau GJ, Boots PJ, de Groot G, Snackers RJ, van Woen-
sel WW: The constrained control of force and position in
multi-joint movements. Neuroscience 1992, 46:197-207.
4. Damiano DL: Reviewing muscle cocontraction:Is it a develop-
mental, pathological or motor control issue. Physical and Occu-
pational Therapy in Pediatrics 1993, 12:3-20.
5. Ikeda AJ, Abel MF, Granata KP, Damiano DL: Quantification of
cocontraction in spastic cerebral palsy. Electromyogr Clin Neuro-
physiol 1998, 38:497-504.
6. Carolan B, Cafarelli E: Adaptations in coactivation after isomet-
ric resistance training. J Appl Physiol 1992, 73:911-917.
7. Aagaard P, Simonsen EB, Andersen JL, Magnusson SP, Bojsen-Moller
F, Dyhre-Poulsen P: Antagonist muscle coactivation during iso-
kinetic knee extension. Scandinavian Journal of Medicine & Science
in Sports 2000, 10:58-67.
8. Miller JP, Croce RV, Hutchins R: Reciprocal coactivation pat-
terns of the medial and lateral quadriceps and hamstrings
during slow, medium and high speed isokinetic movements.
Journal of Electromyography and Kinesiology 2000, 10:233-239.
9. Draganich LF, Jaeger RJ, Kralj AR: Coactivation of the hamstrings
and quadriceps during extension of the knee. J Bone Joint Surg
Am 1989, 71:1075-1081.
10. Davies JM, Mayston MJ, Newham DJ: Electrical and mechanical
output of the knee muscles during isometric and isokinetic
activity in stroke and healthy adults. Disabil Rehabil 1996,
18:83-90.
11. Chimera NJ, Swanik KA, Swanik CB, Straub SJ: Effects of plyomet-
ric training on muscle-activation strategies and performance
in female athletes.
Journal of Athletic Training 2004, 39:24-31.
12. Falconer K, Winter DA: Quantitative assessment of co-contrac-
tion at the ankle joint in walking. Electromyogr Clin Neurophysiol
1985, 25:135-149.
13. Busse ME, Wiles CM, van Deursen RWM: Muscle co-activation in
neurological conditions. Physical Therapy Reviews 2005,
10:243-257.
14. Dupont WD, Plummer WD Jr.: Power and sample size calcula-
tions. A review and computer program. Control Clin Trials 1990,
11:116-128.
15. Gail M, Williams R, Byar DP, Brown C: How many controls? J
Chronic Dis 1976, 29:723-731.
16. Collen FM, Wade DT, Robb GF, Bradshaw CM: The Rivermead
Mobility Index: a further development of the Rivermead
Motor Assessment. Int Disabil Stud 1991, 13:50-54.
17. The National Isometric Muscle Strength (NIMS) Database Consor-
tium: Muscular weakness assessment: use of normal isomet-
ric strength data. Arch Phys Med Rehabil 1996, 77:1251-1255.
18. Winter DA: Anthropometry. In Biomechanics and motor control of
human movement Volume 3. Second edition. New York, John Wiley
and Sons Inc.; 1990:51-73.
19. Winter DA: Biomechanics and Motor Control of Human
Movement. 2nd edition. New York, John Wiley and Sons Inc.;
1990:191-206.
20. Merletti R, Wallinga W, Hermens H, Freriks B: Guidelines for
reporting SEMG data. Roessingh Research and Development;
1999:101-105.
21. Freriks B, Hermens H, Disselhorst-Klug C, Rau G: The recommen-
dations for sensors and sensor placement procedures for
surface electromyography. Volume 8. Roessingh Research and
Development; 1999:101-105.
22. Gross MM, Stevenson PJ, Charette SL, Pyka G, Marcus R: Effect of
muscle strength and movement speed on the biomechanics
of rising from a chair in healthy elderly and young women.
Gait Posture 1998, 8:175-185.
23. Mak MK, Levin O, Mizrahi J, Hui-Chan CW: Joint torques during
sit-to-stand in healthy subjects and people with Parkinson's
disease.
Clin Biomech 2003, 18:197-206.
24. Baratta R, Solomonow M, Zhou BH, Letson D, Chuinard R, D'Ambro-
sia R: Muscular coactivation. The role of the antagonist mus-
culature in maintaining knee stability. Am J Sports Med 1988,
16:113-122.
25. Kellis E: Quantification of quadriceps and hamstring antago-
nist activity. Sports Med 1998, 25:37-62.
26. Corcos DM, Chen CM, Quinn NP, McAuley J, Rothwell JC: Strength
in Parkinson's disease: relationship to rate of force genera-
tion and clinical status. Ann Neurol 1996, 39:79-88.
27. Damiano DL, Martellotta TL, Sullivan DJ, Granata KP, Abel MF: Mus-
cle force production and functional performance in spastic
cerebral palsy: relationship of cocontraction. Arch Phys Med
Rehabil 2000, 81:895-900.
28. Thomas CK, Tucker ME, Bigland-Ritchie B: Voluntary muscle
weakness and co-activation after chronic cervical spinal cord
injury. J Neurotrauma 1998, 15:149-161.
29. Ramsey VK, Miszko TA, Horvat M: Muscle activation and force
production in Parkinson's patients during sit to stand trans-
fers. Clin Biomech 2004, 19:377-384.
30. Glendinning DS, Enoka RM: Motor unit behavior in Parkinson's
disease. Phys Ther 1994, 74:61-70.