báo cáo hóa học: " The Locomotor Capabilities Index; validity and reliability of the Swedish version in adults with lower limb amputation" ppt
Bạn đang xem bản rút gọn của tài liệu. Xem và tải ngay bản đầy đủ của tài liệu tại đây (255.95 KB, 9 trang )
BioMed Central
Page 1 of 9
(page number not for citation purposes)
Health and Quality of Life Outcomes
Open Access
Research
The Locomotor Capabilities Index; validity and reliability of the
Swedish version in adults with lower limb amputation
Brita Larsson
†1
, Anton Johannesson*
†2
, Ingemar H Andersson
3
and
Isam Atroshi
4,5
Address:
1
Department of Rehabilitation Medicine, Hässleholm Hospital, SE-28125 Hässleholm, Sweden,
2
Department of Clinical Sciences, Lund
University, Lund, Sweden, Ortopedteknik AB, Kristianstad Hospital, Kristianstad, Sweden,
3
Department of Health and Society, Kristianstad
University, Kristianstad, Sweden,
4
Department of Clinical Sciences, Lund University, Lund, Sweden and
5
Department of Orthopedics, Hässleholm
and Kristianstad Hospitals, Hässleholm, Sweden
Email: Brita Larsson - ; Anton Johannesson* - ;
Ingemar H Andersson - ; Isam Atroshi -
* Corresponding author †Equal contributors
Abstract
Background: The Locomotor Capabilities Index (LCI) is a validated measure of lower-limb
amputees' ability to perform activities with prosthesis. We have developed the LCI Swedish version
and evaluated its validity and reliability.
Methods: Cross-cultural adaptation to Swedish included forward/backward translations and field
testing. The Swedish LCI was then administered to 144 amputees (55 women), mean age 74 (40–
93) years, attending post-rehabilitation prosthetic training. Construct validity was assessed by
examining the relationship between the LCI and Timed "Up-and-Go" (TUG) test and between the
LCI and EQ-5D health utility index in 2 subgroups of 40 and 20 amputees, respectively.
Discriminative validity was assessed by comparing scores in different age groups and in unilateral
and bilateral amputees. Test-retest reliability (1–2 weeks) was evaluated in 20 amputees (14
unilateral).
Results: The Swedish LCI showed good construct convergent validity, with high correlation with
the TUG (r = -0.75) and the EQ-5D (r = 0.84), and discriminative validity, with significantly worse
mean scores for older than younger and for bilateral than unilateral amputees (p < 0.01), and high
internal consistency (Cronbach alpha 0.95). In test-retest reliability the intraclass correlation
coefficient was 0.91 (95% CI 0.79–0.96) but for the unilateral amputees was 0.83 (95% CI 0.56–
0.94). Ceiling effect occurred in 23%.
Conclusion: The Swedish version of the LCI demonstrated good validity and internal consistency
in adult amputees. Test-retest reliability in a small subsample appears to be acceptable. The high
ceiling effect of the LCI may imply that it would be most useful in assessing amputees with low to
moderate functional abilities.
Published: 23 May 2009
Health and Quality of Life Outcomes 2009, 7:44 doi:10.1186/1477-7525-7-44
Received: 9 April 2008
Accepted: 23 May 2009
This article is available from: />© 2009 Larsson et al; licensee BioMed Central Ltd.
This is an Open Access article distributed under the terms of the Creative Commons Attribution License ( />),
which permits unrestricted use, distribution, and reproduction in any medium, provided the original work is properly cited.
Health and Quality of Life Outcomes 2009, 7:44 />Page 2 of 9
(page number not for citation purposes)
Background
Patients with severe peripheral arterial disease or diabetes
may require lower limb amputation and in Scandinavia
these conditions account for more than 90% of all lower
limb amputations [1]. The annual incidence of above-foot
amputation ranges from 20 to 46 per 100,000 inhabitants
[2,3]. In patients with lower limb amputation the primary
aim of rehabilitation is to restore walking ability with
prosthesis. Not all patients can receive prosthesis after
amputation. The reported rate of prosthetic use following
lower limb amputation related to peripheral arterial dis-
ease or diabetes has varied from 32% to 43% [4-6]. In
addition, amputees successfully fitted with a prosthesis
may differ in how much they use the prosthesis and in the
type of activities they can perform with their prosthesis
[7].
Walking ability with a prosthesis depends on several fac-
tors including patient's physical and mental status [8], the
surgical method used [9], postoperative care, nutrition
and pain relief [10] as well as the rehabilitation and pros-
thetic fitting procedures [6]. Lower limb amputation
related to peripheral arterial disease or diabetes is usually
performed on elderly patients who have multiple medical
disorders, and the rehabilitation may be compromised by
other illnesses such as stroke and heart failure or vascular
problems involving the contralateral leg. An instrument
that measures walking ability following amputation can
therefore be used to trace changes in function related to
comorbidity, treatment or rehabilitation.
The Locomotor Capabilities Index (LCI) is a 14-item ques-
tionnaire specifically designed to measure walking ability
of lower-limb amputees. The LCI was developed in Can-
ada in 1993 as part of the Prosthetic Profile of the
Amputee questionnaire [11,12]. According to its develop-
ers the LCI "computes the global, basic, and advanced
locomotor skills of the lower limb amputee with the pros-
thesis and assesses level of independence" [13]. The LCI
has demonstrated good validity and reliability in adults
with lower limb amputation and it has been found espe-
cially useful in daily clinical practices. It has been trans-
lated to several European languages and used in
international studies [13]. Despite the relatively high inci-
dence of above-foot amputations related to peripheral
arterial disease or diabetes in Sweden [6], resulting in
many prosthetic users, no valid and reliable measure of
lower limb amputees' physical function with the prosthe-
sis has been available in Swedish.
The purpose of this study was to perform a cross-cultural
adaptation of the LCI to Swedish and evaluate the Swed-
ish version for validity (convergent and discriminative)
and reliability in lower limb amputees attending training
after discharge from the hospital rehabilitation unit.
Methods
Procedure of translation
The procedure of cross-cultural adaptation of the English
version of the LCI to Swedish was done in three steps [14].
First, the English version was translated to Swedish (for-
ward translation) by 3 translators whose first language
was Swedish, with one having no medical background.
Based on consensus meeting a final version was created.
In the second step, two bilingual persons whose first lan-
guage was English independently re-translated the Swed-
ish version into English (backward translation). Both
were blinded to the concepts being investigated and one
had no medical background. Finally, the translations were
reviewed by a group consisting of 2 forward-translators, 1
backward-translator and one supervisor and discrepancies
were resolved to achieve conceptual equivalence with the
original version.
A pre-final version was created and tested on a reference
group of 10 amputees attending training in a special after-
rehabilitation training unit for amputees. The pre-final
version performed well in the field-testing. However, the
reference group suggested that a second version be created
with lines between the questions for better readability as
many amputees suffer from poor vision because of high
age and/or diabetes. A final Swedish version of the LCI
was then created (Additional file 1). The data from the
field-testing were not used further in the analysis.
Validation study
The Swedish version was assessed for validity (convergent
and discriminative) and reliability (internal consistency
and test-retest reliability) in a cross-sectional study con-
ducted on a population of lower limb amputees attending
training after discharge from the hospital rehabilitation
unit with retest follow-up of a small subsample of the par-
ticipants.
Participants
Participants from our rehabilitation unit (Hässleholm-
Kristianstad Hospitals) as well as from three other rehabil-
itation units in Sweden (one in Gothenburg, and two in
Stockholm) were recruited for this study. The aim of these
training units that are usually located in larger hospitals in
Sweden is to help amputees who had undergone rehabil-
itation with prosthesis to maintain their mobility level.
The training program is offered to amputees after the con-
clusion of routine prosthetic rehabilitation and participa-
tion is voluntary.
The inclusion criteria for this study were age 40 years or
older, lower limb amputation up to trans-femoral level,
and that the amputee was fitted with a prosthesis. Data
from all four rehabilitation units included gender, age,
and amputation level, and data for the amputees from
Health and Quality of Life Outcomes 2009, 7:44 />Page 3 of 9
(page number not for citation purposes)
Hässleholm-Kristianstad also included date of amputa-
tion and of receiving the prosthesis. One hundred and
fifty five amputees fulfilled the inclusion criteria (67 from
Hässleholm-Kristianstad, 71 from Gothenburg, and 17
from Stockholm), of whom 11 were excluded because of
incomplete data (Figure 1). The participants were repre-
sentative of the amputee population in Sweden with the
most common cause of amputation being peripheral arte-
rial disease with or without diabetes and less commonly
infection or fracture [6].
The data were collected from September 2003 through
December 2007. The study population consisted of 144
amputees; 55 women, mean age 75 (range 40–93) years,
and 89 men, mean age 73 (range 44–91) years (Table 1).
All participants from Hässleholm/Kristianstad were
informed of the aim of the study and gave their written
consent. Data from the other rehabilitation units con-
tained no personal identifying information. The study was
approved by the Local Ethics Committee.
Questionnaires and mobility test
Locomotor Capabilities Index
The LCI consists of 14 items that measure one general
construct, the locomotor capabilities with the prosthesis.
Two subscales emerge from this general construct; basic
abilities (7 items) and advanced abilities (7 items). The
items inquire about the ability to perform activities and
the level of independence while performing these activi-
ties. Each of the 14 items is graded on a 4-point ordinal
scale; 0 (not able to), 1 (yes, with help from other person),
2 (yes, with supervision) and 3 (yes, independently). The
total LCI score is the sum of the item scores and can range
from 0 (worst) to 42 (best). Similarly, subscale scores for
basic and advanced capabilities with the prosthesis can
range from 0 to 21. The LCI is intended for self-adminis-
tration but can also be administered in a face-to-face or
telephone interview. The time needed to complete the LCI
is approximately five minutes [11,12].
EQ-5D
The EQ-5D is a measure of health-related quality of life
composed of 5 items covering 5 dimensions (mobility,
self-care, usual activities, pain/discomfort, and anxiety/
depression). Each item has 3 response levels: 1 (no prob-
lem), 2 (some problems), and 3 (unable to do for the first
3 items, or severe problems for the last 2 items). The pref-
erence weights for the EQ-5D index have been generated
previously in the United Kingdom from a random general
population sample using the time trade-off method of
health evaluation [15]. The EQ-5D index ranges from 1.0
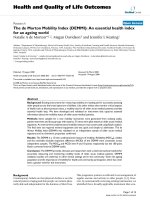
Flow diagram of the participants in the validity and reliability analysesFigure 1
Flow diagram of the participants in the validity and reliability analyses.
* If an amputee completed the LCI on more than one occasion data from the first occasion were used
in the analysis of internal consistency and discriminative validity
155 amputees attending after-rehabilitation training
Hässleholm/Kristianstad (HLM/KSD) 67
Gothenburg (GBG) 71
Stockholm (SHM) 17
11 excluded (incomplete data)
HLM/KSD 3, GBG 6, SHM 2
20 amputees*
x Convergent validity II (EQ-5D)
x Test-retest reliability
144 amputees
x Internal consistency
x Discriminative validity I (age groups)
21 non trans-
tibial amputees
excluded
123 trans-tibial amputees 40 amputees*
Discriminative validity II Convergent validity I (TUG)
(unilateral vs.
bilateral)
Health and Quality of Life Outcomes 2009, 7:44 />Page 4 of 9
(page number not for citation purposes)
(no problem with any of the 5 dimensions), to -0.594
(extreme problems with all 5 dimensions). In this study
the Swedish version of the EQ-5D was used. The EQ-5D is
widely used, has shown to be reliable and valid in the
Swedish general population, and is easy to complete [16].
Timed "Up-and-Go" Test
In the Timed "Up-and-Go" (TUG) test the participant is
asked to, as fast as possible, rise from a chair, walk three
meters with his/her ordinary walking aid, turn around,
walk back and sit down again in the chair and the result is
measured in seconds. The TUG test is easy to use in clini-
cal settings and it has been shown to be valid and reliable
in testing of function in an elderly population [17].
Evaluation of validity
We examined the completeness of item responses, the dis-
tribution of the scores, and the extent of ceiling and floor
effects in the results from all 144 participants. We assessed
construct validity of the LCI by testing a number of prede-
fined hypotheses regarding its relationship with other
measures of function and health (convergent validity) and
its ability to discriminate among groups expected to differ
in locomotor capabilities (discriminative validity) [18].
The number of participants included in the different anal-
yses is shown in Figure 1.
Convergent validity [19] was determined by comparing
the LCI results with the TUG test and EQ-5D results in 2
subgroups of amputees. We hypothesized that better LCI
scores would have moderate or strong correlation (> 0.5)
[20] with better TUG values, and that the LCI would cor-
relate at least moderately with the EQ-5D index in a posi-
tive direction (i.e., better function with the prosthesis
would correlate with better EQ-5D index). The correlation
between the LCI scores and the TUG test results and the
EQ-5D scores were calculated with the Spearman correla-
tion coefficient (r). A correlation coefficient of at least 0.7
has been proposed as a standard for correlation in validity
studies [21].
Discriminative validity was evaluated by comparing the
LCI scores among amputees in different age groups and in
unilateral and bilateral amputees. We hypothesized that
younger amputees would have better LCI scores than
older amputees and that unilateral trans-tibial amputees
would have better scores than bilateral trans-tibial
amputees. We also analyzed the LCI with regard to
whether the scores would differ significantly according to
gender as one previous study reported better scores
among men than among women [22]. For comparison of
LCI scores among amputees in different age groups and in
men and women data from all 144 amputees were ana-
lyzed with Kruskal-Wallis test and the Mann-Whitney test,
respectively. For comparing LCI scores in unilateral and
bilateral trans-tibial amputees, data from 123 amputees
were analyzed with the Mann-Whitney test.
Evaluation of reliability
Internal consistency
Internal consistency measures the homogeneity in a scale
and the items should be at least moderately correlated
with each other. Internal consistency was determined
using Cronbach alpha coefficient and the 95% confidence
intervals (CI) were calculated using the bootstrap method.
Values between 0.70 and 0.95 have been proposed to
indicate good internal consistency [21]. Internal consist-
ency reliability of the LCI was assessed using the responses
from all 144 participants.
Test-retest reliability
Test-retest reliability was evaluated in the same subgroup
of 20 amputees that provided data for the validity analysis
using the EQ-5D. The participants completed the LCI on
two occasions with a mean interval of 11 (range 7–14)
days. The test-retest LCI scores were analyzed with the
Table 1: Characteristic of the study population
Discriminative validity I
&
Internal consistency
Discriminative validity II Convergent validity I Convergent validity II
&
Test-retest reliability
Number of amputees 144 123 40 20
Age, mean (range) yrs 74 (40–93) 74 (40–93) 74 (41–89) 76 (41–91)
Women, n (%) 55 (38) 50 (41) 15 (38) 10 (50)
Unilateral amputees, n (%)
TT 110 (76) 110 (89) 40 (100) 13 (65)
TF/KD 18 (13) 0 0 1 (5)
Bilateral amputees, n (%)
TT + TT/AD 14 (9.7) 13 (11) 5 (25)
TT + TF/KD 2 (1.3) 0 1 (5)
Time from prosthetic fitting to LCI testing,
mean (range) wks
38 (3–418)
†
38 (3–418)
†
20 (3–135) 91 (4–231)
†
Data for 64 amputees from Hässleholm-Kristianstad (not available for amputees from the other 3 centers)
TF, trans-femoral; KD, knee disarticulation; TT, trans-tibial; AD, ankle disarticulation
Health and Quality of Life Outcomes 2009, 7:44 />Page 5 of 9
(page number not for citation purposes)
intraclass correlation coefficient (ICC) using the two-way
random and absolute agreement criteria. The ICC (1,1)
and 95% CI were calculated for the total LCI as well as for
the basic and advanced subscales for the unilateral and
bilateral amputees. For the ICC (range 0 to 1) a value of
0.70 has been considered as acceptable reliability [19].
Ceiling and floor effects
Reliability and validity of an instrument may be influ-
enced by the presence of high ceiling and/or floor effects.
A ceiling or floor effect is considered present if more than
15% of the respondents achieved the highest or lowest
possible score [21,23].
Statistical analysis
The LCI scores (total, basic and advanced) were calculated
and presented as means, medians and standard devia-
tions. All statistical tests were 2-sided and a p-value of
0.05 was considered to indicate statistical significance.
Data were analyzed with SPSS version 14.0 (SPSS Inc.,
Chicago, USA) and STATA 10.0 (StataCorp, College Sta-
tion, Texas, USA).
Results
Score distribution
All the 144 participants answered all items. Basic item 1
"rising from a chair" and item 2 "walk indoors" had the
highest mean scores (2.9 and 2.7 respectively) and the
worst scores were registered for advanced items 5 and 6
"getting up and down a stair without a handrail", both
scoring a mean of 1.2 (Table 2).
The mean total score was 28.5 (SD 12.5, median 33), the
mean basic score was 17.1 (SD 5.5, median 21) and the
mean advanced score 11.3 (SD 7.8, median 12).
Convergent validity
In the subgroup that performed the TUG test, the mean
LCI was 29.6 (range 2–42) and the mean TUG result was
34.2 (range 9–92) seconds. The correlation between the
LCI and the TUG was strong (r = -0.75, 95% CI -0.89–
0.56, p < 0.001). The mean EQ-5D index was 0.63 (SD
0.3; range -0.18–1.0). The correlation between the LCI
and EQ-5D index was strong (r = 0.84, 95% CI 0.58–0.95,
p < 0.001).
Discriminative validity
The mean LCI score for the amputees in younger age
groups was significantly better than that for amputees in
older age groups (Table 3). The mean LCI score for unilat-
eral amputees was 32.5 (SD 9.7) and for bilateral
amputees was 14.9 (SD 12.5) (p < 0.001). The mean total
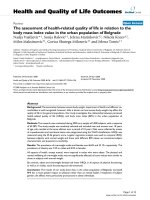
score for women was 27.2 (SD 11.8, median 30) and for
men 29.2 (SD 12.9, median 33), the difference was not
statistically significant (p = 0.2), but LCI scores of 36 or
higher were more common among men than women (39
men compared to 16 women) (Figure 2).
Internal consistency
Internal consistency was high; Cronbach alpha for the
total LCI was 0.95 (95% CI 0.94–0.96), for basic activities
was 0.93 (95% CI 0.91–0.95), and for advanced activities
was 0.94 (95% CI 0.92–0.95). The item-total correlations
ranged from 0.42 (item basic 1) to 0.85 (item advanced 3)
Table 2: The locomotor capabilities index (LCI) item scores (n = 144)
%%
Items* Mean (SD) Median Highest score Lowest score
Basic activities
1. Get up from a chair 2.9 (0.5) 3 91 0.7
2. Walk indoors 2.7 (0.6) 3 82 1.4
3. Walk outside 2.3 (1.1) 3 63 13
4. Go up stairs, handrail 2.4 (0.9) 3 65 9.0
5. Go down stairs 2.4 (0.9) 3 65 9.0
6. Step up sidewalk curb 2.2 (1.1) 3 63 16
7. Step down sidewalk curb 2.2 (1.1) 3 63 16
LCI – Basic 17.1 (5.5) 21 54 0.7
Advanced activities
1. Pick up object from floor 2.0 (1.3) 3 63 26
2. Get up from floor 1.6 (1.3) 1 42 26
3. Walk outside 1.8 (1.3) 2 44 26
4. Outside in bad weather 1.6 (1.3) 2 42 35
5. Go up stairs without handrail 1.2 (1.2) 1 26 40
6. Go down stairs without handrail 1.2 (1.2) 1 26 40
7. Walk while carrying an object 1.7 (1.4) 3 51 38
LCI – Advanced 11.3 (7.8) 12 23 12
LCI – Total 28.5 (12.5) 33 23 0.7
*Each item has 4 score levels ranging from 0 (worst) to 3 (best); each LCI score (basic, advanced and total) is the sum of item scores
Health and Quality of Life Outcomes 2009, 7:44 />Page 6 of 9
(page number not for citation purposes)
Test-retest reliability
In the whole test-retest sample, the ICC for the total LCI
was 0.91, for basic LCI was 0.88, and for advanced LCI
was 0.92, and all 95% confidence intervals were above
0.70 (Table 4). The mean difference in the LCI scores
between the two testing times was -1.6 for the total LCI
and -0.8 for the basic and advanced LCI (all differences
were statistically non-significant). Among the 14 unilat-
eral amputees the ICC for the total LCI was 0.83, for the
basic LCI was 0.66 and for the advanced was 0.92 (Table
4). For the 6 bilateral amputees the ICC for the total LCI
was 0.90, for the basic 0.93 and for the advanced 0.59 and
the mean score difference between the two testing times
was -0.3, 0, and -0.3, respectively.
Ceiling and floor effects
Of the 144 participants, 43 amputees had scores of 40 or
higher and 33 (23%) had a maximum possible score (ceil-
ing effect). High scores were more common among men
than women. Only 1 amputee (0.7%) had a worst possi-
ble score and 12 had scores below 8 (Table 2).
Discussion
This study shows that the Swedish version of the LCI has
good validity. The predefined validity hypotheses were
confirmed with good ability to discriminate among
groups expected to differ in their locomotor capabilities
and high correlations between the LCI and the TUG test
and between the LCI and the EQ-5D. The reliability tests
showed good internal consistency and the test-retest reli-
ability in a small subsample was acceptable.
The measurement properties of the Swedish LCI are simi-
lar to those reported for the original English version.
Assessment of validity of the original English version of
the LCI [13] showed a significant correlation with the
Functional Independence Measurement (FIM) test (Spear-
man correlation coefficient 0.62) and with the Rivermead
Mobility Index (Spearman coefficient 0.75), which is sim-
ilar to the correlation shown with the TUG test in our
study, and assessment of reliability showed high internal
consistency (Cronbach Alpha 0.95 for the total LCI and
exceeding 0.90 for both subscales) and a high test-retest
agreement (ICC = 0.80), which also is similar to the relia-
bility results in our study. However, a very high Cronbach
alpha may indicate possible item redundancy.
In our study, the mean LCI score was 28.5 in a population
of 144 amputees with a mean age of 74 years. In a report
from the developers of the LCI, a younger population
(mean age 63 years) of 211 trans-tibial and 122 trans-fem-
oral amputees had a mean LCI of 31.6 and 29.2, respec-
tively [24]. Franchignoni et al. reported a mean LCI of 41
at the end of a rehabilitation program among 50 unilat-
eral amputees with a median age of 51 years [25]. When
comparing the LCI results in different studies the charac-
teristics of the study populations should be taken into
consideration. The LCI items that scored highest in our
study were "getting up from a chair" and "walking
indoors" and the lowest score was found for the item con-
cerning climbing and descending a stair without a hand-
rail, findings similar to those in previous studies [25,26].
The Swedish version could discriminate between unilat-
eral and bilateral amputees and between younger and
older amputees regarding degree of independence in per-
forming locomotor activities. These findings support
other studies that have demonstrated the usefulness of
LCI in detecting differences in mobility [24].
In our study men had ceiling LCI scores more often than
women but there were no statistically significant differ-
ences in the mean scores. In a study that analyzed predic-
tors of good function after major lower limb amputation,
Hermodsson et al. found male sex to be a statistically sig-
nificant predictor and that men were three times more
likely than women to achieve good function [22].
In our study a high correlation of -0.75 between LCI and
TUG was found. A correlation of -0.64 was reported by
Miller et al. who studied 55 amputees [27]. The TUG test
is an objective test compared to the subjective nature of
the LCI. The TUG test also shows how the patient's safety
thinking works in a stressed situation; for example,
whether they take the time to lock the wheels on the walk-
ing frame. Falls are common among amputees and one
cause of decreasing function is fall injuries [28].
Our results showed a strong correlation between the LCI
and self-perceived health measured with the EQ-5D.
Walking is a fundamental human ability and seems to be
strongly correlated to health. Using the Nottingham
Distribution of the LCI scores (N = 144)Figure 2
Distribution of the LCI scores (N = 144).
Health and Quality of Life Outcomes 2009, 7:44 />Page 7 of 9
(page number not for citation purposes)
Health Profile, Pell et al. found that amputees with vascu-
lar disease reported significantly greater problems with
mobility, social isolation, lethargy, pain, sleep and emo-
tional disturbance than controls, but mobility was the
only significant independent factor in a regression analy-
sis [29]. The authors stated "the overall quality of life of
amputees is likely to be enhanced by concentrating reha-
bilitation efforts on improving mobility". We believe that
wheelchair mobility should be part of the rehabilitation
program for amputees and we consider amputees to be
"functional prosthetic users" even if they use a wheelchair
for most of the day but are provided with prosthesis and
are independent in transfers and can walk a few steps.
Despite the strong correlation with the LCI, the EQ-5D is
a measure of health-related quality of life and does not
specifically measure an amputee's function with the pros-
thesis. In addition, the ability of the EQ-5D to detect
change in amputees' function over time has not been eval-
uated. In a study that used the EQ-5D in amputees with
diabetes and foot ulcers in our region (including patients
similar to the amputees in our study), the authors found
that patients who had undergone major amputation had
worse EQ-5D index than patients who achieved primary
healing and those who had undergone minor amputa-
tion. The 26 amputees in that study had a mean EQ-5D
index of 0.31 compared with 0.63 found among the
amputees in our study [30]. One possible explanation is
that the amputees in our study were participating in an
after-rehabilitation training program.
The test-retest reliability of the total LCI, measured with
the ICC in the whole test-retest sample, was comparable
to that previously reported in other studies. Miller et al.
[27] compared the LCI with two other self-report scales
among 55 unilateral amputees (72% below-knee and
28% above knee), and reported that the ICC for the LCI
was 0.88, for the Hougton scale was 0.85, and for the
Prosthetic Evaluation Questionnaire was 0.77. One limi-
tation in our study is the small test-retest sample size of 20
amputees in the evaluation of test-retest reliability.
Recently, a research group stated that "no criteria have
been defined for the required sample size of studies
assessing measurement properties" and considered "a
sample size of at least 50 patients adequate for the assess-
ment of the agreement parameter, based on a general
guideline by Altman [31]" and an ICC of 0.70 as mini-
mum standard for reliability [21].
Different standards for acceptable ICC values have been
proposed and a common recommendation is that meas-
ures intended for clinical use should have ICC exceeding
0.90 whereas for research purposes ICC of 0.70 has been
considered acceptable [19]. Although the ICC values for
the whole test-retest sample in our study were close to
0.90, the 95% confidence intervals were lower but still
above 0.70 even for the two subscales. The inclusion of
bilateral amputees in the test-retest sample may be con-
sidered problematic because it may increase the variability
of the reliability coefficient and therefore may inflate the
reliability [32]. In the subsample of unilateral amputees
the ICC values were lower particularly for the basic LCI.
Although the ICC values for the unilateral amputees were
near or above levels considered acceptable, they were
based on a small sample size and subsequently had wide
confidence intervals. A study with a larger sample of uni-
Table 3: The locomotor capabilities index (LCI) in different age
groups (n = 144)
Age group
yr
Number of amputees
n (%)
LCI
mean (SD)*
40–59 11 (7.6) 39 (4)
60–69 29 (20.1) 32 (12)
70–79 54 (37.5) 27 (12)
80+ 50 (34.7) 25 (13)
* p = 0.001
Table 4: Test-retest reliability
Time 1 Time 2
LCI mean (SD) mean (SD) Mean difference
(95% CI)
ICC
(95% CI)
All amputees (n = 20)
Total LCI 24.5 (13) 26.1 (14) -1.6 (-4.3–1.1) 0.91 (0.79–0.96)
Basic 15.4 (7) 16.2 (7) -0.8 (-2.4–0.8) 0.88 (0.72–0.95)
Advanced 9.2 (7) 10.0 (7) -0.8 (-2.2–0.6) 0.92 (0.80–0.97)
Unilateral amputees (n = 14)
Total LCI 29.9 (11) 32.1 (9) -2.1 (-5.6–1.3) 0.83 (0.56–0.94)*
Basic 18.1 (5) 19.3 (4) -1.1 (-3.3–1.0) 0.66 (0.24–0.87)*
Advanced 11.8 (7) 12.8 (7) -1.0 (-2.5–0.5) 0.92 (0.78–0.97)
*The results are influenced by one outlier, for the other 13 amputees ICC basic is 0.78 (0.43–0.93) and total 0.89 (0.70–0.97).
ICC, intraclass correlation coefficient; CI, confidence interval
Health and Quality of Life Outcomes 2009, 7:44 />Page 8 of 9
(page number not for citation purposes)
lateral trans-tibial amputees would be needed to further
assess test-retest reliability and to confirm that the test-
retest reliability is adequate for clinical use.
Ceiling effects with the use of LCI have been reported pre-
viously; one study reported a best possible score in 46%
of 50 amputees (mean age 51 years) [25], and another in
40% of 329 amputees (mean age 60 years) [27]. In our
study, the same pattern was observed, despite the high age
of the participants amputated because of peripheral arte-
rial disease. To address the problem of the ceiling effect
the LCI-5 has been designed, with item response 3 "yes,
alone" changed to 3 "yes, alone with ambulation aids"
and 4 "yes, alone without ambulation aids" [25]. The high
ceiling effect may have contributed to the high value for
internal consistency.
In clinical practice there is increasing need to evaluate the
methods used in rehabilitation because of a greater
emphasis on patient safety and a growing interest in
health economics. Whatever the purpose of their use, the
tests must show not only high reliability and validity but
also be easy to use in a clinical setting. The LCI appears to
meet those requirements with its ease of use in daily prac-
tice.
Amputees with a low level of function may not know
whether or not they can perform the activities inquired
about in the questionnaire. Elderly amputees may, for
safety reasons, have stopped performing certain activities
when they are alone, and some may always use their
wheelchair when outdoors. We have sometimes found it
valuable that the amputees are given the opportunity to
try to perform some of the activities in the presence of the
test administrator. For instance, for the item "getting up
after falling" the amputee could be allowed to sit on a
mattress on the floor and try to rise up and stand with the
help of a chair and "walking while carrying an object"
could be exemplified as walking 10 meters while carrying
a glass of water. Due to the highly functional nature of the
items in the LCI, these tests may be useful, for instance
when rehabilitation goals are defined together with the
amputees [13]. However, care should be taken not to
change the focus of the test from being a self-administered
test to an observed test. Franchignoni et al. suggested
guidelines for item scoring (e.g. carrying an object) as a
possible improvement of the LCI [25].
The methods used for lower limb amputation and reha-
bilitation following amputation may differ between units,
even when treating similar patients, and the differences
may involve chosen levels of amputation, edema treat-
ment, and time chosen for prosthetic fitting [2,6,22].
Finding the best practice would require a standardized
protocol for measuring rehabilitation progress after lower
limb amputations. The LCI could be a useful tool in this
context.
Conclusion
The Swedish version of the LCI demonstrated good valid-
ity and internal consistency in adult amputees. Test-retest
reliability in a small subsample appears to be acceptable.
The ceiling effect was high, which may imply that it would
be most useful in assessing amputees with low to moder-
ate functional abilities.
Competing interests
The authors declare that they have no competing interests.
Authors' contributions
BL, HIA, AJ and IA conceived of and designed the study.
BL, AJ and IA analyzed and interpreted the data. AJ, BL and
IA performed the statistical analysis. BL and AJ drafted the
paper and IA critically revised it for important intellectual
content. All authors read and gave approval of the final
manuscript.
Additional material
Acknowledgements
This research was supported by Hässleholm Hospital. The authors thank
Anna Larsson, Sara Hedén, Kim McLearnon and Stephan Mc Learnon for
their help in the translation procedures, the rehabilitation teams in Gothen-
burg and Stockholm for help with collecting data, and Biostatisticians Jonas
Ranstam and Aleksandra Turkiewicz at the Swedish National Competence
Centre for Musculoskeletal Disorders, Department of Orthopedics, Lund
University Hospital, Lund, Sweden.
References
1. Heikkinen M, Saarinen J, Suominen VP, Virkkunen J, Salenius J: Lower
limb amputations: differences between the genders and
long-term survival. Prosthet Orthot Int 2007, 31:277-286.
2. Kald A, Carlsson R, Nilsson E: Major amputation in a defined
population: incidence, mortality and results of treatment. Br
J Surg 1989, 76:308-310.
3. Laaperi T, Pohjolainen T, Alaranta H, Karkkainen M: Lower-limb
amputations. Ann Chir Gynaecol 1993, 82:183-187.
4. Eneroth M, Persson BM: Amputation for occlusive arterial dis-
ease. A prospective multicentre study of 177 amputees. Int
Orthop 1992, 16:383-387.
5. Fletcher DD, Andrews KL, Butters MA, Jacobsen SJ, Rowland CM,
Hallett JW Jr: Rehabilitation of the geriatric vascular amputee
patient: a population-based study. Arch Phys Med Rehabil 2001,
82:776-779.
6. Johannesson A, Larsson GU, Oberg T: From major amputation
to prosthetic outcome: a prospective study of 190 patients in
a defined population. Prosthet Orthot Int 2004, 28:9-21.
Additional file 1
Swedish version of LCI. The translated version of the Locomotor Capa-
bilities Index
Click here for file
[ />7525-7-44-S1.doc]
Publish with BioMed Central and every
scientist can read your work free of charge
"BioMed Central will be the most significant development for
disseminating the results of biomedical research in our lifetime."
Sir Paul Nurse, Cancer Research UK
Your research papers will be:
available free of charge to the entire biomedical community
peer reviewed and published immediately upon acceptance
cited in PubMed and archived on PubMed Central
yours — you keep the copyright
Submit your manuscript here:
/>BioMedcentral
Health and Quality of Life Outcomes 2009, 7:44 />Page 9 of 9
(page number not for citation purposes)
7. Davies B, Datta D: Mobility outcome following unilateral lower
limb amputation. Prosthet Orthot Int 2003, 27:186-190.
8. Gallagher P, MacLachlan M: Psychological adjustment and cop-
ing in adults with prosthetic limbs. Behav Med 1999, 25:117-124.
9. Tisi PV, Callam MJ: Type of incision for below knee amputation.
Cochrane Database Syst Rev 2004:CD003749.
10. Back-Pettersson S, Bjorkelund C: Care of elderly lower limb
amputees, as described in medical and nursing records.
Scand J Caring Sci 2005, 19:337-343.
11. Grise MC, Gauthier-Gagnon C, Martineau GG: Prosthetic profile
of people with lower extremity amputation: conception and
design of a follow-up questionnaire. Arch Phys Med Rehabil 1993,
74:862-870.
12. Gauthier-Gagnon C, Grise MC: Prosthetic profile of the
amputee questionnaire: validity and reliability. Arch Phys Med
Rehabil 1994, 75:1309-1314.
13. Gauthier-Gagnon C, Grise MC: Tools to measure outcome of
people with lower limb amputation; Update on the PPA and
LCI. J Prosthet Orthot 2006, 18:61-69.
14. Beaton DE, Bombardier C, Guillemin F, Ferraz MB: Guidelines for
the process of cross-cultural adaptation of self-report meas-
ures. Spine 2000, 25:3186-3191.
15. Dolan P, Roberts J: Modelling valuations for Eq-5d health
states: an alternative model using differences in valuations.
Med Care 2002, 40:442-446.
16. Burstrom K, Johannesson M, Diderichsen F: Swedish population
health-related quality of life results using the EQ-5D. Qual Life
Res 2001, 10:621-635.
17. Podsiadlo D, Richardson S: The timed "Up & Go": a test of basic
functional mobility for frail elderly persons. J Am Geriatr Soc
1991, 39:142-148.
18. Kirshner B, Guyatt G: A methodological framework for assess-
ing health indices. J Chronic Dis
1985, 38:27-36.
19. Streiner DL, Norman GR: Health Measurement Scales. A practical guide
to their development and use 3rd edition. Oxford (NY): Oxford Univer-
sity Press; 2003.
20. Cohen J: Statistical power analysis for the behavioral sciences 2nd edition.
Hillsdale, NJ: Erlbaum Associates; 1988.
21. Terwee CB, Bot SD, de Boer MR, Windt DA van der, Knol DL,
Dekker J, Bouter LM, de Vet HC: Quality criteria were proposed
for measurement properties of health status questionnaires.
J Clin Epidemiol 2007, 60:34-42.
22. Hermodsson Y, Ekdahl C, Persson BM: Outcome after trans-tibial
amputation for vascular disease. A follow-up after eight
years. Scand J Caring Sci 1998, 12:73-80.
23. de Groot IB, Favejee MM, Reijman M, Verhaar JA, Terwee CB: The
Dutch version of the Knee Injury and Osteoarthritis Out-
come Score: a validation study. Health Qual Life Outcomes 2008,
6:16.
24. Gauthier-Gagnon C, Grise MC, Potvin D: Enabling factors related
to prosthetic use by people with transtibial and transfemoral
amputation. Arch Phys Med Rehabil 1999, 80:706-713.
25. Franchignoni F, Orlandini D, Ferriero G, Moscato TA: Reliability,
validity, and responsiveness of the locomotor capabilities
index in adults with lower-limb amputation undergoing pros-
thetic training. Arch Phys Med Rehabil 2004, 85:743-748.
26. Franchignoni F, Tesio L, Orlandini D: Mobility scales for lower
limb-prosthetic patient: the locomotor capabilities index.
Arch Phys Med Rehabil 2002, 83:582-583.
27. Miller WC, Deathe AB, Speechley M: Lower extremity prosthetic
mobility: a comparison of 3 self-report scales. Arch Phys Med
Rehabil 2001, 82:1432-1440.
28. Pauley T, Devlin M, Heslin K: Falls sustained during inpatient
rehabilitation after lower limb amputation: prevalence and
predictors. Am J Phys Med Rehabil 2006, 85:521-532.
29. Pell JP, Donnan PT, Fowkes FG, Ruckley CV: Quality of life follow-
ing lower limb amputation for peripheral arterial disease.
Eur J Vasc Surg 1993, 7:448-451.
30. Ragnarson TG, Apelqvist J: Health-related quality of life in
patients with diabetes mellitus and foot ulcers.
J Diabetes Com-
plications 2000, 14:235-241.
31. Altman DG: Practical statistics for medical research London: Chapman
and Hall; 1991.
32. de Vet HC, Terwee CB, Knol DL, Bouter LM: When to use agree-
ment versus reliability measures. J Clin Epidemiol 2006,
59:1033-1039.