báo cáo hóa học: " Fractal time series analysis of postural stability in elderly and control subjects" pot
Bạn đang xem bản rút gọn của tài liệu. Xem và tải ngay bản đầy đủ của tài liệu tại đây (514.24 KB, 12 trang )
BioMed Central
Page 1 of 12
(page number not for citation purposes)
Journal of NeuroEngineering and
Rehabilitation
Open Access
Research
Fractal time series analysis of postural stability in elderly and
control subjects
Hassan Amoud
†
, Mohamed Abadi
†
, David J Hewson*, Valérie Michel-
Pellegrino
†
, Michel Doussot
†
and Jacques Duchêne
†
Address: Institut Charles Delaunay, FRE CNRS 2848, Université de technologie de Troyes, 10000 Troyes, France
Email: Hassan Amoud - ; Mohamed Abadi - ; David J Hewson* - ; Valérie Michel-
Pellegrino - ; Michel Doussot - ; Jacques Duchêne -
* Corresponding author †Equal contributors
Abstract
Background: The study of balance using stabilogram analysis is of particular interest in the study
of falls. Although simple statistical parameters derived from the stabilogram have been shown to
predict risk of falls, such measures offer little insight into the underlying control mechanisms
responsible for degradation in balance. In contrast, fractal and non-linear time-series analysis of
stabilograms, such as estimations of the Hurst exponent (H), may provide information related to
the underlying motor control strategies governing postural stability. In order to be adapted for a
home-based follow-up of balance, such methods need to be robust, regardless of the experimental
protocol, while producing time-series that are as short as possible. The present study compares
two methods of calculating H: Detrended Fluctuation Analysis (DFA) and Stabilogram Diffusion
Analysis (SDA) for elderly and control subjects, as well as evaluating the effect of recording
duration.
Methods: Centre of pressure signals were obtained from 90 young adult subjects and 10 elderly
subjects. Data were sampled at 100 Hz for 30 s, including stepping onto and off the force plate.
Estimations of H were made using sliding windows of 10, 5, and 2.5 s durations, with windows slid
forward in 1-s increments. Multivariate analysis of variance was used to test for the effect of time,
age and estimation method on the Hurst exponent, while the intra-class correlation coefficient
(ICC) was used as a measure of reliability.
Results: Both SDA and DFA methods were able to identify differences in postural stability
between control and elderly subjects for time series as short as 5 s, with ICC values as high as 0.75
for DFA.
Conclusion: Both methods would be well-suited to non-invasive longitudinal assessment of
balance. In addition, reliable estimations of H were obtained from time series as short as 5 s.
Background
The study of balance deficits is of interest for many rea-
sons, in particular for people with various pathological
conditions affecting balance, and the elderly. In respect to
an elderly population, falls are a major problem, in terms
of both frequency and consequences. In France alone,
Published: 1 May 2007
Journal of NeuroEngineering and Rehabilitation 2007, 4:12 doi:10.1186/1743-0003-4-12
Received: 15 May 2006
Accepted: 1 May 2007
This article is available from: />© 2007 Amoud et al; licensee BioMed Central Ltd.
This is an Open Access article distributed under the terms of the Creative Commons Attribution License ( />),
which permits unrestricted use, distribution, and reproduction in any medium, provided the original work is properly cited.
Journal of NeuroEngineering and Rehabilitation 2007, 4:12 />Page 2 of 12
(page number not for citation purposes)
more than two million falls are recorded among the eld-
erly each year, leading to more than 9000 deaths [1]. Most
prospective studies have attempted to identify risk factors,
particularly in groups at high risk of falling [2-5]. The fac-
tors identified in these studies have often varied, mainly
due to differences in methodology, diagnosis, and the
study population [6]. Nevertheless, several factors are reg-
ularly cited, such as muscular weakness, a previous fall, or
balance problems [2,4,7-9]. In addition, several factors
that augment the risk of falling, such as visual, vestibular,
or proprioceptive problems, will adversely affect balance
[10-12].
Balance can be evaluated either clinically, using tests such
as the "Timed Get-up-and-go" [13], "Berg Balance Scale"
[14] and the "Tinetti Balance Scale" [15], or biomechani-
cally, using a force plate to evaluate postural sway [16]. In
order to measure postural sway, the movement of the cen-
tre of pressure (COP) over the support base of the subject
can be evaluated [17], with the resulting stabilogram dis-
playing the movement of the COP over time for antero-
posterior (AP), mediolateral (ML), and resultant (R)
directions. Simple statistical parameters derived from the
stabilogram, such as the area and the shape covered by the
displacement of the COP have been shown to predict risk
of falls [3,18].
Although both clinical and biomechanical tests have been
shown to be able to identify elderly at a greater risk of fall-
ing, such tests have yet to be used for long-term monitor-
ing of balance. Recent technological advances might
enable biomechanical tests to be used for home-based
longitudinal study aimed at fall prevention. Before any
such study could be envisaged there are several factors that
need to be addressed. Firstly, the simple statistical param-
eters derived from the stabilogram offer little insight into
the underlying control mechanism that is responsible for
the degradation in balance observed. In addition, the
duration of the testing remains problematic, with tests
lasting longer than 10 s likely to decrease subject compli-
ance. Finally, the testing equipment needs to be adapted
for home-based non-invasive monitoring. The present
study will address those issues related to the type of
parameters that can be extracted from the stabilogram, as
well as the shortest possible signal duration from which
reliable parameters are able to be extracted. Information
related to the development of a home-based assessment
protocol can be found in [19].
In terms of the extraction of parameters that provide infor-
mation related to underlying physiological control proc-
esses, over the last ten years, a number of authors have
used more complex signal processing techniques to ana-
lyse the stabilogram (signal). These techniques have
included Stabilogram Diffusion Analysis (SDA) [20-22],
Detrended Fluctuation Analysis (DFA) [23,24], and Res-
caled Range Analysis (R/S) [23]. Such methods have been
used as the stabilogram has been shown to be a nonsta-
tionary time series [25,26] that displays fractal character-
istics [21,27]. The advantage of such methods is that
information related to the underlying motor control strat-
egies governing postural stability could be extracted. For
instance, the SDA, DFA, and R/S methods provide infor-
mation on the long-term correlations contained within
the time series. Despite the unpredictability of fractal sig-
nals, an element of order can exist. This order, although
not evident for two successive values, implies that values
depend on the global history of the series, and that long-
term correlations exist. Furthermore, such long-term cor-
relations exhibit scaling laws, first described by Mandel-
brot and Van Ness [28] and termed fractional Brownian
motion in the following equation [28]:
Δx
2
∝ Δt
2H
where Δx is the distance between two points separated in
time by Δt, and where the Hurst exponent H is in the range
0 < H < 1.
When consecutive values are positively correlated (H > 1/
2), the signal is said to show persistence, whereas negative
correlations (H < 1/2) are termed anti-persistence. The
special case of Brownian motion occurs when H = 1/2.
The determination of the scaling exponent H of a stabilo-
gram is of particular interest, as it can be inferred to relate
to mechanisms of postural control [29].
The control of posture is very complex, involving input
from the visual, vestibular, and proprioceptive systems.
Collins and De Luca [30] suggested that both closed-loop
and open-loop mechanisms of postural control are
present in order to control postural sway. A closed-loop
system implies that the system responds quickly to feed-
back concerning deviations from acceptable limits, and
responds accordingly. In contrast, an open-loop system
operates without feedback, and is therefore much less
accurate than a closed-loop system. Collins and De Luca
identified two distinct zones in their stabilogram diffu-
sion plots, each of which had a different scaling exponent
[30]. They interpreted the presence of short-range positive
correlations (H > 1/2) in COP data as verifying the use of
open-loop control mechanisms over short time periods (t
< 1 s). Thereafter, long-range negative correlations were
observed (H < 1/2). The explanation proposed was that
posture is loosely controlled until acceptable limits are
passed, upon which time a more rigid closed-loop system
is applied, ensuring that postural sway values fall within
more acceptable limits. The point at which these two strat-
egies converge, the "critical time" gives an indication of
the degree of laxity in control. In a subsequent study, Col-
Journal of NeuroEngineering and Rehabilitation 2007, 4:12 />Page 3 of 12
(page number not for citation purposes)
lins and colleagues observed longer critical times in eld-
erly subjects, implying that a greater time spent in open-
loop control could be a factor in falls in the elderly [29].
Since the pioneering work of Collins and De Luca, subse-
quent studies, in particular that of Delignieres and col-
leagues [23], have failed to find any evidence of two
distinct zones of control. They suggested that the results of
Collins and colleagues were due to the manner in which
the biological time series was mapped as a stochastic proc-
ess, and the resulting estimations of H. The method of
Collins and De Luca did not take into account that biolog-
ical time series have bounds imposed by physiological
limits, as compared with fractional Brownian motion,
which is unbounded and can therefore be expected to
increase indefinitely with time. However, the upper limit
imposed on the COP displacement by the support area of
the feet acts as a ceiling which causes the second anti-per-
sistent part of the stabilogram diffusion plot [23]. When
there is a definite upper limit for a time series, scaling is
restricted to short time intervals, beyond which values sat-
urate at twice the variance of the data [31]. The two meth-
ods previously cited to calculate the Hurst exponent, DFA
and R/S use an integrated signal, and therefore do not suf-
fer from the bounded limitation of the second part of
SDA. However, the choice of methods depends of the
nature of series to which the methods are to be applied.
The DFA method can be applied to both fractional Brown-
ian motion (fBm) and fractional Gaussian motion (fGn)
whereas R/S can only be applied to fGn series [32]. It is
necessary, therefore to apply the DFA method first, from
which the nature of the time series can be determined. If
the slope α obtained from DFA is greater than 1, this indi-
cates that the series is fBm; if α is less than 1, the series is
fGn. In the present study, α obtained from DFA was
greater than 1 for all subjects, thus all time series are fBm
and the R/S method can not be used.
The aims of the current investigation are twofold: firstly,
the SDA and DFA methods of estimating the Hurst expo-
nent will be compared and applied to postural signals for
elderly and control subjects. Secondly, the minimum
recording duration needed in order to obtain reliable
results will be identified for both methods.
Methods
Subjects
Ninety young control subjects and ten elderly subjects
participated in the study. Anthropometric data for the two
subject groups are presented in Table 1. All subjects who
participated gave their written informed consent. No sub-
jects reported any musculoskeletal or neurological condi-
tions that precluded their participation in the study.
Centre of pressure data
Centre of pressure data were recorded using a Bertec 4060-
08 force plate (Bertec Corporation, Columbus, OH, USA),
which amplifies, filters, and digitises the raw signals from
the strain gauge amplifiers inside the force plate. The
resulting output is a six-channel 16-bit digital signal con-
taining the forces and moments in the x, y, and z axes. The
digital signals were subsequently converted via an external
analogue amplifier (AM6501, Bertec Corporation). The
initial COP signals were calculated with respect to the cen-
tre of the force-plate before normalization by subtraction
of the mean.
Data acquisition and processing
Data were recorded using the ProTags™ software package
(Jean-Yves Hogrel, Institut de Myologie, Paris, France)
developed in Labview
®
(National Instruments Corpora-
tion, Austin TX, USA). Data were sampled at 100 Hz, with
an 8
th
-order low-pass Butterworth filter with a cut-off fre-
quency of 10 Hz. All calculations of COP data were per-
formed with Matlab
®
(Mathworks Inc, Natick, MA, USA).
Experimental protocol
All subjects were tested either barefoot or wearing socks,
and were instructed to stand upright with their arms by
their sides in front of the force-plate, while looking at a
target of a 10-cm cross fixed on the wall two meters in
front of the force-plate. Upon a verbal command, subjects
stepped onto the force plate, with no constraint given over
foot position. Data were recorded for 30 seconds, which
included both the step onto and off the force plate, and at
least 20 seconds during which time subjects remained sta-
tionary in an upright posture. At the end of the trial
another verbal command was given for subjects to step off
the force-plate. Subjects performed the test four times,
with a delay of 10 s between tests.
This protocol is similar to that which would be used for
home monitoring, in that subjects were free to choose
their foot position, the speed at which they stepped onto
the force plate, and the length of their step onto the force
plate.
Estimation of the Hurst exponent
Stabilogram Diffusion Analysis (SDA)
Collins and De Luca [30] hypothesized that the trajectory
of the COP could be modelled as a correlated random
walk. They proposed a simple method to calculate the
scaling exponent H of a stabilogram, whereby the square
of the displacement for a given time interval Δt is calcu-
lated for all possible pairs of points separated by Δt, and
the average calculated as:
Journal of NeuroEngineering and Rehabilitation 2007, 4:12 />Page 4 of 12
(page number not for citation purposes)
where N is the number of points in the vector x, and m is
the interval between two values expressed as the number
of data.
Estimations of the Hurst exponent are then obtained from
the graph of Δt by <Δx>
2
in log scale by calculating the
slope of the short-term (H
S
) and long-term (H
L
) regions
of the curve. The equations used by Collins and colleagues
to estimate H
S
and H
L
contain several assumptions. The
second derivative of the Δt by <Δx>
2
data is used to locate
four times (T
1
, T
2
, T
3
, T
4
) between which the slopes H
S
(T
1
,
T
2
) and H
L
(T
3
, T
4
) are calculated. The first time, T
1
, is
always taken as zero, while T
2
is the first maximum that
occurs before 1 s. The slope H
S
is then calculated between
these points. Similarly, the slope H
L
is calculated between
T
3
and T
4
, where T
3
is calculated as the second maximum,
and T
4
as the first maximum occurring after the first min-
imum when the signal is analyzed backwards from 9 s. If
no maximum is found before 7 s, T
4
is taken as 9 s. A copy
of the Matlab
®
program, as well a detailed explanation are
available at colleagues [33]. In order to estimate H
L
for the
5-s and 2.5-s windows, if the second maximum was not
found, T
3
was taken as 2.5 s for the 5-s window and 1.25 s
for the 2.5-s window, while T
4
was taken as 4.5 s and 2.5
s respectively, as these windows were too small to use the
normal method of obtaining T
4
between 7 and 9 s.
Detrended Fluctuation Analysis (DFA)
Peng and colleagues [34] introduced another method of
estimating the Hurst exponent specifically for biological
time series data, which they termed Detrended Fluctua-
tion Analysis (DFA). The first step is to subtract the mean
from the original series, which is then integrated:
This series is then divided into windows of equal length n.
If the total length N is not divisible by n, the length N is
adjusted to the largest multiple of n < N. The local trend
of each window y
n
is obtained and subtracted from the
summed series, using a line of least-squared fit to obtain
the detrended fluctuation F(n) as:
The slope of the regression line for F(n) on a log scale is
calculated (α) and used to estimate the Hurst exponent,
hereafter indicated as H
DFA
, with H
DFA
= α-1 for fractional
Brownian motion [32].
Data analysis
Centre of pressure data were calculated from the moment
the second foot contacted the force plate (FC
2
) for all dis-
placement directions. The time FC
2
occurred was calcu-
lated as time at which the maximum value of the second
derivative of the ML signal occurred, which corresponded
to the time the second foot touched the force plate when
the largest acceleration of ML would occur when the COP
moved rapidly towards the second foot. This instant in
time was used for all AP, ML, and R displacements.
Variables were calculated for sliding windows of 10, 5,
and 2.5 s, starting from FC
2
. The windows were slid by 1 s
increments until nine windows in total were obtained.
The number of windows was kept at nine in order to
ensure that there were more subjects than windows for
subsequent statistical analysis (10 elderly subjects were
analysed). The overlap percentage for the three window
sizes were 90, 80, and 60% for the windows of 10, 5, and
2.5 s respectively. Estimations of the Hurst exponent were
then calculated using DFA and SDA (H
S
and H
L
) methods.
Examples of SDA and DFA plots calculated for a typical
elderly and a typical control subject for all window
lengths are presented in Figure 1 and Figure 2, respec-
tively.
All statistical analyses were performed with the Statistical
Package for Social Sciences (SPSS Inc., Chicago, IL, USA).
Measures of skewness and kurtosis, as well as the Kol-
mogorov-Smirnov test were used to check for normality
[34]. Analysis of variance (ANOVA) was used to test for
the effect of subject group on the estimations of the Hurst
exponent, with a Bonferroni adjustment when evaluating
Δ
Δ
Δ
x
Nm
xx
t
it
i
Nm
i
2
1
2
1
=
−
−
+
=
−
∑
()
yk xi x
i
k
() ()
_
=−
⎡
⎣
⎢
⎤
⎦
⎥
=
∑
1
Fn
N
yk y
n
k
N
() [() ]=−
=
∑
1
2
1
Table 1: Anthropometric data for elderly and control groups.
Gender Number Age Height Weight
Control Men 57 19.8 ± 0.9 179.5 ± 8.2 71.6 ± 9.9
Women 33 19.6 ± 0.8 166.5 ± 4.9 58.9 ± 8.1
Elderly Men 4 80.0 ± 2.2 173 ± 4.5 81.9 ± 8.5
Women 6 80.8 ± 6.0 160.5 ± 1.2 68.4 ± 5.8
Values are means and standard deviations.
Journal of NeuroEngineering and Rehabilitation 2007, 4:12 />Page 5 of 12
(page number not for citation purposes)
contrasts. Repeated measures ANOVA was used to test for
the effect of the sliding windows on the estimations of the
Hurst exponent. The independent variables were subject
group and time, with an interaction between subject
group and time included. The dependent variables were
estimations of the Hurst exponent using the SDA and DFA
for the different displacement directions. The intra-class
correlation (ICC) was used as a measure of reliability [36],
with a two-way mixed model used in order to ensure an
unbiased estimation of reliability [37]. Data were
expressed as means and 95% confidence intervals. Alpha
levels were set at p < 0.05.
Results
Sliding window effect
Stabilogram Diffusion Analysis (SDA)
There were no differences between the four trials for any
of the parameters studied. Accordingly, mean values of all
four trials were used for all subsequent statistical analysis,
with the notable exception of the reliability analysis.
There were no significant results for H
L
for the effect of
time nor were there any differences between window-
lengths. In addition values were often less than zero,
which would make interpretation difficult. Finally, H
L
was
unable to differentiate between subject groups, therefore
no further analyses were performed on H
L
and all subse-
quent references to SDA relate to H
S
.
In terms of the effect of time on H
S
, there was a significant
decrease for all window lengths for the control group for
all displacement directions (Figure 3). In contrast, the
effect of time on window length for the elderly group was
significant only for the 2.5s window for AP and RD dis-
placement (Figures 3a and 3c). For both the 5 s and 10 s
window lengths, although H
S
tended to decrease, the
effect was not significant. There were no interaction effects
between time and subject group for H
S
for any window
length.
Detrended Fluctuation Analysis (DFA)
In terms of the effect of time on H
DFA
, there was a signifi-
cant increase for all window lengths for the control group
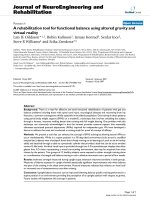
Detrended fluctuation analysis plots for elderly and control subjects for anteroposterior and mediolateral displacementsFigure 2
Detrended fluctuation analysis plots for elderly and
control subjects for anteroposterior and medi-
olateral displacements. Data are typical values for an eld-
erly and a control subject for 10, 5, and 2.5 s. Data are
plotted in a log-log scale.
10
1
10
2
10
3
10
-1
10
0
10
1
10
2
α
Control
= 1.71
α
Elderly
= 1.6
10
1
10
2
10
3
10
-1
10
0
10
1
10
2
α
Control
= 1.71
α
Elderly
= 1.6
10
1
10
2
10
3
10
-1
10
0
10
1
10
2
α
Control
= 1.37
α
Elderly
= 1.65
10
1
10
2
10
3
10
-1
10
0
10
1
10
2
α
Control
= 1.37
α
Elderly
= 1.65
10
1
10
2
10
3
10
-1
10
0
10
1
10
2
10
3
α
Control
= 1.36
α
Elderly
= 1.06
10
1
10
2
10
3
10
-1
10
0
10
1
10
2
10
3
α
Control
= 1.36
α
Elderly
= 1.06
10
1
10
2
10
3
10
-1
10
0
10
1
10
2
10
3
α
Control
= 1.19
α
Elderly
= 1.28
10
1
10
2
10
3
10
-1
10
0
10
1
10
2
10
3
α
Control
= 1.19
α
Elderly
= 1.28
10
1
10
2
10
3
10
-1
10
0
10
1
10
2
α
Control
= 1.36
α
Elderly
= 1.26
10
1
10
2
10
3
10
-1
10
0
10
1
10
2
α
Control
= 1.36
α
Elderly
= 1.26
10
1
10
2
10
3
10
-1
10
0
10
1
10
2
α
Control
= 1.26
α
Elderly
= 1.61
10
1
10
2
10
3
10
-1
10
0
10
1
10
2
α
Control
= 1.26
α
Elderly
= 1.61
log
10
[n] log
10
[n]
log
10
[F(n)]
log
10
[F(n)]
log
10
[F(n)]
log
10
[F(n)]
log
10
[F(n)]
log
10
[F(n)]
AP
ML
10 s
10 s
5 s
5 s
2.5 s
2.5 s
Elderly
Control
Stabilogram diffusion analysis plots for elderly and control subjects for anteroposterior and mediolateral displacementsFigure 1
Stabilogram diffusion analysis plots for elderly and
control subjects for anteroposterior and medi-
olateral displacements. Data are typical values for an eld-
erly and a control subject for 10, 5, and 2.5 s. Data are
plotted in a log-log scale.
10
-2
10
-1
10
0
10
1
10
-3
10
-2
10
-1
10
0
10
1
10
2
HS
Control
= 0.8
HS
Elderly
= 0.89
10
-2
10
-1
10
0
10
1
10
-3
10
-2
10
-1
10
0
10
1
10
2
HS
Control
= 0.8
HS
Elderly
= 0.89
10
-2
10
-1
10
0
10
1
10
-3
10
-2
10
-1
10
0
10
1
10
2
HS
Control
= 0.77
HS
Elderly
= 0.83
10
-2
10
-1
10
0
10
1
10
-3
10
-2
10
-1
10
0
10
1
10
2
HS
Control
= 0.77
HS
Elderly
= 0.83
10
-2
10
-1
10
0
10
1
10
-2
10
-1
10
0
10
1
10
2
HS
Control
= 0.73
HS
Elderly
= 0.88
10
-2
10
-1
10
0
10
1
10
-2
10
-1
10
0
10
1
10
2
HS
Control
= 0.73
HS
Elderly
= 0.88
10
-2
10
-1
10
0
10
1
10
-3
10
-2
10
-1
10
0
10
1
10
2
HS
Control
= 0.76
HS
Elderly
= 0.72
10
-2
10
-1
10
0
10
1
10
-3
10
-2
10
-1
10
0
10
1
10
2
HS
Control
= 0.76
HS
Elderly
= 0.72
10
-2
10
-1
10
0
10
1
10
-2
10
-1
10
0
10
1
10
2
HS
Control
= 0.78
HS
Elderly
= 0.82
10
-2
10
-1
10
0
10
1
10
-2
10
-1
10
0
10
1
10
2
HS
Control
= 0.78
HS
Elderly
= 0.82
10
-2
10
-1
10
0
10
1
10
-2
10
-1
10
0
10
1
10
2
HS
Control
= 0.74
HS
Elderly
= 0.78
10
-2
10
-1
10
0
10
1
10
-2
10
-1
10
0
10
1
10
2
HS
Control
= 0.74
HS
Elderly
= 0.78
log
10
[
ς
t] (s) log
10
[
ς
t] (s)
log
10
[<ςx
2
>] (mm
2
)
log
10
[<ςx
2
>] (mm
2
) log
10
[<ςx
2
>] (mm
2
)
log
10
[<ςx
2
>] (mm
2
)
log
10
[<ςx
2
>] (mm
2
)
log
10
[<ςx
2
>] (mm
2
)
AP
ML
10 s
10 s
5 s
5 s
2.5 s
2.5 s
Elderly
Control
Journal of NeuroEngineering and Rehabilitation 2007, 4:12 />Page 6 of 12
(page number not for citation purposes)
for AP displacement (Figure 4a). For ML displacement,
H
DFA
decreased for the 2.5-s window, increased for the 10-
s window, but did not change significantly for the 5-s win-
dow (Figure 4b). For the resultant displacement, H
DFA
decreased significantly for both the 2.5s and 5s window
lengths, but not for the 10s window (Figure 4c). For the
elderly subjects H
DFA
increased significantly for AP dis-
placement for all window lengths (Figure 4a). In contrast,
H
DFA
increased significantly for only the 10s window for
ML displacement (Figure 4b), and had no significant
change for resultant displacement (Figure 4c).
There was also an interaction effect for all displacement
directions for the 10s window, where the rate of increase
in H
DFA
was greater for elderly subjects than for the con-
trols.
Reliability analysis
The reliability analyses were performed separately for the
control and elderly subject groups owing to the differ-
ences in the values of H
S
and H
DFA
between groups, which
are reported in the next section of the results.
Stabilogram Diffusion Analysis (SDA)
There was no significant effect of time on the ICC values
for any window length. As subsequent tests found no evi-
dence of non-normality, ANOVA was performed on the
individual ICC values for each sliding position for each
window length in order to identify differences between
groups and methods. In respect to differences between the
control and elderly subjects, ICC values were significantly
higher for the elderly for the 2.5-s window for AP and RD
directions, for the 5-s window for all directions, and for
the 10-s window for the RD direction (Table 2). In terms
of differences between window lengths, the only signifi-
cant difference was observed for control subjects for the
AP direction, whereby the ICC value for the 10-s window
was significantly greater than that of the 5-s window
(Table 2).
Detrended Fluctuation Analysis (DFA)
As for the SDA, there was no significant effect of time on
the ICC values for any window length. Statistical tests
were therefore performed on the individual ICC values.
Significant differences between the control and elderly
subjects were observed for all window sizes for both AP
and RD directions (Table 3). In respect to the effect of the
window length, the only significant differences were that
the ICC values for the 2.5-s window were lower than those
for the 5-s window for both AP and ML directions (Table
3).
When ICC values were compared between the SDA and
DFA methods, significantly higher values were observed
for DFA for both control and elderly subjects for the 5-s
Evolution of H
S
for anteroposterior (a), mediolateral (b), and resultant (c) displacementFigure 3
Evolution of H
S
for anteroposterior (a), mediolateral
(b), and resultant (c) displacement. Data are means and
95% confidence intervals. The x axes represent time in sec-
onds, while the y axes represent the estimation of H
S
. The
zero values on the x axes correspond to FC2, while the x
coordinate of each data point corresponds to the centre of
the data window.
0.6
0.7
0.8
0.9
036912
AP
H
S
2.5 s Control
2.5 s Elderly
5 s Control
5 s Elderly
10 s Control
10 s Elderly
0.6
0.7
0.8
0.9
036912
ML
H
S
0.6
0.7
0.8
0.9
036912
RD
H
S
time (s)
(a)
(b)
(c)
Journal of NeuroEngineering and Rehabilitation 2007, 4:12 />Page 7 of 12
(page number not for citation purposes)
window for the AP direction, and for elderly subjects for
the AP direction for the 10-s window (Table 2 and 3). In
contrast, a significantly higher ICC value was observed for
SDA for the RD direction for the 5-s window for control
subjects (Table 2 and 3).
The effect of age on postural stability
Stabilogram Diffusion Analysis (SDA)
For the analysis of the effect of age on postural stability,
mean values across all four tests and all window positions
after were obtained for each subject for each window
length. These mean values were then used in the subse-
quent analysis, the results of which are presented in figure
5. It can be seen that no significant differences were
observed between groups for ML displacement, regardless
of the window size (Figure 5b). However, H
S
calculated
for both AP and RD displacement was significantly greater
for elderly subjects for both 5 and 10-s windows (Figure
5a and 5c).
Detrended Fluctuation Analysis (DFA)
Once again, mean values were obtained across all four
tests and all window positions were obtained for each
subject for each window length. These mean values were
then used in the subsequent analysis, with the results are
presented in figure 6. In contrast to the results for SDA
presented above, significant differences were observed
between groups for ML displacement for all three window
sizes, with significantly greater values of H
DFA
observed for
elderly subjects (Figure 6b). In respect to AP and RD dis-
placement, the only significant effect of age group on
H
DFA
was a decrease in elderly subjects for AP displace-
ment for the 10-s window length (Figure 6a and 6c).
Discussion
Sliding window effect
The sliding window analysis was performed in order to
identify the optimal time to start analysis. As shown in fig-
ure 3, H
S
decreased with time for all displacement direc-
tions for control subjects. A decrease in H
S
is indicative of
a more precisely controlled movement in that the value of
H
S
corresponds to the slope of the short-term of the log-
log plot of Δt and <Δx
2
>. This decrease in H
S
is indicative
of a more tightly controlled static posture where displace-
ments are smaller for a given time interval. Thus subjects
became more stable the longer they remained on the force
plate. In contrast, H
S
for elderly subjects decreased only
for AP and RD displacement direction, uniquely for the
2.5-s window. The absence of any effect for ML displace-
ment for elderly subjects was due to the increased variabil-
ity in H
S
for these subjects in comparison to control
subjects. Such an explanation is also true for the other dis-
placement directions.
Evolution of H
DFA
for anteroposterior (a), mediolateral (b), and resultant (c) displacementFigure 4
Evolution of H
DFA
for anteroposterior (a), medi-
olateral (b), and resultant (c) displacement. Data are
means and 95% confidence intervals. The x axes represent
time in seconds, while the y axes represent the estimation of
H
DFA
. The zero values on the x axes correspond to FC2,
while the x coordinate of each data point corresponds to the
centre of the data window.
time (s)
0
0.2
0.4
0.6
0.8
036912
AP
H
DFA
2.5 s Control
2.5 s Elderly
5 s Control
5 s Elderly
10 s Control
10 s Elderly
0.2
0.4
0.6
0.8
036912
ML
H
DFA
0
0.2
0.4
0.6
036912
RD
H
DFA
(a)
(b)
(c)
Journal of NeuroEngineering and Rehabilitation 2007, 4:12 />Page 8 of 12
(page number not for citation purposes)
The DFA method yielded similar results to those of the
SDA method in that time has a significant effect on H
DFA
.
However, in contrast to the results for H
S
, H
DFA
increased
with time. In addition, these results were evident for both
control and elderly subjects. These results were, however,
due to the initial value at FC2, which was much lower
than the subsequent values. Given this result it would be
worth starting any analysis from FC2 + 1 s in order to
remove any effect of time on H
DFA
. The interpretation of
H
DFA
depends on the values detected. Values of H
DFA
greater than 0.5 are indicative of a persistent times series,
with higher values due to a smoother time series, with a
corresponding decrease in variability [38]. As values of H
tend towards 1, the signal is smoother with a higher cor-
relation between successive points [39]. High values of
H
DFA
would, therefore, be indicative of increased postural
stability. Another interpretation is possible for H
DFA
for
lower values, whereby H
DFA
less than 0.5 is indicative of
an anti-persistent signal. For such data the variation
between successive points in the time series is more likely
to change direction than to continue in the same direc-
tion, thus reflecting a more tightly controlled time series.
Reliability analysis
In terms of reliability, the values reported varied accord-
ing to the window size, the displacement direction, and
the subject group, but did not vary with time. In other
words, the values of H
S
and H
DFA
for the initial part of the
signal were just as reliable as those for the later part where
greater postural stability was observed. In respect to the
effect of window size, higher ICC values were observed for
the 5-s and 10-s window lengths for both SDA and DFA
methods. Such a finding was expected given that previous
studies of diverse physiological and behavioral time series
have typically shown greater variability when less data
points are used. Eke and colleagues recommended using
time series with at least 2
12
(4096) data points due to the
unreliable results obtained with shorter time series [32].
However, recent results have demonstrated that, despite
an increased variability, time series as short as 2
8
(256)
points still produced acceptable results [40]. Furthermore,
the mean of four short time series of 256 points was
shown to provide a better estimate of H than a single time
series of 1024 points. The results of the reliability analysis
of the present study confirm the results of Delignières, in
that ICC values as high as 0.72 were obtained for 5-s time
series containing only 500 data points.
Given the low ICC values obtained for the 2.5-s window
length, all subsequent comparisons of reliability are dis-
cussed for only the 5 and 10-s windows. In respect to dif-
ferences in reliability for the two groups, it can be seen
that elderly subjects were far more reliable than were the
control subjects. The ICC values for elderly subjects were
consistently considered to be "fair to good", bordering on
"excellent" using the scale developed by Fleiss [41], with
values varying from 0.49 to 0.75. In contrast, the ICC val-
ues for the control subjects were consistently lower than
Table 2: Mean ICC values for Stabilogram Diffusion Analysis.
Anteroposterior Mediolateral Resultant
Window size (s) Control Elderly Control Elderly Control Elderly
2.5 0.18 0.55* 0.31 0.34 0.30 0.56*
5 0.29 0.54* 0.42 0.58* 0.43 0.62*
10 0.44
†
0.49 0.49 0.58 0.53 0.67*
Values are means calculated for all windows of each size.
*Significantly different from control subjects.
†Significantly different from 5-s window.
Table 3: Mean ICC values for Detrended Fluctuation Analysis.
Anteroposterior Mediolateral Resultant
Window size (s) Control Elderly Control Elderly Control Elderly
2.5 0.20
†
0.56*
†
0.27
†
0.34 0.24 0.54*
5 0.40
§
0.72*
§
0.41 0.52 0.32
§
0.56*
10 0.48 0.75*
§
0.52 0.62 0.43 0.68*
Values are means calculated for all windows of each size.
*Significantly different from control subjects.
†Significantly different from 5-s window.
§Significantly different from the SDA values reported in Table 2.
Journal of NeuroEngineering and Rehabilitation 2007, 4:12 />Page 9 of 12
(page number not for citation purposes)
those for the elderly group, ranging from 0.29 to 0.53.
Such differences could well be related to the calculation of
the ICC:
For heterogeneous subject groups, the between subject
variation would increase, thus increasing the ICC, as seen
for the elderly subject group. A homogenous subject
group would be expected to have less between subject var-
iation, and a resulting decrease in the ICC, as observed for
the control group.
In respect to the differences between the SDA and DFA
methods in terms of reliability, the DFA method generally
produced more reliable parameters for AP displacement,
with both ICC values that approached the 0.75 "excellent"
level of Fleiss [41] obtained for DFA for elderly subjects
for AP displacement. It should be stressed that ICC values
calculated for DFA and SDA analysis are only for very
short time series. It is likely that higher ICC values would
be obtained should longer time series be compared.
When the reliability results are compared with other stud-
ies, it is clear that clinical balance tests provide greater reli-
ability, with values as high as 0.99 [42]. However, as the
aim of the study is to develop a home-based assessment
that does not require the intervention of a third party, a
more realistic comparison is that made with other biome-
chanical measures of balance. In this respect, the ICC val-
ues observed are particularly encouraging, especially for
elderly subjects, when it is considered that no constraints
were imposed on the subjects in terms of foot position. In
one study that compared the reliability of SDA parame-
ters, ICC values ranged from 0.41 to 0.79 [43]. The lack of
constraint used in the present study was needed in order
to ensure that the results could be generalised to a home-
ICC
between subject variation within subject variation
be
=
−()
ttween subject variation
Differences in H
DFA
between control and elderly subjects for 2.5-s, 5-s, and 10-s window lengths for anteroposterior (a), mediolateral (b), and resultant (c) displacementFigure 6
Differences in H
DFA
between control and elderly sub-
jects for 2.5-s, 5-s, and 10-s window lengths for anter-
oposterior (a), mediolateral (b), and resultant (c)
displacement. Data are means and 95% confidence inter-
vals for all windows of each window length. *Significantly dif-
ferent from control subjects.
window length (s)
RD
0.20
0.30
0.40
0.50
0.60
0.70
2.5 5 10
H
DFA
Elderly
Control
*
AP
0.20
0.30
0.40
0.50
0.60
0.70
2.5 5 10
H
DFA
(a)
*
*
*
ML
0.20
0.30
0.40
0.50
0.60
0.70
2.5 5 10
H
DFA
(b)
(c)
Differences in H
S
between control and elderly subjects for 2.5-s, 5-s, and 10-s window lengths anteroposterior (a), mediolateral (b), and resultant (c) displacementFigure 5
Differences in H
S
between control and elderly sub-
jects for 2.5-s, 5-s, and 10-s window lengths antero-
posterior (a), mediolateral (b), and resultant (c)
displacement. Data are means and 95% confidence inter-
vals for all windows of each window length. *Significantly dif-
ferent from control subjects.
A
P
*
*
0.65
0.70
0.75
0.80
0.85
2.5 5 10
RD
*
*
0.65
0.70
0.75
0.80
0.85
2.5 5 10
H
S
H
S
M
L
0.65
0.70
0.75
0.80
0.85
2.5 5 10
H
S
window length (s)
Elderly
Control
(a)
(b)
(c)
Journal of NeuroEngineering and Rehabilitation 2007, 4:12 />Page 10 of 12
(page number not for citation purposes)
based study where it would be impossible to closely con-
trol the experimental protocol.
The effect of age on postural stability
It was expected that there would be underlying differences
between the two subject groups in terms of postural stabil-
ity. The results of the present study confirmed this
assumption for both SDA and DFA methods. Although
the two methods both detected differences between the
age groups, these differences were not the same for the
two methods. The SDA method identified differences in
AP displacement provided the window was at least 5-s
long. Elderly subjects had increased values of H
S
, which
are indicative of a less precisely controlled movement, as
outlined at the beginning of the discussion. In contrast,
no significant differences were observed for mediolateral
displacement using SDA. Elderly subjects also had
increased values of H
S
for resultant displacement for the 5-
s and 10-s windows. These differences were no doubt due
to the differences observed for AP displacement, which is
the greatest component of resultant displacement due to
the nature of the ankle and knee joints, which limit move-
ment in the mediolateral direction.
In respect to the differences between elderly and control
subjects identified by the DFA method, H
DFA
for medi-
olateral displacement was significantly higher for elderly
subjects than for the controls irrespective of window
length. As detailed at the start of the discussion section,
values of H
DFA
less than 0.5 are indicative of anti-persist-
ence, with lower values reflecting greater anti-persistence,
and thus a more closely posture. Elderly subjects were,
therefore, less stable than the control subjects for medi-
olateral displacement. In contrast, H
DFA
values for antero-
posterior displacement were lower for elderly subjects
than for control subjects, which is indicative of an
increased postural stability for elderly subjects in the AP
direction.
One interpretation of the two results could be that elderly
subjects control their movement in the AP direction more
precisely. A similar finding was reported by Norris and
colleagues for AP displacement, who identified lower DFA
values for elderly subjects at risk of falling [44]. Their
interpretation centred around the fact that H
DFA
values
were less than 0.5, and thus anti-persistent. The strategy
adopted by the elderly subjects was highly anti-persistent,
with the aim of reducing AP movement in order to main-
tain a stable posture.
In contrast to the results of the present study, Norris and
colleagues reported no differences in ML displacement
between control and elderly subjects. The contrasting
findings of the two studies could be due to the different
protocols used. In the present study subjects were free to
choose their own foot position, values were calculated for
analysis windows of 2.5, 5, and 10 s, and analysis com-
menced as soon as subjects had their two feet on the plat-
form. In contrast Norris and colleagues imposed a
standardised foot position, collected data for a 30-s time
period, and waited for five seconds after subjects were
positioned before beginning data collection. The lack of
differences observed may therefore have been due to the
imposed condition of a stable posture.
In respect to the differences observed between the SDA
and DFA methods, the contrasting findings are due to the
method used to analyse the time series. The SDA method
provides two estimations of the Hurst exponent, for the
short-term (H
S
) and long-term (H
L
) regions of the log-log
plot of Δt and <Δx
2
>. Given that it was not possible to
exploit the results for H
L
, the SDA method via H
S
provided
information that was only related to short-term oscilla-
tions. These results indicated persistence, as all values for
H
S
were greater than 0.5. In contrast, H
DFA
, which was
obtained for the whole time series was less than 0.5, thus
demonstrating anti-persistence. Thus, these two methods
provide complimentary information related to different
aspects of postural control for short-term and long-term
auto-correlations.
Recording duration
In respect to the minimum recording duration needed, a
5-s window appears sufficient. The 2.5-s window was not
sufficiently reliable, whereas reliability was similar for the
5-s and 10-s windows. Differences between subject groups
were also evident for both the 5-s and 10-s windows. If the
aim is to select the most non-invasive protocol, a 5-s win-
dow would be sufficient. It should be noted, however,
that decreasing the window length introduces a bias into
both H
S
and H
DFA
estimations whereby H
S
is underesti-
mated and H
DFA
is overestimated for short window
lengths. Such a finding means that comparison between
different populations and different studies would not be
possible for different window lengths. However, in terms
of a longitudinal home-based study, although a bias
would be present for 5-s recordings, the underestimation
of H
S
and the overestimation of H
DFA
for short window
lengths would not pose a problem for comparison of val-
ues between different testing sessions for the same indi-
vidual given that the measures are reliable. The ideal start
point for the analysis would one second after stepping
onto the force plate, in order to remove the initial values
that were markedly different from subsequent values due
to the perturbation induced by the step.
Conclusion
The SDA and DFA methods were both able to identify dif-
ferences in postural stability between control and elderly
subjects for time series as short as 5 s. In addition, meas-
Journal of NeuroEngineering and Rehabilitation 2007, 4:12 />Page 11 of 12
(page number not for citation purposes)
urements proved to be reliable across testing sessions,
with DFA the more robust method for AP displacement.
Both methods, as well as providing evidence of underly-
ing postural control strategies, appear to be well-suited to
a non-invasive longitudinal assessment of balance.
Competing interests
The author(s) declare that they have no competing inter-
ests.
Authors' contributions
HA and MA carried out the data collection and data anal-
ysis. DH participated in the conception, design, and coor-
dination of the study, performed the statistical analysis,
and drafted the manuscript. VM participated in the design
and coordination of the study. MD participated in the
design and coordination of the study. JD participated in
the conception of the study, and its design and coordina-
tion. All authors read and approved the final manuscript.
Acknowledgements
This study was undertaken as part of the PARAChute research project
(Personnes Âgées et Risque de Chute), which was supported in part by the
French Ministry of Research (Grant 03-B-254), the European Social Fund
(Grant 3/1/3/4/07/3/3/011), the European Regional Development Fund
(Grant 2003-2-50-0014), CRCA (Grant E200308251), and INRIA (Grant
804F04620016000081).
References
1. Comité Français d'Education pour la Santé: Les clés du " bien vieil-
lir " : prévention des chutes chez les seniors. Caisse Nationale
de l'Assurance Maladie des Travailleurs Salariés; 2001:20.
2. Brauer SG, Burns YR, Galley P: A prospective study of laboratory
and clinical measures of postural stability to predict commu-
nity-dwelling fallers. J Gerontol A Biol Sci Med Sci 2000,
55:M469-476.
3. Maki BE, Holliday PJ, Topper AK: A prospective study of postural
balance and risk of falling in an ambulatory and independent
elderly population. J Gerontol 1994, 49:M72-84.
4. Raiche M, Hebert R, Prince F, Corriveau H: Screening older adults
at risk of falling with the Tinetti balance scale. Lancet 2000,
356:1001-1002.
5. Tromp AM, Pluijm SM, Smit JH, Deeg DJ, Bouter LM, Lips P: Fall-risk
screening test: a prospective study on predictors for falls in
community-dwelling elderly. J Clin Epidemiol 2001, 54:837-844.
6. Rubenstein LZ, Josephson KR: The epidemiology of falls and syn-
cope. Clin Geriatr Med 2002, 18:141-158.
7. Nevitt M, Cummings S, Kidd S, Black D: Risk factors for recurrent
nonsyncopal falls. A prospective study. JAMA 1989,
261:2663-2668.
8. Vellas BJ, Wayne SJ, Romero L, Baumgartner RN, Rubenstein LZ,
Garry PJ: One-leg balance is an important predictor of injuri-
ous falls in older persons. J Am Geriatr Soc 1997, 45:735-738.
9. Wood BH, Bilclough JA, Bowron A, Walker RW: Incidence and
prediction of falls in Parkinson's disease: a prospective multi-
disciplinary study. J Neurol Neurosurg Psychiatry 2002, 72:721-725.
10. Allum JH, Bloem BR, Carpenter MG, Honegger F: Differential diag-
nosis of proprioceptive and vestibular deficits using dynamic
support-surface posturography. Gait Posture 2001, 14:217-226.
11. Gill J, Allum JH, Carpenter MG, Held-Ziolkowska M, Adkin AL, Hon-
egger F, Pierchala K: Trunk sway measures of postural stability
during clinical balance tests: effects of age. J Gerontol A Biol Sci
Med Sci 2001, 56:M438-447.
12. Lord SR, Menz HB: Visual contributions to postural stability in
older adults. Gerontology 2000, 46:306-310.
13. Mathias S, Nayak U, Isaacs B: Balance in elderly patients: the
"get-up and go" test. Arch Phys Med Rehabil 1986, 67:387-389.
14. Shumway-Cook A, Baldwin M, Polissar NL, Gruber W: Predicting
the probability for falls in community-dwelling older adults.
Phys Ther 1997, 77:812-819.
15. Tinetti ME, Speechley M, Ginter SF: Risk factors for falls among
elderly persons living in the community. N Engl J Med 1988,
319:1701-1707.
16. Lord S, Clark R, Webster I: Postural stability and associated
physiological factors in a population of aged persons. J Geron-
tol 1991, 46:M69-76.
17. Murray MP, Seireg AA, Sepic SB: Normal postural stability and
steadiness: quantitative assessment. J Bone Joint Surg Am 1975,
57:510-516.
18. Thapa PB, Gideon P, Brockman KG, Fought RL, Ray WA: Clinical
and biomechanical measures of balance as fall predictors in
ambulatory nursing home residents. J Gerontol A Biol Sci Med Sci
1996, 51:M239-246.
19. Doussot M, Hewson D, Duchêne J: A remote monitoring system
for assessing balance quality. 3rd European Medical and Biological
Engineering Conference (EMBEC): Advancement of Medicine and Health
Care through Technology; 20–25 November 2005.
20. Collins JJ, De Luca CJ: Upright, correlated random walks: A sta-
tistical-biomechanics approach to the human postural con-
trol system. Chaos 1995, 5:57-63.
21. Riley MA, Wong S, Mitra S, Turvey MT: Common effects of touch
and vision on postural parameters. Exp Brain Res 1997,
117:165-170.
22. Laughton CA, Slavin M, Katdare K, Nolan L, Bean JF, Kerrigan DC,
Phillips E, Lipsitz LA, Collins JJ: Aging, muscle activity, and bal-
ance control: physiologic changes associated with balance
impairment. Gait Posture 2003,
18:101-108.
23. Delignières D, Deschamps T, Legros A, Caillou N: A methodologi-
cal note on nonlinear time series analysis: is the open- and
closed-loop model of Collins and De Luca (1993) a statistical
artifact? J Mot Behav 2003, 35:86-97.
24. Duarte M, Zatsiorsky VM: Long-range correlations in human
standing. Physics Letters A 2001, 283:124-128.
25. Carroll JP, Freedman W: Nonstationary properties of postural
sway. J Biomech 1993, 26:409-416.
26. Harris GF, Riedel SA, Matesi D, Smith P: Standing postural stabil-
ity assessment and signal stationarity inchildren with cere-
bral palsy. IEEE Transactions on Rehabilitation Engineering 1993,
1:35-42.
27. Peterka RJ: Postural control model interpretation of stabilo-
gram diffusion analysis. Biol Cybern 2000, 82:335-343.
28. Mandelbrot B, Van Ness J: Fractional brownian motion, frac-
tional noses and applications. SIAM Review 1968, 10:422-437.
29. Collins JJ, De Luca CJ, Burrows A, Lipsitz LA: Age-related changes
in open-loop and closed-loop postural control mechanisms.
Exp Brain Res 1995, 104:480-492.
30. Collins JJ, De Luca CJ: Open-loop and closed-loop control of
posture: a random-walk analysis of center-of-pressure tra-
jectories. Exp Brain Res 1993, 95:308-318.
31. Kantz H, Schreiber T: Nonlinear time series analysis 2nd edition. Cam-
bridge, UK: Cambridge University Press; 2004.
32. Eke A, Herman P, Kocsis L, Kozak L: Fractal characterization of
complexity in temporal physiological signals. Physiol Meas
2002, 23:R1-38.
33. International Society of Biomechanics [http://
www.isbweb.org/software/movanal/stamp]
34. Peng CK, Havlin S, Stanley HE, Goldberger AL: Quantification of
scaling exponents and crossover phenomena in nonstation-
ary heartbeat time series. Chaos 1995, 5:82-87.
35. Tabachnick BG, Fidell LS: Using multivariate statistics 4th edition. Need-
ham Heights, MA, USA: Allyn and Bacon; 2001.
36. Shrout PE, Fleiss JL: Intraclass correlations: uses in assessing
rater reliability. Psychol Bull 1979, 2:420-428.
37. Hopkins W: Measures of reliability in sports medicine and sci-
ence. Sports Med 2000, 30:1-15.
38. Goldberger AL, Amaral LA, Hausdorff JM, Ivanov P, Peng CK, Stanley
HE: Fractal dynamics in physiology: alterations with disease
and aging. Proc Natl Acad Sci USA 2002, 99(Suppl 1):2466-2472.
39. Eke A, Herman P, Bassingthwaighte JB, Raymond GM, Percival DB,
Cannon M, Balla I, Ikrenyi C: Physiological time series: distin-
Publish with BioMed Central and every
scientist can read your work free of charge
"BioMed Central will be the most significant development for
disseminating the results of biomedical research in our lifetime."
Sir Paul Nurse, Cancer Research UK
Your research papers will be:
available free of charge to the entire biomedical community
peer reviewed and published immediately upon acceptance
cited in PubMed and archived on PubMed Central
yours — you keep the copyright
Submit your manuscript here:
/>BioMedcentral
Journal of NeuroEngineering and Rehabilitation 2007, 4:12 />Page 12 of 12
(page number not for citation purposes)
guishing fractal noises from motions. Pflugers Arch 2000,
439:403-415.
40. Delignières D, Torre K, Lemoine L: Methodological issues in the
application of monofractal analyses in psychological and
behavioral research. Nonlinear Dynamics in Psychology and Life Sci-
ence 2005 in press.
41. Fleiss JL: The design and analysis of clinical experiments New York:
Wiley; 1986.
42. Karen W Hayes MEJ: Measures of adult general performance
tests: The Berg Balance Scale, Dynamic Gait Index (DGI),
Gait Velocity, Physical Performance Test (PPT), Timed
Chair Stand Test, Timed Up and Go, and Tinetti Perform-
ance-Oriented Mobility Assessment (POMA). Arthritis Care &
Research 2003, 49:S28-S42.
43. Chiari L, Cappello A, Lenzi D, Della Croce U: An improved tech-
nique for the extraction of stochastic parameters from sta-
bilograms. Gait Posture 2000, 12:225-234.
44. Norris JA, Marsh AP, Smith IJ, Kohut RI, Miller ME: Ability of static
and statistical mechanics posturographic measures to distin-
guish between age and fall risk. J Biomech 2005, 38:1263-1272.