báo cáo hóa học: " Effect of predictive sign of acceleration on heart rate variability in passive translation situation: preliminary evidence using visual and vestibular stimuli in VR " ppt
Bạn đang xem bản rút gọn của tài liệu. Xem và tải ngay bản đầy đủ của tài liệu tại đây (403.09 KB, 10 trang )
BioMed Central
Page 1 of 10
(page number not for citation purposes)
Journal of NeuroEngineering and
Rehabilitation
Open Access
Research
Effect of predictive sign of acceleration on heart rate variability in
passive translation situation: preliminary evidence using visual and
vestibular stimuli in VR environment
Hiroshi Watanabe*, Wataru Teramoto and Hiroyuki Umemura
Address: Institute for Human Science and Biomedical Engineering, National Institute of Advanced Industrial Science and Technology, Ikeda,
Osaka, Japan
Email: Hiroshi Watanabe* - ; Wataru Teramoto - ; Hiroyuki Umemura -
* Corresponding author
Abstract
Objective: We studied the effects of the presentation of a visual sign that warned subjects of
acceleration around the yaw and pitch axes in virtual reality (VR) on their heart rate variability.
Methods: Synchronization of the immersive virtual reality equipment (CAVE) and motion base
system generated a driving scene and provided subjects with dynamic and wide-ranging depth
information and vestibular input. The heart rate variability of 21 subjects was measured while the
subjects observed a simulated driving scene for 16 minutes under three different conditions.
Results: When the predictive sign of the acceleration appeared 3500 ms before the acceleration,
the index of the activity of the autonomic nervous system (low/high frequency ratio; LF/HF ratio)
of subjects did not change much, whereas when no sign appeared the LF/HF ratio increased over
the observation time. When the predictive sign of the acceleration appeared 750 ms before the
acceleration, no systematic change occurred.
Conclusion: The visual sign which informed subjects of the acceleration affected the activity of the
autonomic nervous system when it appeared long enough before the acceleration. Also, our results
showed the importance of the interval between the sign and the event and the relationship
between the gradual representation of events and their quantity.
Background
Recent advances in video display technology have pro-
duced large, high-definition displays that can produce a
strong sense of the viewer's own motion (vection) with
only visual input that lacks any vestibular input. This
dynamic environment differs from real-world experiences
in which various senses are stimulated simultaneously.
We therefore believe that investigation of the effects of
such an environment on the human is important for
establishing a safe video presentation environment. In the
real world, too, recent growth in transportation facilities is
presenting us with a great increase in opportunities to ride
in vehicles as passive passengers. It also means that pas-
sengers will more often be subjected to high speeds and
extraordinary accelerations over long periods of time. We
therefore believe that the development of technology for
reducing the psychological load on travelers is important
to maintaining comfort in public transportation. These
two conditions, vection from exposure to moving images
and riding as a passenger, share the common point of the
Published: 29 September 2007
Journal of NeuroEngineering and Rehabilitation 2007, 4:36 doi:10.1186/1743-0003-4-36
Received: 11 April 2006
Accepted: 29 September 2007
This article is available from: />© 2007 Watanabe et al; licensee BioMed Central Ltd.
This is an Open Access article distributed under the terms of the Creative Commons Attribution License ( />),
which permits unrestricted use, distribution, and reproduction in any medium, provided the original work is properly cited.
Journal of NeuroEngineering and Rehabilitation 2007, 4:36 />Page 2 of 10
(page number not for citation purposes)
body being passively subjected to motion. Passive move-
ment differs from active movement in the control over the
means of motion is not initiated in the brain of the pas-
senger. However, Griffin [1] has shown that observers
who cannot control their own movement, such as passen-
gers in a vehicle, mainly attempt to use visual information
to predict their motion. Naturally, the prediction often
fails, and the contradictions in sensory feed-back that
often occur at such times may cause feelings of discom-
fort. We can therefore expect that the psychological bur-
den on the passenger could be suppressed by providing
information that would supplement the prediction proc-
ess. This approach has led to a number of reports concern-
ing the effectiveness of 'prediction' with respect to the
effects on the human body of virtual reality (VR) scenes
experienced passively. Lin et al. [2] used a combined
motion base mechanism and immersive VR system to
present test subjects with transportation scenery. The
scenery was presented in two ways. In one, visual points
followed the course of the road; in the other, the visual
points moved independently of the road. They reported
that the observers' prediction of their own motion from
the road course affected the comfort of their VR experi-
ence. In addition, [3] and [4] have attempted to reduce the
discomfort produced by a VR environment by continu-
ously providing a guide stimulus that draws attention to
the direction of motion in a 3D VR space. The work we
report here broadly follows the previous research para-
digm, but our objective is to verify the possibility of affect-
ing the activation state of the autonomic nervous system
by presenting predictive information only when accelera-
tion will occur, rather than constantly signaling the direc-
tion of movement to the observer.
There have been many proposals to quantitatively meas-
ure the effects of VR content using physiological indices
such as the electrocardiogram, electrogastrograph, and
galvanic skin response. The advantages of using physio-
logical indices to understand the physical condition
include a relatively light burden on the test subject during
measurement and the ability to detect fluctuations over
small time intervals. Relations between such indices and
responses to dynamic environments have been reported
in recent years (lowering of body temperature [5], visu-
ally-induced instability of center of gravity and activity of
the autonomic nervous system [6], nausea and autonomic
nervous system activity caused by excessive camera move-
ment in motion pictures [7], and vestibular Coriolis stim-
ulation [8]). In particular, results on the relation of a
frequency analysis of changes in heart rate obtained from
an electrocardiogram to autonomic nervous system activ-
ity have been pointed out since the 1980s, and there have
been previous attempts to quantitatively measure the
autonomic nervous system activity of test subjects in a
dynamic environment [7,9-11]. The original approach to
the relation between change in heart rate and autonomic
nervous system activity was proposed by Akselrod et al.
[12], who suggested that the low-frequency component of
the change in heart rate reflects the activation state of both
the sympathetic nervous system and parasympathetic
(vagal) nervous system, and the high-frequency compo-
nent reflects the activity of only the parasympathetic nerv-
ous system. Furthermore, the activity levels of the
sympathetic nervous system and the parasympathetic
nervous system exhibit a trade-off relationship, so the
possibility of estimating the state of sympathetic nervous
system activity by calculating the power ratio of the high-
frequency and low-frequency components was consid-
ered. A relation between autonomic nervous system activ-
ity and psychological load has been suggested, and the use
of that measure as an index for psychological load in a VR
environment has been proposed a number of times in
previous research. Of course there are many difficulties
involved in determining the correspondence between this
index and intrinsic mental states, but it is believed that
there has been sufficient discussion on combining the
data with questionnaire results to produce time-series
data on inner states [13].
We measured the heart rate of test subjects as a time series
while they were experiencing a driving simulator that
combined a motion base and an immersive VR system.
We used the heart rate to infer the activity state of the
autonomic nervous system. Our main objective was to
elucidate the effect of the presence or absence of a visual
sign that predicts the direction of movement on the activ-
ity of the autonomic nervous system. The psychological
and physiological states of the test subjects under condi-
tions that produce VR sickness or motion sickness are out-
side the scope of this research. We created VR content free
of movement information that produces conflict between
the vestibular system and the visual system and presented
the content to the test subjects in an environment in
which VR sickness is not expected to occur. This procedure
is designed to investigate the relation between signs that
predict the direction of movement and the activity of the
autonomic nervous system in a situation that approxi-
mates an actual motion scenario as closely as possible.
Methods
Subjects
Twenty-two university students participated in the experi-
ments as paid volunteers, and none of them knew about
the hypothesis of this study. Nine male subjects (23.8 ±
1.9 years) and 13 female subjects (24.8 ± 3.0 years) were
used. Subjects recruited for this study underwent visual,
vestibular, auditory, and cognitive screenings for undiag-
nosed problems that would prevent them from complet-
ing the study. We also asked subjects to fill out a
questionnaire concerning physical condition and motion
Journal of NeuroEngineering and Rehabilitation 2007, 4:36 />Page 3 of 10
(page number not for citation purposes)
sickness prior to the experiments. The five questions on
the questionnaire were, 1) Do you have a hangover?, 2)
Did you have enough sleep last night?, 3) How often do
you drive? (every day, sometimes, never), 4) How often
do you experience car sickness? (often, sometimes, often
in childhood, never), and 5) Have you ever seen a doctor
for dizziness? Our study was approved by the Research
Ethics Committee of the National Institute of Advanced
Industrial Science and Technology, and the experiments
were undertaken with the informed written consent of
each subject.
Apparatus
CAVE
A 3D display was presented by an immersive virtual reality
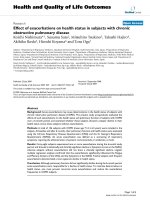
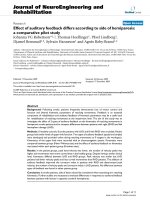
system (CAVE, EVL at the University of Illinois, Figure 1).
This system consisted of four 3 × 3 m screens (front, floor,
and two sides) and stereo displays were projected on these
screens at a 40-Hz refresh rate. Subjects observed the 3D
display wearing polarized glasses, and the projection of
the display was adjusted to their head position using a
head tracker mounted on the glasses at a 1000-Hz sam-
pling rate. A graphics workstation (Onyx/Infinite Reality,
Silicon Graphics Inc.) generated the graphics display and
controlled the motion base unit (see next section). Using
this kind of immersive virtual reality system makes it pos-
sible to present a 3D visual field that includes almost the
entire front, left, right, and ground surface visual fields.
The optical flow with respect to the peripheral vision in
particular can provide the subject with a strong sense of
his or her own motion (vection) [14,15]. We can therefore
expect to provide the subject with a stronger moving scen-
ery simulation.
Motion Base System
Vestibular information synchronized with the display was
generated by the motion base system (Mitsubishi Preci-
sion Inc.). This system was set up under the floor of CAVE
(Figure 1) and could provide arbitrary rotation around
three axes with six electromotive actuators (maximum
angle of rotation: ± 12° around yaw, pitch, and roll). The
acceleration and deceleration for the forward direction
during driving were represented by the transformed angle
around the pitch axis, and rotation in the driving plane
was represented by the transformed angle around the yaw
axis.
Data Analysis
In this section we described the method of electrocardio-
gram recording and defined the index of activity of the
autonomic nervous system and, finally, summarized the
relationship between the index and the activity of the
autonomic nervous system that was introduced in previ-
ous studies.
An electrocardiogram (ECG) was measured from a pair of
Ag-AgCl electrodes placed on the chests of subjects
(MP150, BIOPAC Systems Inc.). All analog signals were
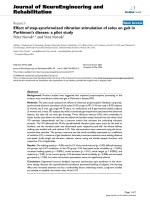
CAVE and motion base systemFigure 1
CAVE and motion base system. An immersive virtual reality system with four screens (front, floor, and two sides: 3 × 3 m)
provided the subjects with monolithic stereoscopic graphics crossing multiple screens. The motion base system set up under
the floor of CAVE made vestibular stimuli and synchronized them with the display.
Journal of NeuroEngineering and Rehabilitation 2007, 4:36 />Page 4 of 10
(page number not for citation purposes)
amplified and digitized at a 1-kHz sampling rate (12-bit
resolution) using a telemeter (SYNACT-MT11,
Nihondenki Inc.) and stored on a hard disk for later anal-
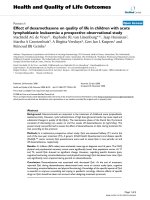
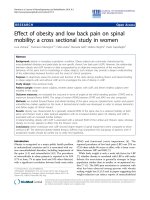
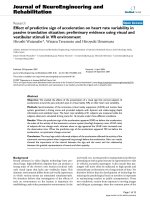
ysis (PC-MA10TEZE65J9, NEC). We first detected the
peaks, R waves, from approximately sixteen minutes of
ECG data. We then calculated the time interval from one
R wave to the next (Figure 2a). The set of these intervals,
which we called "R-R intervals," shows the heart rate vari-
ability (HRV) (Figure 2b). Many previous studies have
suggested that the spectral parameters derived from FFT
algorithm applied to HRV relate to the activity of the auto-
nomic nervous system based on an antagonistic function
between the sympathetic and parasympathetic nervous
systems. In the frequency domain, HRV often has two
principle spectral components. The low frequency (LF)
component (0.05–0.15 Hz) is linked to the sympathetic
modulation, but also includes some parasympathetic
influence; the high frequency (HF) spectral band (0.15–
0.4 Hz) reflects parasympathetic activity [16,17] (Figure
2c). Thus, the ratio of the LF and HF spectral components
(the LF/HF ratio) is an index of the activity ratio of the
sympathetic and parasympathetic nervous systems; a high
value means the dominance of the sympathetic system
and a low value means the dominance of the parasympa-
thetic system.
Procedure
Simulated Driving Course
The virtual driving course that is presented to the subject
was created with the following constraints. Changes in
forward velocity consist of a recurring block of four
events: acceleration, constant velocity, deceleration, con-
stant velocity. The time intervals for the four events are
28.5 ± 5.7 seconds. The constant velocity is determined at
random in the range from 10 km/h to 70 km/h. Turning
events occur every 23.5 ± 4.7 seconds, selected randomly
in the range of plus or minus 4.5 degrees. The turning
direction, left or right, is reversed for each turning event.
There is no relation between the acceleration or decelera-
tion events and the turning events.
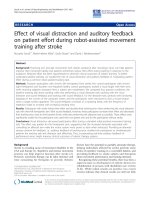
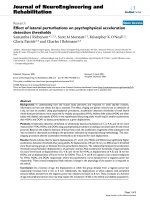
The timing and degree of acceleration, deceleration and
turns were all set once according to the constraints
described above. The driving schedule was set prior to the
experiment, and all of the subjects experienced the same
driving schedule. The acceleration, velocity, z position,
and x position of the simulated driving schedule are
shown in Figure 3. The subjects experienced the same
driving schedule under the three conditions described
below, with about 30 minutes rest between sessions.
When the entire experiment was over, the subjects were
asked about the sameness of the driving course under the
three conditions. None of the subjects noticed that the
course was the same in each case.
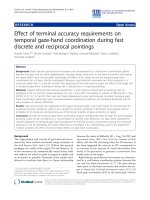
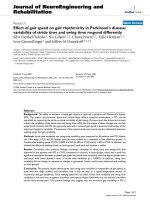
Four hundred rectangular parallelepipeds (0.25 × 0.25 ×
(0.5–2) m) were randomly arranged along the driving
course as obstacles. They roughly, though not completely,
informed observers of the driving course. The parallelepi-
peds were placed on either side of the invisible course,
and the virtual automobile never collided with them. Ran-
dom dot textures were mapped to the parallelepipeds and
the world plane to emphasize depth perception. An exam-
ple of what observers saw is shown in Figure 4.
Observation Conditions
The subjects experienced three observation conditions in
random order: no signs, signs at 750-ms intervals, and
signs at 3500-ms intervals. With no signs, observers sat in
the chair locked on the motion base and experimenters
presented both visual and vestibular information. Sub-
jects observed the stimuli for approximately sixteen min-
utes. With the 750-ms and 3500-ms interval conditions,
subjects observed the same stimuli as with no signs but
Example of ECG data and R wave (a), R-R trendgram (b), and FFT results from R-R trendgram (c)Figure 2
Example of ECG data and R wave (a), R-R trendgram (b), and
FFT results from R-R trendgram (c).
0 10 20 30 40 50 60 70 80 90
0.7
0.75
0.8
0.85
0.9
0.95
Time (seconds)
R-R interval (seconds)
0 0.2 0.4 0.6 0.8 1
0
200
400
600
800
1000
Frequency (Hz)
Power (msec
2
)
R-R
Interval
LF
Component
HF
Component
a
b
c
Journal of NeuroEngineering and Rehabilitation 2007, 4:36 />Page 5 of 10
(page number not for citation purposes)
were presented with signs that warned of acceleration or
rotation 750 or 3500 ms before each event. The signs were
triangles pointing up, down, right, and left for accelera-
tion, deceleration, right rotation, and left rotation, respec-
tively. Subjects were informed of the meaning of the signs
before the experiments. The sides of the triangles were 50
cm long, and they appeared (center of mass) at 75 cm
above the floor where events occurred. They moved
toward observers and disappeared before colliding with
observers (Figure 4). Subjects held a joystick and we asked
them to report the direction of the triangles using with the
joystick in the 750-ms and 3500-ms intervals and to
report the direction of movement of the seat when no
signs were present to motivate subjects to participate.
After completion of all of the experiments, we explained
the differences among the three sign conditions to the
subjects and asked them which condition (no sign, 750-
ms, or 3500-ms) was the most unpleasant.
Motion sickness questionnaire
At the end of each observation, we asked the subjects
about whether they felt motion sickness. The question-
naire was based on the Graybiel score, a multi-symptom
checklist for assessing motion sickness symptomatically
[18]. It consisted of seven questions about nausea, sweat-
ing, salivation, level of consciousness, headaches, vertigo,
and changes in complexion. The subjects rated their rela-
tive condition for each area on a scale of 0 – 5 (0 = none,
5 = strongly present). The total possible scores ranged
from 0 to 50. Higher scores reflected more severe symp-
toms.
Sample views with and without predictive signsFigure 4
Sample views with and without predictive signs. Scat-
tered objects showed the subjects their rough trajectory.
Predictive signs appeared at the position of the acceleration
(a), moved toward the subjects (b), and were visible until
they collided with the subjects (c).
a
a
b
c
Simulated driving scheduleFigure 3
Simulated driving schedule. From top to bottom: accel-
eration, velocity, z position, and x position. Every subject
observed the same driving course.
0 200 400 600 800 1000
-2
-1
0
1
2
Acceleration (m/s/s)
0 200 400 600 800 1000
0
20
40
60
80
Velocity (km/s)
0 200 400 600 800 1000
0
5000
10000
15000
Z position (m)
0 200 400 600 800 1000
-50
0
50
100
Time (second)
X position (m)
Journal of NeuroEngineering and Rehabilitation 2007, 4:36 />Page 6 of 10
(page number not for citation purposes)
Results
Pre-experiment questionnaire on subject attributes,
including motion sickness sensitivity
Prior to the experiment, all of the subjects filled out a
questionnaire asking if they had a hangover, insufficient
sleep, driving experience, tendency to car sickness, or
medical conditions involving dizziness. None of the sub-
jects complained of hangover, insufficient sleep or dizzi-
ness on the day of the experiments. None of the subjects
had experienced dizziness that required medical atten-
tion. Concerning driving experience, four of the 21 sub-
jects responded that they drove almost every day, seven
reported driving occasionally and ten said they did not
drive at all. Eight subjects reported no sensitivity to
motion sickness, eight reported occasional sensitivity,
none reported high sensitivity and four reported sensitiv-
ity in childhood. Driving experience and sensitivity to
motion sickness results are listed by subject and by sex in
Table 1.
Self-assessment Graybiel score at the end of each session
In these experiments, the subjects were evaluated for
motion sickness with seven items of the Graybiel score
after each of the three sessions. The items were nausea,
cold sweat, salivation, level of awareness, headache, dizzi-
ness, and pallor. During the experiments, one female sub-
ject reported 'severe' motion sickness immediately after
the first observation (the session was ended immediately,
so no Graybiel score could be given). That subject did not
participate in the rest of the experiment. All of the other
subjects completed the observation and almost none of
them reported a feeling of motion sickness. Two of the 21
subjects reported the lowest degree of nausea and one
subject reported the lowest degree of headache once in the
second stage of the experiment. The observation condi-
tions were different for each of those three subjects.
Effect of observation conditions on overall activity of
autonomic nervous system
We calculated the LF/HF ratio using the data for each trial
(approximately sixteen minutes) of each observation con-
dition. The average LF/HF ratio of all subjects under the
three observation conditions is shown in Figure 5. The LF/
HF ratio was the highest under the no-sign condition
among the three observation conditions. A one-way
within-group analysis of the variance (three observation
conditions, ANOVA) was conducted on the LF/HF ratio.
ANOVA revealed the main effect of the observation condi-
tion (p < 0.01) and the least significant difference (LSD)
multiple comparison also revealed a significant difference
between the no-sign condition and the 750-ms interval
condition (p < 0.05), and the no-sign condition and the
3500-ms interval condition (p < 0.05).
LF/HF ratio as a function of observation time
In this section, we discuss the activity of the autonomic
nervous systems of subjects and how it changed for each
observation condition. We obtained approximately six-
Table 1: Subject attributes and the variation in LF/HF ratio
Name Age Sex Driving frequency Motion sickness sensitivity No sign 750-Intv. 3500-Intv.
OTM 23 M Everyday Childhood - - -
SSK 21 M Occasionally None + + +
UEN 22 M None Childhood + + -
HOK 28 M Everyday None + - -
KWN 29 M None Occasionally + + -
SUG 23 M None Childhood + - +
JUK 21 M Occasionally Occasionally + - -
KTM24MNone None +++
MYS 28 M None Occasionally - - +
NGW 27 M Occasionally None + - -
SAT 28 M Occasionally None + - +
SMY23MNone None ++-
STO26FNone None +++
TCT 23 F Occasionally Occasionally - + -
TJT 23 F Everyday Occasionally - + +
UNO 25 F None Childhood + - +
YMJ 21 F Occasionally Occasionally + - +
YMS 24 F None Occasionally + - +
YNG 23 F Everyday None - + -
YSR 22 F None Occasionally + - +
NSG 27 F Occasionally Occasionally + + -
Name corresponds to the each titles of Figure 6.
Sex M = male, F = female
No sign, 750-Intv, and 3500-Intv + = Increase of LF/HF ratio, - = Decrease of LF/HF ratio from the first phase to the last phase.
Journal of NeuroEngineering and Rehabilitation 2007, 4:36 />Page 7 of 10
(page number not for citation purposes)
teen minutes of heart rate data for each observation con-
dition and calculated the changing of the LF/HF ratio by
moving the six-minute rectangular window. The change of
the LF/HF ratio for each subject under the three observa-
tion conditions is shown in Figure 6, where each point
plotted in the graphs shows the LH/HF ratio derived from
the six-minute window (e. g. Phase 1 represented the LF/
HF ratio from time = 0 to 6, Phase 2 represented the LF/
HF ratio from time = 1 to 7, etc.). As a qualitative feature
of the results, the no-sign condition often seemed to cause
the LF/HF ratio to increase with time. The difference in the
LF/HF ratio between phases 1 and 10 showed that sixteen
of the twenty-one subjects had their LF/HF ratios increase
with time under the no-sign condition, and ten had an
increase under the 750-ms condition, and eleven had an
increase under the 3500-ms condition (however the χ
2
test did not show a significant difference about the distri-
bution of the positive/negative value of increments).
The subject information obtained prior to the experi-
ments and the changes in the LF/HF ratios are presented
in Table 1. The relations between change in the LF/HF
ratios and subject sex, driving experience and motion sick-
ness sensitivity are summarized in Tables 2, 3 and 4. Each
table cell represents the number of subjects for whom the
LF/HF ratio increased for the compared items (in Tables 3
and 4, the results for the subjects responding with "None"
are compared with the results for subjects responding
with either "Every day" or "Occasionally"). The results
show that the percentages of LF/HF ratio increase were the
highest under the 'No sign' condition for female subjects
in Table 2 and the 'no driving experience' condition in
Table 3. The LF/HF ratio of 90% for subjects with no driv-
ing experience is particularly striking (Table 3). The
increase in the LF/HF ratio for persons who responded
that they have not experienced motion sickness in ques-
tionnaire (Table 4) decreases in order of 'No sign', '750-
Intv', and '3500-Intv' is also a very interesting result. How-
ever, the data in each cell is based on about 10 subjects at
most, so the element of noise in the results must be con-
sidered, and the relationship between the subject
attributes and the variation in LF/HF ratio should be fur-
ther investigated with experimental data from a larger
number of subjects.
The averaged LF/HF change data for each subject is shown
in Figure 7. A two-way within-group analysis of variance
(3 observation conditions × 10 phases, ANOVA) was con-
ducted on the LF/HF ratio. The ANOVA revealed the main
effect of phase(p < 0.001), but did not show the main
effect of observation condition or the interaction between
these two main effects. In a simple assessment of impres-
sions conducted after the experiments, all of the subjects
responded that the session with the 'No sign' condition
was more unpleasant than the session with the 3500-ms
condition. However eleven subjects reported after the
experiment that they felt uncomfortable about the inter-
val between the appearance of the signs and the accelera-
tion under the 750-ms condition. We guessed that such a
short interval causes subjects to be insufficiently ready for
acceleration, and the accumulation of such a mental load-
ing over time might have had a noise effect on the statisti-
cal analysis concerning the function of the predictive sign.
Thus, as ad hoc analysis, we ignored the data of the 750-
ms interval condition and conducted an ANOVA (2 obser-
vation conditions × 10 phases, ANOVA). The ANOVA
revealed a significant tendency of the main effect of phase
(p < 0.1) and observation condition (p < 0.1) and a signif-
icant interaction between observation and phase (p <
0.01). LSD multiple comparison also revealed a signifi-
cant difference between the two observation conditions
Averaged LF/HF ratio of all subjects under three observation conditionsFigure 5
Averaged LF/HF ratio of all subjects under three
observation conditions. Averaged LF/HF ratio from R-R
interval of full observation period; error bar represents 1 SE.
No sign 750-ms Interval 3500-ms Interval
0
0.5
1
1.5
2
2.5
3
Observation condition
LF/HF ratio
Table 2: Gender and percentage of increase of LF/HF ratio
No sign 750-Intv. 3500-Intv.
Male 0.83 0.42 0.42
Female 0.67 0.56 0.67
Table 3: Driving frequency and percentage of increase of LF/HF
rati o
No sign 750 3500
None 0.90 0.50 0.70
Yes 0.64 0.64 0.36
"Yes" including "everyday" and "occasionally" in Table 1.
Journal of NeuroEngineering and Rehabilitation 2007, 4:36 />Page 8 of 10
(page number not for citation purposes)
Change of LF/HF ratio for individual subjectsFigure 6
Change of LF/HF ratio for individual subjects. LF/HF ratio as a function of time under three conditions for each subject
0 5 10
0.5
1
1.5
OTM
No sign
750-ms Int.
3500-ms Int.
0 5 10
0
5
10
SSK
0 5 10
0
0.5
1
1.5
UEN
0 5 10
2
4
6
8
HOK
0 5 10
0
0.5
1
1.5
KWN
0 5 10
0
1
2
3
SUG
0 5 10
0.5
1
1.5
JUK
0 5 10
0.5
1
1.5
2
KTM
0 5 10
1
2
3
4
MYS
0 5 10
1
2
3
4
NGW
0 5 10
0
5
SAT
0 5 10
0
1
2
3
SMY
0 5 10
0
0.5
1
1.5
STO
0 5 10
0.5
1
1.5
2
TCT
0 5 10
1
2
3
TJT
0 5 10
0
5
UNO
0 5 10
0
1
2
3
YMJ
0 5 10
0.5
1
1.5
2
YMS
0 5 10
0
0.5
1
1.5
YNG
0 5 10
0
2
4
YSR
0 5 10
0
5
10
15
NSG
Phase
LF/HF ratio
Journal of NeuroEngineering and Rehabilitation 2007, 4:36 />Page 9 of 10
(page number not for citation purposes)
(no sign and 3500-ms interval conditions) at phases 4, 9
and 10 at p < 0.1, and 5, 6, 7, and 8 at p < 0.05. It also
revealed a significant interaction between the no-sign con-
dition and phase (p < 0.05) but not between the 3500-ms
interval condition and phase.
Discussion
Earlier research has pointed to the correlation between
sensitivity to motion sickness and the LF/HF ratio [6,10].
Our results suggest that the presence of predictive signs
affects the increase in the LF/HF ratio. The result that the
LF/HF increases when no signs are presented is consistent
with the previous results. On the other hand, however, a
dissociation between subjective symptoms and the physi-
ological response was seen, as no remarkable motion sick-
ness was reported on the questionnaire. Much previous
research has shown that the results of questionnaire sur-
veys are not so sensitive to the motion sickness induced by
mildly provocative VR content [19], and even when there
is sensitivity, very low ratings result. The driving simulator
we used in this research was designed with stimuli to pre-
vent visual and vestibular conflict, so assuming that con-
scious sickness would not likely occur, we believe that
slight psychological loads that do not produce serious ill-
ness could be detected by changes in heart rate within the
range of our stimulus settings.
A previous study reported this kind of dissociation
between physiological and psychological output in virtual
environments [20]. Akiduki et al. presented a sensory con-
flict between visual and vestibular input to the subjects in
which the rotation of the virtual environment around the
vertical axis did not match the head movement of sub-
jects. Their data suggested that the Graybiel scores for sub-
jects changed significantly after twelve minutes by
immersion in such a sensory conflict situation, while the
amount of body sway area changed significantly after 20
minutes [20]. We could not compare our results with
theirs directly because of differences in the active and pas-
sive experimental concern of the observers with the virtual
environment. Our subjects received the visual and vestib-
ular information passively while sitting in a driving simu-
lator, while the subjects in Akiduki et al. [20] walked
around the virtual space following guide lines and turned
their heads freely. The sensory conflict in the virtual envi-
ronment was a major difference between our study and
theirs, and thus we cannot explain the disagreement
between our results and theirs (physiological or psycho-
logical priority).
These results suggest that the activity of the sympathetic
nervous system was greater under the no-sign condition
than under the 3500-ms interval condition in the latter
half of the observation period. The results, in other words,
suggest that a long enough interval between the appear-
ance of signs and acceleration maintained stable activity
of the autonomic nervous systems of subjects. A short
interval did not systematically change the activity of auto-
nomic nervous system.
In our experimental set up, signs had no quantitative
information about the acceleration, so they could have
caused "false alarms" for the subjects when acceleration
was small enough. Previous studies, moreover, suggested
that some continuous mental tasks, such as the Stroop
task, mirror drawing, and mental arithmetic [21,22] affect
heart rate variability. Thus, the continuous interpretation
of signs about acceleration in our experiment could
increase the mental load on the subjects, even though the
tasks are simple. Therefore, considering both the interval
between signs and events and the gradual representation
of events corresponding to the quantity of acceleration in
the design of more effective signs, seems to be important.
Conclusion
We reported on the effects of visual signs that informed
subjects of acceleration on the activity of the sympathetic
and parasympathetic nervous systems when the subjects
observed a driving simulator that provided visual and ves-
Table 4: Motion sickness sensitivity and percentageo f increase of
LF/HF ratio
No sign 750-Intv. 3500-Intv.
None 0.88 0.63 0.50
Yes 0.77 0.31 0.46
"Yes" including "childhood" and "occasionally" in Table 1.
Averaged LF/HF ratio change of all subjectsFigure 7
Averaged LF/HF ratio change of all subjects. Averaged
data of Figure 6 for all subjects; error bar represents 1 SE.
0 2 4 6 8 10 12
1
1.5
2
2.5
3
3.5
Phase
Average LF/HF ratio
No sign
750-ms Int.
3500-ms Int.
Publish with BioMed Central and every
scientist can read your work free of charge
"BioMed Central will be the most significant development for
disseminating the results of biomedical research in our lifetime."
Sir Paul Nurse, Cancer Research UK
Your research papers will be:
available free of charge to the entire biomedical community
peer reviewed and published immediately upon acceptance
cited in PubMed and archived on PubMed Central
yours — you keep the copyright
Submit your manuscript here:
/>BioMedcentral
Journal of NeuroEngineering and Rehabilitation 2007, 4:36 />Page 10 of 10
(page number not for citation purposes)
tibular information. Our results suggested that the effect
of such signs on the stable activity of the autonomic nerv-
ous system depends on the timing of sign appearance. We
pointed out the importance of the interval between sign
and acceleration and the gradual representation of events
corresponding to the quantity of acceleration.
Authors' contributions
HW designed the study and participated in data collec-
tion. WT participated in data collection and helped with
data analysis. HW drafted the manuscript. All authors
helped with the interpretation of the results, reviewed the
manuscript, and participated in the editing of the final
version of the manuscript.
Acknowledgements
This study was supported by the Nissan Science Foundation to HW. Writ-
ten consent for publication was obtained from the patient or their relative.
References
1. Griffin MJ, Newman MM: Visual field effects on motion sickness
in cars. Aviat Space Environ Med 2004, 75:739-748.
2. Lin JJW, Parker DE, Lahav M, A FT: Unobtrusive vehicle motion
prediction cues reduced simulator sickness during passive
travel in a driving simulator. Ergonomics 2005, 48(6):608-624.
3. Lin JJW, Abi-Rached H, Lahav M: Virtual guiding avatar: An effec-
tive procedure to reduce simulator sickness in virtual envi-
ronments. Proceedings of CHI 2004 2004:24-29.
4. Isobe Y, Fujita K: Influence of gaze and predictive visual cue on
cybersickness in virtual environment. Proceedings of BPES 2004
2004:559-560.
5. Nobel G, Eiken O, Tribukait A, Kolegard R, Mekjavic IB: Motion
sickness increases the risk of accidental hypothermia. Eur J
Appl Physiol 2006, 98:48-55.
6. Yokota Y, Aoki M, Mizuta K, Ito Y, Isu N: Motion sickness suscep-
tibility associated with visually induced postural instability
and cardiac autonomic responses in healthy subjects. Acta
Otolaryngol 2005, 125:280-285.
7. Himi N, Koga T, Nakamura E, Kobashi M, Yamane M, Tsujioka K: Dif-
ferences in autonomic responses between subjects with and
without nausea while watching an irregularly oscillating
video. Auton Neurosci 2004, 116:46-53.
8. Cheung B, Hofer K: Lack of gender difference in motion sick-
ness induced by vestibular Coriolis cross-coupling. J Vestib Res
2002, 12:191-200.
9. Ohyama S, Nishiike S, Watanabe H, Matsuoka K, Akizuki H, Takeda
N, Harada T: Autonomic responses during motion sickness
induced by virtual reality. Auris Nasus Larynx 2007,
34(3):303-306. in printing
10. Doweck I, Gordon CR, Shlitner A, Spitzer O, Gonen A, Binah O,
Melamed Y, Shupak A: Alternations in R-R variability associated
with experimental motion sickness. J Auton Nerv Syst 1997,
67:31-37.
11. Ishii M, Igarashi M, Patel S, Himi T, Kulecz W: Autonomic effects
on R.R variations of the heart rate in the squirrel monkey: an
indicator of autonomic imbalance in conflict sickness. Am J
Otolaryngol 1987, 8:144-148.
12. Akselrod S, Gordon D, Ubel FA, Shannon DC, A BC, J CR: Power
spectrum analysis of heart rate fluctuation: A quantitative
probe of beat-to-beat cardovascular control. Science 1981,
213(4504):202-222.
13. Kim YY, Kim HJ, Kim EN, Ko HD, Kim HT: Characteristic changes
in the physiological components of cybersickness. Psychophys-
iology 2005, 42(5):616-625.
14. Nakamura S: Effects of depth, eccentricity and size of addi-
tional static stimulus on visually induced self-motion percep-
tion. Vision Res 2006, 46:2344-2353.
15. Howard IP, Heckmann T: Circular vection as a function of the
relative sizes, distances, and positions of two competing vis-
ual displays. Perception 1989, 18:657-665.
16. Sayers BM: Analysis of heart rate variability. Ergonomics 1973,
16:17-32.
17. Busek P, Vanková J, Opavský J, Salinger J, Nevsmalová S: Spectral
analysis of the heart rate variability in sleep. Physiol Res 2005,
54(4):369-376. in printing
18. Graybiel A, Wood CD, Miller EF, Cramer DB: Diagnostic criteria
for grading the severity of acute motion sickness. Aerospace
Med 1968, 39:453-455.
19. Kim DH, Parker DE, Park MY: A New Procedure for Measuring
Simulator Sickness – the RSSQ. 2004 [hing
ton.edu/publications/r-2004-52/]. Seattle, WA: Human Interface
Technology Laboratory, University of Washington
20. Akiduki H, Nishiike S, Watanabe H, Matsuoka K, Kubo T, N T: Vis-
ual-vestibular conflict induced by virtual reality in humans.
Neurosci Lett 2003, 340:197-200.
21. Muldoon MF, Bachen EA, Manuck SB, Waldstein SR, Bricker PL, Ben-
nett JA: Acute cholesterol responses to mental stress and
change in posture. Archives of Internal Medicine 1992, 152:775-780.
22. Owens JF, Stoney CM, Matthews KA: Menopausal status influ-
ences ambulatory blood pressure levels and blood pressure
changes during mental stress. Circulation 1993, 88(6):2794-2802.