báo cáo hóa học: " Relationships between sensory stimuli and autonomic nervous regulation during real and virtual exercises" pot
Bạn đang xem bản rút gọn của tài liệu. Xem và tải ngay bản đầy đủ của tài liệu tại đây (342.44 KB, 7 trang )
BioMed Central
Page 1 of 7
(page number not for citation purposes)
Journal of NeuroEngineering and
Rehabilitation
Open Access
Research
Relationships between sensory stimuli and autonomic nervous
regulation during real and virtual exercises
Tohru Kiryu*
1,2
, Atsuhiko Iijima
3
and Takehiko Bando
2,3
Address:
1
Graduate School of Science and Technology, Niigata University, 8050 Ikarashi-2, Nishi-Ku, Niigata 950-2181, Japan,
2
Center for
Transdisciplinary Research, Niigata University, 8050 Ikarashi-2, Nishi-Ku, Niigata 950-2181, Japan and
3
Graduate School of Medical and Dental
Sciences, Niigata University, 1-757 Asahimachi-dori, Chuo-Ku, Niigata 951-8520, Japan
Email: Tohru Kiryu* - ; Atsuhiko Iijima - ; Takehiko Bando -
* Corresponding author
Abstract
Background: Application of virtual environment (VE) technology to motor rehabilitation
increases the number of possible rehabilitation tasks and/or exercises. However, enhancing a
specific sensory stimulus sometimes causes unpleasant sensations or fatigue, which would in turn
decrease motivation for continuous rehabilitation. To select appropriate tasks and/or exercises for
individuals, evaluation of physical activity during recovery is necessary, particularly the changes in
the relationship between autonomic nervous activity (ANA) and sensory stimuli.
Methods: We estimated the ANA from the R-R interval time series of electrocardiogram and
incoming sensory stimuli that would activate the ANA. For experiments in real exercise, we
measured vehicle data and electromyogram signals during cycling exercise. For experiments in
virtual exercise, we measured eye movement in relation to image motion vectors while the subject
was viewing a mountain-bike video image from a first-person viewpoint.
Results: For the real cycling exercise, the results were categorized into four groups by evaluating
muscle fatigue in relation to the ANA. They suggested that fatigue should be evaluated on the basis
of not only muscle activity but also autonomic nervous regulation after exercise. For the virtual
exercise, the ANA-related conditions revealed a remarkable time distribution of trigger points that
would change eye movement and evoke unpleasant sensations.
Conclusion: For expanding the options of motor rehabilitation using VE technology, approaches
need to be developed for simultaneously monitoring and separately evaluating the activation of
autonomic nervous regulation in relation to neuromuscular and sensory systems with different
time scales.
Introduction
It takes a long time for functional recovery in motor reha-
bilitation, and providing appropriate tasks and/or exer-
cises during the progression of recovery is necessary to
continue promoting motor rehabilitation with sufficient
effectiveness, as well to motivate the patient. Current vir-
tual reality (VR) and virtual environment (VE) technolo-
gies are now being applied to rehabilitation engineering
[1] because they are expected to help restore the sensory
and physical functions without any restriction in the real
world. Application of a VE to motor rehabilitation
expands the number of options for selecting rehabilita-
Published: 6 October 2007
Journal of NeuroEngineering and Rehabilitation 2007, 4:38 doi:10.1186/1743-0003-4-38
Received: 2 June 2006
Accepted: 6 October 2007
This article is available from: />© 2007 Kiryu et al; licensee BioMed Central Ltd.
This is an Open Access article distributed under the terms of the Creative Commons Attribution License ( />),
which permits unrestricted use, distribution, and reproduction in any medium, provided the original work is properly cited.
Journal of NeuroEngineering and Rehabilitation 2007, 4:38 />Page 2 of 7
(page number not for citation purposes)
tion tasks and/or exercises including real active exercise,
real passive exercise, active or passive exercise in a VE, elec-
trical or mechanical stimulation for paralyzed muscles,
and visual stimulation with a first-person-view video
image.
However, enhancing or augmenting a specific sensory
stimulus in a VE sometimes causes unpleasant sensations
due to conflicts among sensory stimuli (sensory conflict
theory [2]). This problem in a VE has been referred to as
"cybersickness" in relation to simulator sickness and
motion sickness [3,4]. That is, unbalanced stimuli that are
different from those experienced in the real world some-
times cause unpleasant sensations, even though they are
expected to increase the feeling of reality. Studies have
described unpleasant sensations in the application of VR
and VE technologies in motor rehabilitation [5,6], and
researchers have studied unpleasant sensations using sub-
jective indices [7] and autonomic-nervous-activity-related
indices [8]. Repetitive muscle activity in the real exercise
produces physical fatigue like unpleasant sensations in
the virtual task, and physical fatigue could be evaluated by
using autonomic nervous regulation.
Physical activity mainly consists of several functional
components with different time scales. Autonomic nerv-
ous activity (ANA) dominantly regulates the person's
physical conditions after exercise or exercise-related sen-
sory stimuli for several seconds. In contrast, muscle activ-
ity and sensory activity work within a few tens of
milliseconds. When selecting appropriate tasks and/or
exercises for individuals, we should consider the relation-
ship between ANA and sensory stimuli.
We conducted a feasibility study of using autonomic nerv-
ous regulation in response to several sensory stimuli, for
real cycling and for virtual mountain biking using a first-
person-view video image. We estimated the ANA from the
R-R interval time series of electrocardiogram (ECG) and
incoming sensory stimuli that would activate the ANA. To
evaluate the exercise-related factors in real exercise, we
measured vehicle data and electromyogram (EMG) sig-
nals during the cycling exercise. We measured the eye
movement of the subject in relation to image motion vec-
tors while he or she was viewing the first-person-view vec-
tion-inducing mountain-bike video images. Although
muscle contractions generally elicit a strong demand on
the ANA, visual stimuli are not always the strong demand
for everyone. Accordingly, we carefully considered where
and when the incoming stimuli and the ANA should be
evaluated.
Methods
Since autonomic nervous regulation should be evaluated
after incoming stimuli, we focused on the specific sections
before and after climbing a hill on a bicycle in the real
world (Figure 1(a)) and the sections specified by the
behavior of ANA-related indices in the virtual world (Fig-
ure 1(c)).
Experimental procedure
The subjects were volunteers and were informed of the
risks involved and signed a consent form in advance, and
were free to withdraw at any time during the experiment.
For biosignal processing, a time interval of over a few min-
utes is necessary to estimate the ANA, even though the
exercises or exercise-related sensory stimuli are very short
events. A trial consisted of a series of events followed by
enough rest to estimate the ANA.
For the real exercise [9], the subjects were asked to pedal a
torque-assisted bicycle at 60 rpm for as long as possible.
The length of the path was approximately 840 meters,
with a steep uphill section near the middle; the maximum
incline was 5.7 deg (Figure 1(a)). We divided the path
into three phases: before and after climbing, and climb-
ing. An experimental set consisted of six consecutive trials,
and each trial comprised a 2.5-min cycling exercise fol-
lowed by a 2-min rest. The ECG and EMG signals were
measured using a tablet PC and were sampled at 5000 Hz
with 12-bit resolution. We also measured the speed,
cadence, and torque as vehicle data and compared them
with the muscle activity for every pedal stroke.
For the virtual exercise [10,11], the subjects continuously
viewed a 2-min-long mountain-bike video taken from a
first-person viewpoint, five times for 10 min, followed by
a 5-min rest (Figure 1(b)); the video camera had been
mounted on the handlebars of a mountain bike, and it
sometimes produced off-centered vection or random
camera shake. The video image was back-projected onto
an 80-inch screen by XGA video projectors with over 2500
ANSI lumens, and the illumination in the room was 10 lx.
The distance between the subject and screen was about 2
meters, resulting in horizontal and vertical view angles of
22 and 17 deg, respectively. We recorded the ECG, and
measured the blood pressure using the tonometry
method, the respiration using strain sensors around the
chest and abdomen for use as ANA-related biosignals, and
the eye movement for evaluating sensory activity by using
a limbus tracker, at a sampling frequency of 1000 Hz with
12-bit resolution.
Biosignal processing
At the sensory systems level, we used the correlation coef-
ficient to derive the relationship between the external sen-
sory stimuli and those responses due to different time
scales. For evaluating the response to external sensory
stimuli, we compared the behavior of ANA-related indices
before and after the stimuli.
Journal of NeuroEngineering and Rehabilitation 2007, 4:38 />Page 3 of 7
(page number not for citation purposes)
In the real exercise, the strongest demand on ANA was
from muscle contractions. We used the average rectified
value (ARV) from the EMG signals as a muscle-force-
related index [9,12], then calculated the correlation coef-
ficient between ARV and pedal torque, γ
ARV-trq
. As a muscle
fatigue-related index, we used the mean power frequency
(MPF) from the EMG signals and calculated the correla-
tion coefficient between ARV and MPF, γ
ARV-MPF
. These
correlation coefficients were obtained from samples esti-
mated with a sliding 50-ms interval every 25 ms during
each pedal-stroke interval of 400 ms. Surveying the results
from around 200 contractions for each trial, we selected
five consecutive pedal strokes immediately before the hill-
top during climbing and averaged γ
ARV-trq
and γ
ARV-MPF
.
Grouping was done for every trial with γ
ARV-MPF
and ANA-
related indices. We estimated the ANA-related indices for
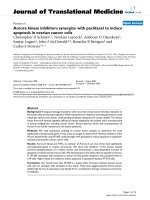
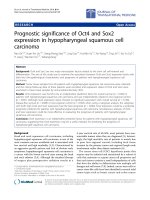
Evaluation process of autonomic regulation for incoming stimuli: (a) overview of circuit path for real exercise; (b) sequence of trials for virtual exercise; (c) definition of t
g
and SSS for virtual exerciseFigure 1
Evaluation process of autonomic regulation for incoming stimuli: (a) overview of circuit path for real exercise; (b) sequence of
trials for virtual exercise; (c) definition of t
g
and SSS for virtual exercise.
h
e
i
g
h
t
distance [m]
start
finish
237 507
2nd corner 3rd corner
(
a)
before
climbing
climbing
after
climbing
relative Intensity
0.2
0.6
1.0
1.4
1.8
HF
SSS
J
C
HF80
LF
LF120
Q
Q: SSQ, T#: number of trial (120 s)
Qrest T1 T2 T3 T4 T5 rest
5 min 5 min
(
b)
(
c)
600 s
Journal of NeuroEngineering and Rehabilitation 2007, 4:38 />Page 4 of 7
(page number not for citation purposes)
each phase from the R-R interval time series by using the
continuous wavelet transform. For the real exercise, the
focused frequency band was related to the respiratory
sinus arrhythmia (RSA) [13], which had a frequency band
ranging from 0.3 to 0.6 Hz during exercise. In practice, we
calculated the power ratio of RSA, (total power at 0.3–0.6
Hz)/(total power at 0.01–1.25 Hz), and then averaged it
for each phase to discriminate trials in relation to the
autonomic nervous regulation property. We denote the
averaged power ratio of RSA as pr
RSA
.
For the virtual exercise, several types of biosignals were
available during the experiments, which were done in the
laboratory. To quantify the input visual stimuli, we esti-
mated the zoom, pan, and tilt components of the global
motion vector (GMV) of the video images: GMV is a key
technology in image data compression [14]. We calcu-
lated the correlation coefficient between the GMV and eye
movement, γ
GMV-eye
, every 10 s as the sensory response.
Identifying the input visual stimuli for unpleasant sensa-
tions is difficult because they are relatively weak. We
obtained a time-varying ANA-related indices for every
frame (30 frame/s) with a 10-s interval from the R-R inter-
val, the respiration, and the blood pressure time series by
using the continuous wavelet transform. The focused fre-
quency bands of the indices were 0.04–0.15 Hz (Mayer
wave related low-frequency (LF) band) and 0.16–0.45 Hz
(RSA related high-frequency (HF) band). The LF and HF
components for five consecutive tasks were further nor-
malized using the average LF and HF components esti-
mated during a preceding rest period, respectively. We
then defined some sensation section (SSS) on the basis of
three ANA-related conditions [10]: the LF component is
greater than 120% of the average LF component, the HF
component is less than 80% of the average HF compo-
nent, and the length of the SSS is over 300 msec (Figure
1(c)). Next, we determined the trigger point of the SSS, t
g
,
by searching the local minimum of the LF component
backwards in time. To screen the visually induced sensa-
tion before and after the video viewing (Figure 1(b)), we
used the total severity scores of the Simulator Sickness
Questionnaire (SSQ) [7]. The total SSQ score is a combi-
nation of components based on the levels of nausea, ocu-
lomotor problems, and disorientation.
Results
Real exercise
The participants in the real exercise were 13 healthy vol-
unteers (eight men and five women, 20.0 ± 0.8 years).
Using pr
RSA
and γ
ARV-MPF
, we classified the 103 trials into
four groups. First, we set the threshold at 20% of the aver-
age pr
RSA
before climbing, estimating the median (21.3%)
from all the trials. For a high-percentage pr
RSA
(HRSA)
before climbing, a large fluctuation occurred in the R-R
interval before and after climbing, specifically during the
rest periods [9]. A little fluctuation occurred in the R-R
interval before and after climbing for a low-percentage
pr
RSA
(LRSA) before climbing. Second, we used the γ
ARV-MPF
immediately before the hilltop because the samples for
the positive γ
ARV-MPF
region showed the largest shift in
pr
RSA
in relation to climbing efforts. During the first half of
a peal stroke, positive and negative γ
ARV-MPF
means increas-
ing muscle activity and muscle fatigue, respectively [9,12].
During the second half, positive and negative γ
ARV-MPF
means decreasing and disappearing muscle activity,
respectively. We represent positive γ
ARV-MPF
as increasing
or decreasing muscle activity (I/D) and negative γ
ARV-MPF
as fatigue or disappearing muscle activity (F/D).
We categorized each trial into one of four groups on the
basis of the median of pr
RSA
and the sign of γ
ARV-MPF
for five
consecutive pedal strokes immediately before the hilltop
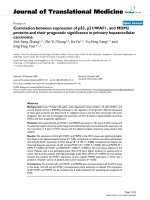
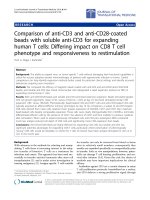
and plotted the results in a scatter graph (Figure 2). Table
1 presents the results for other indices. The four groups are
denoted HRSA-I/D, HRSA-F/D, LRSA-I/D, and LRSA-F/D.
In Figure 2(a), the percentage of power-assist-off trials was
the highest for LRSA-I/D and the lowest for HRSA-I/D.
The results for HRSA-F/D, which had the largest number
of trials, showed negative γ
ARV-MPF
with a high pr
RSA
; even
in HRSA with power-assist-on trials, negative γ
ARV-MPF
sometimes occurred. In this group, the speed was
medium, and the torque was the lowest (Table 1). In con-
trast, the results for LRSA-F/D showed negative γ
ARV-MPF
and LRSA. The speed was the lowest, and the torque was
medium. In the LRSA-I/D group, the speed was close to
that of the HRSA-F/D group and the torque was larger
than those of the HRSA-F/D and the LRSA-F/D groups.
The highest speed and torque with positive γ
ARV-MPF
was
for HRSA-I/D. As shown in Figure 2(b), the pr
RSA
during
the rest after climbing was significantly higher than pr
RSA
before climbing (paired t-test, p < 0.05), especially for the
Table 1: Speed, torque, γ
ARV-MPF
, and γ
ARV-trq
during climbing for four groups.
HRSA-I/D HRSA-F/D LRSA-I/D LRSA-F/D
speed [km/h] 18.3 ± 2.1 16.4 ± 2.4 16.2 ± 2.5 15.9 ± 2.2
torque [Nm] 31.0 ± 8.6 23.4 ± 7.1 29.2 ± 7.9 25.3 ± 6.1
γ
ARV-MPF
0.19 ± 0.33 -0.47 ± 0.15 0.18 ± 0.11 -0.34 ± 0.21
γ
ARV-trq
0.66 ± 0.18 0.62 ± 0.33 0.66 ± 0.21 0.64 ± 0.22
Journal of NeuroEngineering and Rehabilitation 2007, 4:38 />Page 5 of 7
(page number not for citation purposes)
HRSA-I/D group. Contrary to our expectation for torque-
assisted bicycles, the torque-assist supported the appear-
ance of HRSA, but it was sometimes not enough for mus-
cle fatigue.
Virtual exercise
Fifteen healthy men (21.9 ± 0.9 years) voluntarily partici-
pated in the virtual exercise. Nine experienced unpleasant
sensations while watching the mountain-bike video and
six did not, as classified by their total SSQ scores. The time
distribution of the total 60 trigger points for each 10-s seg-
ment is shown in Figure 3(a). The trigger points were con-
centrated in the 71–80-s segment of the 2-min-long video
image. As shown in Figure 3(b), γ
GMV-eye
showed the simi-
lar behavior to the trigger points for the first task, but did
not after the second task. That is, around the 71–80-s seg-
ment, the subjects' eyes relatively followed the camera
motion for the first task (γ
GMV-eye
= 0.4), but γ
GMV-eye
decreased after the second task. This did not occur for the
"non-unpleasant" group. Figure 4(a) shows a contour plot
of the total SSQ score as a function of the normalized LF
and HF components for all the 60 samples at each SSS.
The total SSQ score was higher than 100 in a few regions
far from the thresholds of the ANA-related conditions.
That is, the ANA-related conditions determining the SSS
covered the subjects with a high total SSQ score. Moreo-
ver, the total SSQ score in relation to each SSS practically
revealed the time distribution of the total SSQ score (Fig-
ure 4(b)): for each 10-s segment, we estimated the mean
and standard deviation of the total SSQ score among
related subjects in relation to each SSS. The total SSQ
score for the 61–120-s segment was significantly higher
than that for the 1–60-s segment (t-test, p < 0.05).
Discussion
A virtual environment increases the number of options for
selecting approaches to motor rehabilitation. The options
range from active exercise in the real world with muscle
contractions to passive exercise in the virtual world with
visual stimulation. To provide appropriate tasks and/or
exercises for individuals undergoing motor rehabilitation,
we focused on the impact of external sensory stimuli and
autonomic nervous regulation as their responses.
Autonomic regulation is important in a series of repetitive
exercises because it controls the cardiovascular system.
During real exercise, the muscle sympathetic nerve activity
activated by strong muscle contractions elicits autonomic
nervous responses [15,16]. This autonomic regulation
supports continuous real exercise. A low γ
ARV-trq
reflects a
mismatch between muscle activity and pedal torque
resulting from poor pedaling skills. This mismatch could
Scatter graphs between pr
RSA
and γ
ARV-MPF
during climbing for four categories: (a) pr
RSA
before climbing; (b) pr
RSA
during the rest after climbingFigure 2
Scatter graphs between pr
RSA
and γ
ARV-MPF
during climbing for four categories: (a) pr
RSA
before climbing; (b) pr
RSA
during the
rest after climbing. The number of samples for each group is displayed with the number of power-assist-off trials in parenthe-
ses.
-1
-0.8
-0.6
-0.4
-0.2
0
0.2
0.4
0.6
0.8
1
0 1020304050
FH
RSA
before climbing
[%]
γ
ARV-MPF
immediately before the hilltop
HRSA, assist ON
HRSA, assist OFF
LRSA, assist ON
LRSA, assist OFF
HRSA-I/DLRSA-I/D
HRSA-F/DLRSA-F/D
21(2)
40(5)
24(7)
18(9)
FH
RSA
during the rest after climbing
[%]
γ
ARV-MPF
immediately before the hilltop
HRSA-I/DLRSA-I/D
HRSA-F/DLRSA-F/D
35(9)
49(6)
15(6)
4(2)
-1
-0.8
-0.6
-0.4
-0.2
0
0.2
0.4
0.6
0.8
1
0 1020304050
(a) (b)
Journal of NeuroEngineering and Rehabilitation 2007, 4:38 />Page 6 of 7
(page number not for citation purposes)
increase muscular fatigue, resulting in strong requests for
autonomic regulation after climbing, even with the
power-assist on. However, γ
ARV-trq
did not significantly dif-
fer among the four groups (Table 1), so the difference in
pr
RSA
was not fully linked to muscular fatigue (Figure 2).
Refer to [9] for supplemental results. Thus, evaluation of
muscle activity separately from pr
RSA
is necessary for pre-
venting muscular fatigue in motor rehabilitation.
In contrast, the ANA was more difficult to distinguish dur-
ing virtual exercise than during real exercise, according to
the results for the first-person-view vection-inducing
video images. We defined the ANA-related conditions and
obtained a remarkable time distribution of trigger points
that would evoke unpleasant sensations in ANA (Figure
3(a)). Around the trigger points, we have obtained the
related time-frequency components of the GMVs ranging
from 0.3 to 2.5 Hz [11]. The correlation coefficient
between GMV and eye movement around the peaks of
trigger points was 0.4 for the first task and decreased after
the second task for the unpleasant group (Figure 3(b)).
This might have been caused by the progression of the
mismatch between the specific time-frequency structure
of the GMVs and eye movement. Thus, evaluation by sen-
sory features could be useful for specifying sensations in
addition to ANA-related indices. The SSS derived from the
ANA-related conditions enabled us to evaluate the distri-
bution of the total SSQ score as a function of the LF and
HF components (Figure 4(a)). Moreover, the SSS eventu-
ally represented the time distribution of the averaged total
SSQ score (Figure 4(b)). Since the SSQ reflects the oculo-
motor problems and disorientation as well as the levels of
nausea, Figure 4(b) obtained by the ANA-related condi-
tions did not fully explain the behavior of sensations.
However, those approaches have a potential in revealing
the event-related autonomic response for a weak stimulus
like a visual one. We will compare the total SSQ score with
the sensory activity as a function of time in the next step.
The level in the disturbance of autonomic regulation
depends on the individual. Therefore, to provide appro-
priate tasks and/or exercises as recovery progresses, we
need to simultaneously monitor and separately evaluate
the neuromuscular and sensory systems and autonomic
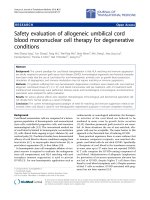
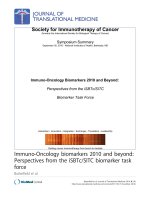
Distributions of total SSQ score in relation to SSS: (a) con-tour plot of total SSQ score as a function of normalized LF and HF components at each SSS (60 dots); (b) practical time distribution of the total SSQ score in relation to each SSSFigure 4
Distributions of total SSQ score in relation to SSS: (a) con-
tour plot of total SSQ score as a function of normalized LF
and HF components at each SSS (60 dots); (b) practical time
distribution of the total SSQ score in relation to each SSS.
normalized LF component
n
orma
li
zed
HF
component
1.2 1.4 1.6 1.8 2.0 2.2
0.4
0.6
0.8
25
50
75
100
100
100
100
LF120
HF80
B
B
BB
B
B
B
B
B
B
B
B
0 50 100
time [sec]
t
otal SSQ score in relation to each SSS
0
50
100
150
(a)
(b)
Time distributions of trigger points and γ
GMV-eye
for each 10-s segment for 2-min-long randomly camera-shaken video image: (a) number of trigger points accumulated for five tasks; (b) γ
GMV-eye
for each task averaged among "unpleasant" groupFigure 3
Time distributions of trigger points and γ
GMV-eye
for each 10-
s segment for 2-min-long randomly camera-shaken video
image: (a) number of trigger points accumulated for five
tasks; (b) γ
GMV-eye
for each task averaged among "unpleasant"
group. Note that the pan component and the horizontal
movement were used as the GMV and the eye movement,
respectively.
B
B
BB
B
BB
B
B
B
B
B
B
B
B
B
B
B
B
B
B
B
B
B
J
J
J
J
J
J
J
J
J
J
JJ
H
H
H
H
H
H
H
H
H
H
H
H
F
F
F
F
F
F
F
F
F
F
F
F
1
1
11
1
1
1
1
1
11
1
0
0.1
0.2
0.3
0.4
0.5
0
2
4
6
8
10
12
0 50 100
time [sec]
n
umber of trigger points
B J H F 1
1st task 2nd task 3rd task 4th task 5th task
0 50 100
time [sec]
(a)
(b)
Publish with BioMed Central and every
scientist can read your work free of charge
"BioMed Central will be the most significant development for
disseminating the results of biomedical research in our lifetime."
Sir Paul Nurse, Cancer Research UK
Your research papers will be:
available free of charge to the entire biomedical community
peer reviewed and published immediately upon acceptance
cited in PubMed and archived on PubMed Central
yours — you keep the copyright
Submit your manuscript here:
/>BioMedcentral
Journal of NeuroEngineering and Rehabilitation 2007, 4:38 />Page 7 of 7
(page number not for citation purposes)
regulation as their responses. Appropriate tasks and/or
exercises in motor rehabilitation will properly activate the
ANA by neuromuscular and sensory systems: muscle con-
tractions in real exercise and visual stimuli in virtual exer-
cise are trigger factors. The autonomic nervous system
receives many types of stimuli from different sensory sys-
tems with different time scales and seems to set individual
priority for autonomic responses. Since the threshold
between positive and negative effects would vary even for
the same stimuli, depending on the behavior of auto-
nomic nervous regulation, the differences between real
and virtual exercises should be studied in terms of the
ANA-related indices. We did a preliminary cross-valida-
tion study between real and virtual exercises for the same
nine subjects, but we have not yet identified specific fea-
tures. Further cross-validation studies should provide
hints for designing continuous repetitive training or exer-
cises for motor rehabilitation.
Conclusion
We investigated the process of repetitive training or exer-
cises to be used for continuous motor rehabilitation with
sufficient effectiveness and motivation by comparing real
and virtual exercises. The evaluated factors were muscle
activity and vision properties depending on the type of
task and exercises as well as the autonomic nervous activ-
ity estimated from the heart rate variability. Our results
showed that fatigue in the real world should be evaluated
on the basis of not only muscle activity but also auto-
nomic nervous regulation after exercise. Moreover,
unpleasant sensations in the virtual world should be
checked first in terms of vision properties and then in
terms of autonomic nervous regulation. To expand the
options for motor rehabilitation using virtual environ-
ment technology, we need to develop approaches for
simultaneously monitoring and separately evaluating the
activation of autonomic nervous regulation in relation to
neuromuscular and sensory systems with different time
scales.
Acknowledgements
This study has been promoted under the project in the Center for
Transdisciplinary Research of Niigata University. A part of this study
regarding virtual exercise was subsidized the Japan Keirin Association
through its Promotion funds from KEIRIN RACE and was supported by the
Mechanical Social Systems Foundation and the Ministry of Economy, Trade
and Industry in Japan. Finally, we thank all our students who contributed in
this study to data acquisition and preliminary analysis.
References
1. Kenyon R, Leigh J, Keshner E: Considerations for the future
development of virtual technology as a rehabilitation tool. J
NeuroEng Rehab 2004, 1:13.
2. Hettinger LJ, Berbaum KS, Kennedy RS, Dunlap WP, Nolan MD: Vec-
tion and simulator sickness. Mil Psychol 1990, 2:171-181.
3. Hoffman H, Murray M, Hettinger L, Viirre E: Assessing a VR-based
learning environment for anatomy education. Stud Health
Technol Inform 1998, 50:336-340.
4. So RH, Ho A, Lo WT: A metric to quantify virtual scene move-
ment for the study of cybersickness: Definition, implementa-
tion, and verification. Presence 2001, 10:192-215.
5. Sveistrup H: Motor rehabilitation using virtual reality. J Neuro-
Eng Rehab 2004, 1:10.
6. Holden MK: Virtual environments for motor rehabilitation:
Review. Cyberpsychol Behav 2005, 8:187-211.
7. Kennedy RS, Lane NE, Berbaum KS, Lilienthal MG: Simulator sick-
ness questionnaire: An enhanced method for quantifying
simulator sickness. Int J Aviat Psychol 1993, 3:203-220.
8. Peters K, Darlington CL, Smith PF: The effects of repeated
optokinetic stimulation on human autonomic function. J
Vestib Res 2000, 10:139-142.
9. Kiryu T, Yamagata J: Relationship between muscle activity and
autonomic regulation during cycling with a torque-assisted
bicycle. Proc 28th Annu Int Conf IEEE EMBS 2006:2702-2705.
10. Kiryu T, Yamada H, Jimbo M, Bando T: Time-Varying Behavior of
Motion Vectors in Vection-Induced Images in Relation to
Autonomic Regulation. Proc 26th Annu Int Conf IEEE EMBS
2004:2403-2406.
11. Kiryu T, Nomura E, Iijima A, Bando T: Time-frequency structure
of image motion vectors under vection-induced cybersick-
ness. Proc 12th Int Conf Human-Computer Interaction 2005:2358.
12. Kiryu T, Sasaki I, Shibai K, Tanaka K: Providing appropriate exer-
cise levels for the elderly. IEEE EMB Magazine 2001, 20:125-132.
13. Hayano J, Taylor JA, Mukai S, Okada A, Watanabe Y, Takata K, Fuji-
nami T: Assessment of frequency shifts in R-R interval varia-
bility and respiration with complex demodulation. J Appl
Physiol 1994, 77:2879-2888.
14. Jinzenji K, Watanabe H, Kobayashi N: Global motion estimation
for static sprite production and its application to video cod-
ing. Proc IEEE ISPAC'98 1998:328-332.
15. Mitchell JH: Neural control of the circulation during exercise.
Med Sci Sports Exerc 1998, 22:141-154.
16. Saito M, Tsukanaka A, Yanagihara D, Mano T: Muscle sympathetic
nerve responses to graded leg cycling. J Appl Physiol 1993,
75:663-667.