báo cáo hóa học: " Effects of visually simulated roll motion on vection and postural stabilization" pptx
Bạn đang xem bản rút gọn của tài liệu. Xem và tải ngay bản đầy đủ của tài liệu tại đây (668.27 KB, 11 trang )
BioMed Central
Page 1 of 11
(page number not for citation purposes)
Journal of NeuroEngineering and
Rehabilitation
Open Access
Research
Effects of visually simulated roll motion on vection and postural
stabilization
Shigehito Tanahashi*
†1,2
, Hiroyasu Ujike
†2
, Ryo Kozawa
2,3
and
Kazuhiko Ukai
1
Address:
1
School of Science and Engineering, Waseda University, Tokyo, Japan,
2
Institute for Human Science and Biomedical Engineering, AIST,
Tsukuba, Japan and
3
School of Psychology, Chukyo University, Nagoya, Japan
Email: Shigehito Tanahashi* - ; Hiroyasu Ujike - ; Ryo Kozawa - ;
Kazuhiko Ukai -
* Corresponding author †Equal contributors
Abstract
Background: Visual motion often provokes vection (the induced perception of self-motion) and postural
movement. Postural movement is known to increase during vection, suggesting the same visual motion
signal underlies vection and postural control. However, self-motion does not need to be consciously
perceived to influence postural control. Therefore, visual motion itself may affect postural control
mechanisms. The purpose of the present study was to investigate the effects of visual motion and vection
on postural movements during and after exposure to a visual stimulus motion.
Methods: Eighteen observers completed four experimental conditions, the order of which was
counterbalanced across observers. Conditions corresponded to the four possible combinations of
rotation direction of the visually simulated roll motion stimulus and the two different visual stimulus
patterns. The velocity of the roll motion was held constant in all conditions at 60 deg/s. Observers
assumed the standard Romberg stance, and postural movements were measured using a force platform
and a head position sensor affixed to a helmet they wore. Observers pressed a button when they
perceived vection. Postural responses and psychophysical parameters related to vection were analyzed.
Results: During exposure to the moving stimulus, body sway and head position of all observers moved in
the same direction as the stimulus. Moreover, they deviated more during vection perception than no-
vection-perception, and during no-vection-perception than no-visual-stimulus-motion. The postural
movements also fluctuated more during vection-perception than no-vection-perception, and during no-
vection-perception than no-visual-stimulus-motion, both in the left/right and anterior/posterior directions.
There was no clear habituation for vection and posture, and no effect of stimulus type.
Conclusion: Our results suggested that visual stimulus motion itself affects postural control, and
supported the idea that the same visual motion signal is used for vection and postural control. We
speculated that the mechanisms underlying the processing of visual motion signals for postural control and
vection perception operate using different thresholds, and that a frame of reference for body orientation
perception changed along with vection perception induced further increment of postural sway.
Published: 9 October 2007
Journal of NeuroEngineering and Rehabilitation 2007, 4:39 doi:10.1186/1743-0003-4-39
Received: 3 June 2006
Accepted: 9 October 2007
This article is available from: />© 2007 Tanahashi et al; licensee BioMed Central Ltd.
This is an Open Access article distributed under the terms of the Creative Commons Attribution License ( />),
which permits unrestricted use, distribution, and reproduction in any medium, provided the original work is properly cited.
Journal of NeuroEngineering and Rehabilitation 2007, 4:39 />Page 2 of 11
(page number not for citation purposes)
Background
Virtual Reality (VR) technology has developed rapidly
thanks to progress in information technology and compu-
ter graphics. The applications of VR technology have
expanded to various fields including health and medical
services, the amusement industry, architectural design,
and others. While VR technology is useful for these appli-
cations, it can sometimes have a negative effect, known as
"visually induced motion sickness." The cause of this has
often been described by sensory conflict or sensory rear-
rangement theory [1]. To reduce this negative effect of VR
technology, we need to understand how visual informa-
tion is used for perception and the control of self-motion,
especially for applications in rehabilitation, health, and
medical services [2-4].
Self-motion is perceived and controlled based on infor-
mation from different senses, including visual, vestibular
and proprioceptive [5]. To date, the literature has largely
focused on the role of visual information [6-9], partly
because visual information plays a principal role in the
perception of self-motion. In fact, motion in a large visual
field often induces the perception of self-motion; an effect
is known as vection [10,11] in an individual who remains
stationary. Visual information also plays major role in
postural control. Motion in a large visual field has been
shown to increase postural sway involuntarily [7,8,12],
and restricting the visual field often destabilizes the body
[13]. In the present study, our concern, here, was to
whether the visual information contributing to vection is
the same as that involved in postural control.
Previous research has demonstrated that vection and pos-
tural movement are correlated when visual stimulus
motion, which is motion presented in the visual field, was
presented. Inclination of the body, defined as postural
sway in the present study, was reported to increase during
periods of vection as compared to periods of no-vection
[14-16]. Wolsley et al. [14] and Thurrell et al. [15]
reported that the visually evoked postural response
increased during periods of vection, and its direction
tended to align with the plane of motion of the visual
stimulus. Kuno et al. [16] reported that the magnitude of
vection induced by an optokinetic stimulus moving in
depth was correlated with the velocity of the stimulus,
which in turn was correlated with the magnitude of pos-
tural sway in anterior/posterior direction. Moreover,
small fluctuations in body movements, defined as pos-
tural instability in the present study, were reported to
increase with vection. Fushiki et al. [17] reported that vec-
tion induced by vertical visual stimulus motion was a sig-
nificant factor in postural instability in the anterior/
posterior direction. Taken together, these findings suggest
that the same visual motion signal, which is processed in
the visual system, underlies vection and postural control.
However, self-motion does not need to be consciously
perceived to influence postural control [18]. In fact, Previc
and Mullen [18] and Clément et al. [19] have noted that
onset latencies of postural change is shorter than that of
vection.
The magnitude of postural movements was also reported
to increase during visual stimulus motion as compared to
conditions with no visual stimulus motion. van Asten et
al. [20] reported that a visually simulated rotation
induced postural movements involving rotations in the
ankle joint. However, this research did not clearly describe
whether the postural movements were induced by the vis-
ual rotation itself or by vection produced by the visual
rotation. If the visual rotation in itself increased postural
movements, visual motion affected postural control
mechanisms regardless of vection. While the same visual
information seems to be used for vection and postural
control, we need to make clear whether visual motion in
itself affects postural control mechanisms.
The goal of the present study was to investigate the effect
of visual motion and vection on postural control mecha-
nisms. To this end, we measured and compared postural
movements in terms of the center of foot pressure and
head position during three different periods: no-visual-
stimulus-motion, visual-stimulus-motion without vec-
tion, and visual-stimulus-motion with vection. To investi-
gate the effect in detail, we analyzed the postural
movement data by postural sway and postural instability
in both the left/right and anterior/posterior directions.
Methods
Observers
Eighteen adults, aged 19–72 years (13 females and 5
males; 39.7 ± 14.9 years), were recruited from local resi-
dents in the Tsukuba city area. All observers participated
in the study after giving their informed written consent in
accordance with the provision of AIST, (National Institute
of Advanced Industrial Science and Technology), ergo-
nomics experiment policy, and were free to withdraw at
any time during the experiment. The experimental proto-
col was approved in advance by the Institutional Review
Board of AIST. The observers were naïve as to the purpose
of the experiment, and had normal, or corrected-to-nor-
mal, visual acuity by testing with Randolt's test chart at 5
m and optometer, and no history of optic nerve disease.
Stimulus and Apparatus
A moving visual image virtually simulated rotation along
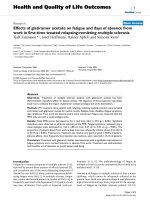
the roll axis. As shown in Figure 1, the observer was
located at the center of the virtually simulated rectangular
space that was 5 × 5 × 3 m (width × depth × height). Two
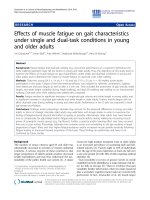
different visual contexts were produced on the inside
walls of the rectangular space (Figure 2). One was a ran-
Journal of NeuroEngineering and Rehabilitation 2007, 4:39 />Page 3 of 11
(page number not for citation purposes)
dom-dot pattern consisting of black dots (2.29 cd/m
2
) on
white walls (43.6 cd/m
2
), and the other was a pattern that
simulated an ordinary room (46.2 cd/m
2
for a typical
wall). The luminance values indicated were measured for
the central 20 deg, and those in the periphery decreased to
31% of the central value due to the characteristics of the
back-projection system described below. Despite the
luminance difference across the screen, the appearance of
images differed very little between the center and the
periphery. The diameter of each dot of the random-dot
pattern was 4 cm on the wall, and the density of the dot
area on the wall was 22%. The pattern simulated an ordi-
nary room including a double door, windows, yellowish-
brown wall, linoleum-covered floor, and ceiling with area
lighting.
The visual images were created online on a Windows-
based PC (Pentium 4, 2.0 GHz) with OpenGL, and were
back-projected on a screen with LC projector (EPSON,
ELP-7700). The frame rate was 60 Hz. The image size was
1024 × 768 pixels (0.3 mm/pixel), or 82 × 67 deg from a
viewing distance of 1 m (an appropriate distance for view-
ing the stimulus produced with perspective projection).
The height of the projected area of the visual image on the
screen was adjustable to the vantage point of each
observer in the standing position so that visual scene was
horizontal. The experimental room was light-proofed; no
lights other than the projector were on during the experi-
ment.
Observers' postural movements were measured with two
different parameters: center of foot pressure (COP) and
head position. First, the COP was measured by a force
platform system (Kyowa Electronic Instruments, M98-
6188), which recorded pressure data for four different
points on the platform at 100 Hz using strain gauges. The
data underwent a 12 bit AD conversion. Based on the dig-
itized data, the COP was calculated; the maximum error of
the COP was within ± 1.63 mm over 30 kg of body weight.
Second, head position was measured in six degrees of free-
dom (the rotations and translations along the axes of yaw,
pitch and roll of the standing observer) by an electromag-
netic tracking system (Polhemus 3 space Fastrack). The
transmitter for the system was positioned just above the
observer's head, 218 cm above the surface of the force
platform. The receiver for the system was attached on the
top of a helmet worn by the observer. The head position
data were measured and recorded at 30 Hz, with a spatial
resolution of 0.025 deg (0.0002 inches) and a time delay
from position changes to detection of 4.0 ms.
Procedure
Before starting the experimental trials, we measured the
height of each observer's eye position to adjust the height
of the visual image on the screen. Then, observers were
dark adapted with eye masks in the dark experimental
room for 10 minutes. Each observer carried out four trials,
corresponding to each of the combinations of visual rota-
tion directions (clockwise/counterclockwise, or CW/
CCW) along the roll axis and the two different stimuli: the
random-dot or CG image stimulus. The order of the com-
binations was counterbalanced across observers.
At the beginning of each trial, the observer stood on the
force platform and their baseline COP and head position
were recorded. Each trial started with stationary image for
10 s, and then the moving image was presented for 120 s,
followed by the stationary image for 60 s. The observer
was instructed to assume the standard Romberg stance on
the force platform and to passively look at the stimulus in
the standing position. Whenever the observer perceived
self-motion (i.e., vection), they pressed a button held in
their left hand. Button presses were recorded at 60 Hz.
After the trial, the observer reported vection strength over
The two different visual contextsFigure 2
The two different visual contexts. Textures presented
on a wall of the rectangular solid were either (a) a random-
dot texture, or (b) a CG-image that simulated an ordinary
room.
Schematic illustration of the virtual environmentFigure 1
Schematic illustration of the virtual environment.
Observers stood at the center of the rectangular space
whose wall was textured with one of the two different pat-
terns shown in Figure 2.
Journal of NeuroEngineering and Rehabilitation 2007, 4:39 />Page 4 of 11
(page number not for citation purposes)
the trial on an 11 point scale with 0 representing "no vec-
tion was perceived," and 10 representing "vection so
strong that the perceived self-motion could not be differ-
entiated from real physical motion."
Data analysis
Experimental data obtained from three out of the 18
observers were discarded, resulting in 15 observers (11
females and 4 males; 36.9 ± 12.8 years). Two of these
observers did not perceive vection in all trials or they only
perceived vection in one trial. The third observer whose
data was discarded often held the safety bar when watch-
ing the stimulus to avoid falling down; he strongly per-
ceived vection in all trials.
We re-sampled the COP and head position data at 60 Hz
to compare these data across different periods, which were
categorized based on the subjective responses of vection
or no-vection. Because the data were originally sampled at
different rates for different parameters, (the COP at 100
Hz, the head position at 30 Hz and the subjective
response at 60 Hz), the re-sampled data at 60 Hz were
obtained by weighted averaging of the two adjacent origi-
nally sampled data points for each parameter. Moreover,
the COP and head position data were decomposed into
those in the left/right (L/R) and anterior/posterior (A/P)
directions, to look separately at the data parallel and
orthogonal to the stimulus projection surface.
The data were examined both within the trials and across
the trials. First, the data were examined within each trial
to investigate the effects of visual-stimulus-motion and
vection on postural movement, and the after-effects. To
investigate the effects of visual-stimulus-motion and vec-
tion, we separated the COP and head position data into
two different pairs of periods: one, visual-stimulus-
motion versus no-visual-stimulus-motion, and two, vec-
tion versus no-vection. Here, the visual-stimulus-motion
represents motion of visual image, while no-visual-stimu-
lus-motion represents no motion of visual image. The
period of no-visual-stimulus-motion corresponded to the
first 10 s of each trial, in which the visual stimulus was sta-
tionary. To investigate the after-effects, we looked at the
COP and head position data obtained after the end of the
visual-stimulus-motion. We calculated averages for 10 s
periods starting from just after the end of the visual-stim-
ulus-motion, and the averages were continuing with shift-
ing the 10 s period every 1/60 s until the end of the period
reached to the end of the trial.
Second, the data were examined across the trials to inves-
tigate the effects of repeated exposure to the stimulus on
vection and postural movement. We compared four dif-
ferent psychophysical parameters of vection across the tri-
als: (1) onset latency of circular-vection (i.e., the time
elapsed between the onset of optokinetic stimulation and
the first subjective report of perceived self-motion), (2)
the number of vection episodes, (3) the total time spent
perceiving circular-vection within the 120 s period of vis-
ual-stimulus-motion in a trial, and (4) the observer's rat-
ings of vection strength.
In the analyses described above, we examined averages of
the COP and head position data across all the trials and all
the observers. Before taking the averages across all the tri-
als, we made bias corrections for the COP and head posi-
tion data within each trial by subtracting average values of
the COP or head position during the initial no-visual-
stimulus-motion period from the original values. Then,
the sign of values in the L/R direction for trials in which
the stimulus rotated in the CCW direction was inverted.
All the averaged data described below were calculated
using this process unless otherwise specified. Positive val-
ues for the COP and head position data in the L/R direc-
tion indicate that the sway occurred toward the right.
Positive values in the A/P direction indicate that the sway
occurred as forward motion. The statistics appeared will
be t-test, otherwise specified.
Results
Postural response in rotation
During stimulus presentation, body sway and head posi-
tion changed in the same direction as the visual stimulus
rotation for all observers. That is, the observer's body
inclined rightward when the stimulus rotated in a clock-
wise direction. Moreover, postural instability of the COP
and head position changes also occurred during stimulus
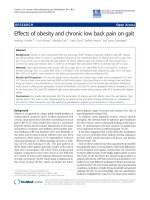
presentation. This is shown in Figure 3, which illustrates
the typical data for COP and head position in a single trial
for one observer during rightward of visual roll motion.
To look at these changes of postural sway and postural
instability in detail, we examined the COP and head posi-
tion data in terms of average position and fluctuation of
positions, and compared each of them between different
periods: visual-stimulus-motion versus no-visual-stimu-
lus-motion, and vection versus no-vection. The average
positions were computed for each COP and head position
as arithmetic averages across periods of the identical con-
dition (visual-stimulus-motion or no-visual-stimulus-
motion) or of the same category of perception (vection or
no-vection). The fluctuations were analyzed as averaged
standard deviation, or averaged-SD, that was computed
for each COP and head position as arithmetic averages of
standard deviations across periods of the identical condi-
tion or of the same category of perception.
The postural movement represented by COP and head
position clearly deviated in the direction of visual stimu-
lus rotation, and this was more pronounced during peri-
ods of vection. The average COPs during vection and no-
Journal of NeuroEngineering and Rehabilitation 2007, 4:39 />Page 5 of 11
(page number not for citation purposes)
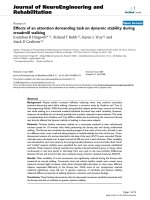
Mean postural responses for the L/R and A/P directionsFigure 4
Mean postural responses for the L/R and A/P directions. (a) Mean of COP or head position during vection and no-vec-
tion in both the L/R and A/P directions. Also shown are the continuous mean values of mean of either (b) COP or (c) head
position after the visual stimulus motion ceased. The two data points in the left-most part of (b) and (c) represent averaged val-
ues in the L/R and A/P directions during visual-stimulus-motion.
Sample data for head position, COP, and vection responses in a typical trialFigure 3
Sample data for head position, COP, and vection responses in a typical trial. The data labeled as motion indicates
the period of visual-stimulus-motion, while the data labeled as no-motion indicates the periods of no-visual-stimulus-motion.
The positive vertical values indicate that head position and COP changes were in the direction of the visual-stimulus-motion.
The value zero in the ordinate represents the average value during no-visual-stimulus-motion, prior to any visual-stimulus-
motion.
vection are shown in Figure 4a, with positive values of
COP matching the direction of the visual stimulus rota-
tion. The average COP in the L/R direction during vection
was significantly greater than that during no-vection (p <
0.001). In contrast, the average COP in the A/P direction
during vection did not differ significantly from that dur-
ing no-vection (p > 0.1). The average head positions dur-
ing vection and no-vection are also shown in Figure 4a.
Consistent with the COP results, the average head posi-
tion in the L/R direction during vection was significantly
greater than that during no-vection (p < 0.01), and the
average head position in the A/P direction did not differ
significantly between vection and no-vection (p > 0.1).
Moreover, the average COP and head position in the L/R
Journal of NeuroEngineering and Rehabilitation 2007, 4:39 />Page 6 of 11
(page number not for citation purposes)
direction were significantly greater during visual-stimu-
lus-motion than during no- visual-stimulus-motion (for
COP, p < 0.01; for head position, p < 0.001). No signifi-
cant differences were seen for the motion/no-motion
comparisons in the A/P direction for COP and head posi-
tion (p > 0.1).
Postural movements clearly fluctuated in the L/R and A/P
directions, and this was more pronounced during periods
of vection. As shown in Figures 5a, the averaged-SD of
COP in both the L/R and A/P directions during vection
were significantly greater than those during no-vection (p
< 0.05). Figure 5a depicted also the averaged-SD of head
position during vection and no-vection. The averaged-SD
of head position in both the L/R and A/P directions during
vection were significantly greater than those during no-
vection (for L/R, p < 0.01; for A/P, p < 0.05). Moreover, the
averaged-SD of COP and head position in both the L/R
and A/P directions during visual-stimulus-motion were
significantly greater than those during no-visual-stimulus-
motion (p < 0.001). In addition, for COP in motion and
head position in no-motion, the averaged-SD did not dif-
fer significantly between the L/R and A/P directions (p >
0.1). Similarly, the averaged-SD of COP and head posi-
tion in both the no-vection and the vection periods did
not differ between the L/R and A/P directions (p > 0.1).
Postural response after rotation ceased
Immediately following the end of the visual stimulus rota-
tion, COP in the L/R direction changed drastically. The
values for COP and head position decreased steeply
immediately after the visual-stimulus-motion ended (130
s into the trial), as illustrated in Figure 6, in which the
COP and head position recordings averaged across all tri-
als for all 15 observers are shown from 120 s after the trial
started to the end of the trial. Moreover, COP decreased to
Averaged-SD of postural responses for L/R and A/P directionsFigure 5
Averaged-SD of postural responses for L/R and A/P directions. (a) Averaged-SD of COP or head position during vec-
tion and no-vection in both the L/R and A/P directions. Also shown are the continuous values of averaged-SD of either (b)
COP or (c) head position after the visual stimulus motion ceased. The two data points in the left-most part of (b) and (c) rep-
resent averaged-SD in the L/R and A/P directions during visual-stimulus-motion.
Journal of NeuroEngineering and Rehabilitation 2007, 4:39 />Page 7 of 11
(page number not for citation purposes)
a negative value, indicating that COP was inclined in the
opposite direction relative to the postural sway that
occurred during visual-stimulus-motion. Although head
position also switched to the opposite direction during
visual-stimulus-motion, it did not reach a negative value
for the duration of the after-motion period, as shown in
Figure 6.
The COP and head position data in terms of average posi-
tion and averaged-SD were subsequently compared across
different periods: no-vection versus vection during visual
stimulus rotation, as well as across successive 10 s periods
starting from just after the end of the visual-stimulus-
motion and continuing every 1/60 s until the end of 10 s
period reached to the end of the trial. The values were
arithmetically averaged across all the trials for all the
observers in each of the L/R and A/P directions, and are
shown in Tables 1, 2, 3 and 4 along with the standard
deviations. The detailed time-series data are shown graph-
ically in Figures 4c and 4d, and 5c and 5d. The values were
calculated by taking average and standard deviation, or
SD, of the data sampled at 60 Hz for 10 s periods starting
the end of the visual stimulus rotation and continuing
until the end of 10 s period reached to the end of the trial.
The average and SD values were further averaged across all
the trials for all the observers in each of the L/R and A/P
directions. Those average values are plotted at the middle
of the period from when the values were averaged; for
example, the COP value averaged between the periods of
130 and 140 s is plotted at 135 s along the abscissa.
The detailed analysis confirmed our above findings
regarding the postural movement immediately after the
cessation of the visual stimulus rotation. Using t-tests, we
compared the average COP or head position values for the
10 s period from 140 to 150 s with those during the 10 s
no-visual-stimulus-motion period prior to visual stimulus
rotation. We found that the average COP in the L/R direc-
tion steeply decreased to a negative value during the 140
to 150 s period as compared to the pre-motion value (p <
0.01). In contrast, the average COP in the A/P direction
and the average head position in the L/R and A/P direc-
tion essentially returned to their initial position prior to
the visual-stimulus-motion, showing no significant differ-
ences pre- and post-motion for A/P COP, L/R head posi-
tion, and A/P head position (p > 0.1). Averaged-SD for
both measures in both directions decreased back to their
values shown during the initial no-motion period. As a
result, no significant differences were seen for pre- and
post-visual-stimulus-motion comparisons for L/R COP,
A/P COP, L/R head position, and A/P head position (p >
0.1).
Across trial differences
Two of the four different psychophysical parameters of
vection (the number of vection episodes and vection
strength) differed slightly across the four trials, as shown
in Figure 7. Analysis of variance showed the effect of trial
was significant for the number of vection episodes and
Table 1: Averages of center of foot pressure during and after
visual-stimulus-motion
period
*1
L/R A/P
average SD average SD
no-vection 1.10 6.84 0.59 7.36
vection 7.65 6.74 -0.30 8.69
130 to 140s -1.66 5.96 -0.55 11.26
140 to 150s -5.31 6.51 -0.38 10.48
150 to 160s -3.67 5.52 -1.11 9.44
160 to 170s -3.17 5.24 -1.59 8.80
170 to 180s -2.79 5.57 -0.18 8.47
180 to 190s -4.11 5.59 0.95 8.46
*1
: The numbers represent the time (s) after the trial started.
Averaged head position and COP for latter part of experi-mental trialFigure 6
Averaged head position and COP for latter part of
experimental trial. The data labeled as motion indicates
the period of visual-stimulus-motion, while the data labeled
as no-motion indicates the periods of no-visual-stimulus-
motion.
Table 2: Averages of head position during and after visual-
stimulus-motion
period
*1
L/R A/P
average SD average SD
no-vection 7.86 22.67 -2.42 14.70
vection 29.13 24.50 -0.66 19.08
130 to 140s 13.84 20.25 0.69 24.04
140 to 150s 3.02 16.26 0.22 19.57
150 to 160s 2.97 13.13 1.12 17.60
160 to 170s 2.54 10.75 1.65 16.58
170 to 180s 1.48 11.46 -1.01 15.46
180 to 190s -2.07 11.29 -2.42 14.31
*1
: The numbers represent the time (s) after the trial started.
Journal of NeuroEngineering and Rehabilitation 2007, 4:39 />Page 8 of 11
(page number not for citation purposes)
vection strength (p < 0.01). However, there was no effect
of trial for vection onset latency and the duration of vec-
tion episodes (p > 0.1). For the number of vection epi-
sodes and vection strength, however, the results were not
significant when corrected for multiple comparisons.
As shown in Figure 8, the COP and head position in the
L/R direction differed slightly across the four trials during
visual-stimulus-motion. Analysis of variance showed the
effect of the trial was significant in the L/R direction for
both COP (p < 0.01) and head position (p < 0.05). No sig-
nificant effects were seen for the equivalent across trial
comparisons in the A/P direction for COP and head posi-
tion (p > 0.1).
Stimulus differences
When the two visual stimuli were compared, no signifi-
cant differences were seen across the various psychophys-
ical parameters of vection, or for the average position and
fluctuation of postural movement (for all t-tests, p > 0.1).
Discussion
Our results suggested that visual motion in itself affects
postural control. Postural sway, measured in the present
study in terms of COP and head position, was signifi-
cantly larger during visual-stimulus-motion without vec-
tion than during no-visual-stimulus-motion. Postural
sway during visual-stimulus-motion without vection,
however, was significantly smaller than periods of visual-
stimulus-motion with vection, consistent with previous
studies [14-16]. These results suggest that the increasing
postural sway seen with visual-stimulus-motion is not
simply attributable to vection induced by visually simu-
lated rotation.
Postural sway in both L/R and A/P directions across different trialsFigure 8
Postural sway in both L/R and A/P directions across
different trials. Means of the postural responses measured
during visual-stimulus-motion.
Table 4: Averaged standard deviation of head position during and
after visual-stimulus-motion
period
*1
L/R A/P
average SD average SD
no-vection 1.46 0.96 1.10 1.33
vection 2.26 2.03 1.85 1.37
130 to 140s 2.76 2.44 1.31 1.05
140 to 150s 1.20 0.86 1.17 0.88
150 to 160s 1.17 0.75 1.08 0.66
160 to 170s 1.09 0.84 1.14 0.80
170 to 180s 1.14 0.78 1.09 0.82
180 to 190s 1.13 0.68 1.07 0.69
*1
: The numbers represent the time (s) after the trial started.
Table 3: Averaged standard deviation of center of foot pressure
during and after visual-stimulus-motion
period
*1
L/R A/P
average SD average SD
no-vection 1.40 0.57 1.15 0.87
vection 1.81 0.86 1.69 0.84
130 to 140s 1.85 1.08 1.22 0.72
140 to 150s 1.06 0.51 1.09 0.65
150 to 160s 1.05 0.45 0.97 0.53
160 to 170s 1.00 0.49 1.02 0.61
170 to 180s 1.07 0.48 0.97 0.65
180 to 190s 1.04 0.40 0.98 0.50
*1
: The numbers represent the time (s) after the trial started.
Vection parameters across different trialsFigure 7
Vection parameters across different trials. Means of
the psychophysical parameters of circular vection measured
during the perception of vection for each trial.
Journal of NeuroEngineering and Rehabilitation 2007, 4:39 />Page 9 of 11
(page number not for citation purposes)
Postural sway during visual-stimulus-motion without vec-
tion showed two definite characteristics. First, the direc-
tion of postural sway was parallel to the plane of the
visually presented roll motion, consistent with previous
findings during visual-stimulus-motion with vection
[14,15]. That is, postural sway occurred in the L/R direc-
tion, but not in the A/P direction, when the visually sim-
ulated roll motion was presented in the frontoparallel
plane. Second, postural sway in the L/R direction consist-
ently corresponded to the direction of the visually simu-
lated roll motion. For example, observers inclined
rightward when the stimulus rotated in the clockwise
direction. These two characteristics found for postural
sway during visual-stimulus-motion without vection are
consistent with those reported previously for postural
sway during vection [14,15], and these characteristics dur-
ing vection were replicated in the present study. Thus, the
direction of postural sway was parallel to that of the visu-
ally presented roll motion that induced vection, and pos-
tural sway in the L/R direction consistently corresponded
to the direction of visual rotation that induced vection.
These common characteristics indicated that visual
motion signals were processed in the same manner,
whether or not they induced vection.
The results demonstrating an increment in postural insta-
bility, or small fluctuations of body movements, during
visual-stimulus-motion may be most consistent with a
postural control mechanism that does not rely upon vis-
ual information. In the present study, postural instability
significantly increased during visual rotation, and further
increased during vection perception. Because of this incre-
ment during vection, it can be concluded that vection
itself affects postural instability. Also of note, in contrast
to postural sway, postural instability increased not only in
the L/R direction but also in the A/P direction during the
presentation of a visually simulated roll motion stimulus,
and the increase did not differ significant between the two
directions. Duarte and Zatsiorsky [21] reported that varia-
bility of COP displacement, equivalent to postural insta-
bility as described here, increased when participants
occupied leaning postures. Moreover, they showed that
the variability of COP displacement increased isotropi-
cally in all horizontal directions. This result resembles the
present findings of postural instability increasing in both
the L/R and A/P directions. Of primary importance, they
found that the isotropic increment of the COP area
occurred irrespective of whether visual information was or
was not available and proposed that this finding may have
been due to changes in the pressure distribution on the
soles of the feet in leaning positions. Such changes would
modify the tactile information available to postural con-
trol mechanisms and diminish the usefulness of the infor-
mation. Because the present results showing increased
postural instability during vection perception resemble
the results described above during leaning, a similar
explanation involving changes in the pressure distribu-
tion on the soles of the feet may underlie the findings.
Moreover, the relative increment of postural instability
during vection as compared to no vection may be induced
by postural sway caused by the vection, but not induced
by vection in itself.
The result that visual-stimulus-motion inducing postural
sway did not necessarily induce vection may be explained
by different thresholds of processing visual motion signals
for postural control as compared to vection perception
mechanisms. Our results, together with that of previous
study [15], suggested that both mechanisms use the same
visual information. However, postural sway was even
larger during visual-stimulus-motion with no-vection per-
ception than when there was no-visual-stimulus-motion.
Therefore, thresholds for postural control and vection
mechanisms for processing visual information may be dif-
ferent. This was previously suggested by Previc and Mul-
len [18] in their discussion of the reasons underlying the
different latencies for postural sway and vection. Based on
the present results, we developed a schematic diagram
illustrating the processes underlying postural control and
vection. As shown in Figure 9, both visual and non-visual
signals, such as vestibular and somatosensory informa-
tion about body orientation, are used for postural control
and vection mechanisms. The mechanisms weight the sig-
A model of the relationship between postural control and vectionFigure 9
A model of the relationship between postural control
and vection. Visual and non-visual signals are used for both
vection and postural control mechanisms.
Journal of NeuroEngineering and Rehabilitation 2007, 4:39 />Page 10 of 11
(page number not for citation purposes)
nals; if the visual signal exceeds the threshold, postural
sway and vection will occur. Strictly speaking, we cannot
be certain whether the weights of visual signals in the two
mechanisms are different, or the thresholds are different,
or both. In the model, postural instability is determined
by postural sway (affected by visual and non-visual infor-
mation) and directly by non-visual information.
In contrast to Previc and Mullen's and Clément et al.'s and
reports [18,19] focusing on latencies, our study showed
the different effects of visual rotation on postural control
between alternations of perceived vection and no per-
ceived vection. Postural sway was significantly larger
when vection was perceived as compared to when no vec-
tion was perceived. As per the proposed model in Figure
9, the increment of postural sway during vection occurred
at suprathreshold level. One possible explanation for this
increment may be that the frame of reference for body ori-
entation was shifted when vection was perceived. This
shift in the perception mechanism would have also
affected postural sway. As there has been considerable dis-
cussion on frames of reference, including the proposition
that visual perception and postural control have different
frames of reference [22,23], investigation into the relation
between the type of results shown here and different
frames of reference is warranted in future.
After the visual-stimulus-motion stopped, the COP and
head position in the L/R direction did not move in the
same manner. While the averaged COP inclined in the
opposite direction relative to the postural sway that
occurred during visual-stimulus-motion, the averaged
head position simply returned to the initial position seen
prior to visual-stimulus-motion. This may be related to
the larger effects of vection on head movements than on
body movements, as suggested by Mizuno et al. [24]. Dur-
ing visual-stimulus-motion, the average head position
inclined more than the body, or COP, as shown in Figure
3a, presumably because of the effects of vection. When the
visual-stimulus-motion ceased, the averaged body posi-
tion tended to move back to the upright position, as pre-
viously shown in ankle muscle stiffness [25]. However, at
that time the head was still inclined relative to the body in
the same direction as the postural sway that occurred dur-
ing visual-stimulus-motion. The reason for this is not
clear, and the motion after-effect reported by most of the
observers upon cessation of the visual-stimulus-motion
might have been weak to induce vection that could move
the head back to straight position relative to the body.
Because of the relative inclination of the head relative to
the body, the body, or the COP, might have had to incline
beyond the upright position.
One finding that remains to be explained is the lack of any
effect of stimulus type. The results did not show a differ-
ence in vection and postural sway between the random-
dot pattern and the CG-image simulating a room. The
information included in the CG-image, such as gravita-
tional direction, horizontal/vertical lines and familiar
objects, was expected to provide particularly strong cues
for perceived self-rotation. However, the additional cues
may have been ineffective in our stimulus situation
because the visually simulated roll motion was constant
and continuous for both visual contexts.
Although we did not find clear evidence for habituation of
postural sway in our experimental paradigm, we did iden-
tify some across-trials differences for two of the psycho-
physical parameters of vection (the number of vection
episodes and vection strength), as well as across-trial dif-
ferences in the average COP and head position in the L/R
direction. The other two psychophysical parameters con-
cerning vection (vection onset latency and the duration of
vection episodes) did not differ across trials. While the
cause of the discrepancy across the different vection
parameters is not certain, we speculate that the experi-
mental paradigm did not induce a large degree of habitu-
ation.
VR is increasingly been applied as a rehabilitation tool
[26]. One problem with this is that rehabilitants in a VR
system sometimes suffer from motion sickness [27].
Because motion sickness is often correlated with vection,
based on our results it appears that conditions that readily
cause motion sickness may also increase the occurrence of
increased postural sway and falling. Therefore, it is impor-
tant to determine which conditions most readily induce
vection and motion sickness so that these effects can be
countered.
Acknowledgements
This study was subsidized by the Japan Keirin Association through its Pro-
motion funds from KEIRIN RACE and was supported by the Mechanical
Social Systems Foundationand the Ministry of Economy, Trade and Indus-
try.
This study was also carried out under the Standard Authentication R&D
Program, "Standardization of Assessment Method for Visual Image Safety,"
promoted by the Ministry of Economy, Trade and Industry in Japan.
References
1. Reason JT, Brand JJ: Motion sickness London: Academic Press; 1975.
2. Riva G: Applications of virtual environments in medicine.
Methods Inf Med 2003, 42:524-534.
3. Sveistrup H: Motor rehabilitation using virtual reality. J Neuro-
engineering Rehabil 2004, 1:10.
4. Kenyon RV, Leigh J, Keshner EA: Considerations for the future
development of virtual technology as a rehabilitation tool. J
Neuroengineering Rehabil 2004, 1:13.
5. Ohmi M: Egocentric perception through interaction among
many sensory systems. Brain Res Cogn Brain Res 1996, 5:87-96.
6. Nakayama K: Properties of early motion processing: Implica-
tions for the sensing of egomotion. In Perception and Control of
Selfmotion Edited by: Warren R, Wertheim AH. Laurence Erlbaum
Associates, Hillsdale; 1990:69-80.
Publish with BioMed Central and every
scientist can read your work free of charge
"BioMed Central will be the most significant development for
disseminating the results of biomedical research in our lifetime."
Sir Paul Nurse, Cancer Research UK
Your research papers will be:
available free of charge to the entire biomedical community
peer reviewed and published immediately upon acceptance
cited in PubMed and archived on PubMed Central
yours — you keep the copyright
Submit your manuscript here:
/>BioMedcentral
Journal of NeuroEngineering and Rehabilitation 2007, 4:39 />Page 11 of 11
(page number not for citation purposes)
7. Warren WH Jr: Self-motion perception: Visual perception and
visual control. In Perception of Space and Motion Edited by: Epstein
W, Rogers S. Academic Press, San Diego; 1995:263-325.
8. Paulus WM, Straube A, Brandt T: Visual stabilization of posture.
Physiological stimulus characteristics and clinical aspects.
Brain 1984, 107:1143-1163.
9. Keshner EA, Kenyon RV, Langston J: Postural responses exhibit
multisensory dependencies with discordant visual and sup-
port surface motion. J Vestib Res 2004, 14:307-19.
10. Brandt T, Dichgans JM, Koenig E: Differential effects of central
versus peripheral vision on egocentric and exocentric
motion perception. Exp Brain Res 1973, 16:476-491.
11. Howard IP, Heckmann T: Circular vection as a function of the
relative sizes, distances, and positions of two competing vis-
ual displays. Perception 1989, 18:657-665.
12. Dichgans JM, Brandt T: Visual-vestibular interaction: effect on
self-motion and postural control. In Handbook of sensory physiol-
ogy Edited by: Held R, Leibowitz HW, Teuber H-L. Springer, Berlin;
1978:755-804.
13. Amblard B, Carblanc A: Role of foveal and peripheral visual
information in maintenance of postural equilibrium in man.
Percept Mot Skills 1980, 51:903-12.
14. Wolsley CJ, Buckwell D, Sakellari V, Bronstein AM: The effect of
eye/head deviation and visual conflict on visually evoked pos-
tural response. Brain Res Bull 1996, 40:437-442.
15. Thurrell AEI, Bronstein AM: Vection increases the magnitude
and accuracy of visually evoked postural responses. Exp Brain
Res 2002, 147:558-560.
16. Kuno S, Kawakita T, Kawakami O, Miyake Y, Watanabe S: Postural
Adjustment Response to Depth Direction Moving Patterns
Produced by Virtual Reality Graphics. Jpn J Physiol 1999,
49:417-424.
17. Fushiki H, Kenji K, Masatsugu A, Yukio W: Influence of visually
induced self-motion on postural stability. Acta Otolaryngol 2005,
125:60-64.
18. Previc FH, Mullen TJ: A comparison of the latencies of visually
induced postural change and self-motion perception. J Vestib
Res 1990, 1:317-323.
19. Clément G, Jacquin T, Berthoz A: Habituation of postural read-
justments induced by motion of visual scenes. In Vestibular and
visual control on posture and locomotor equilibrium Edited by: Igarashi M,
Black OF. Karger, Basel; 1985:99-104.
20. van Asten WN, Gielen CC, van der Gon JJ: Postural movements
induced by rotations of visual scenes. J Opt Soc Am A 1988,
5:1781-1789.
21. Duarte M, Zatsiorsky VM: Effects of body lean and visual infor-
mation on the equilibrium maintenance during stance. Exp
Brain Res 2002, 146:60-69.
22. Lee DN, Lishman JR: Visual proprioceptive control of stance. J
Hum Mov Std 1975, 1:87-95.
23. Goodale MA, Milner AD: Separate visual pathways for percep-
tion and action. Trends Neurosci 1992, 15:20-25.
24. Mizuno Y, Shindo M, Kuno S, Kawakita T, Wanatabe S: Postural
control responses sitting on unstable board during visual
stimulus. Acta Astronaut 2001, 49:131-136.
25. Winter DA, Patla AE, Price F, Ishac M, Gielo-Perczak K: Stiffness
control of balance in quiet standing. J Neurophysiol 1998,
80:1211-1221.
26. Keshner EA, Kenyon RV: Using immersive technology for pos-
tural research and rehabilitation. Assist Technol 2004, 16:54-62.
27. Lo WT, So RH: Cybersickness in the presence of scene rota-
tional movements along different axes. Appl Ergon 2001,
32:1-14.