báo cáo hóa học: " A brain-computer interface with vibrotactile biofeedback for haptic information" pot
Bạn đang xem bản rút gọn của tài liệu. Xem và tải ngay bản đầy đủ của tài liệu tại đây (687.91 KB, 12 trang )
BioMed Central
Page 1 of 12
(page number not for citation purposes)
Journal of NeuroEngineering and
Rehabilitation
Open Access
Research
A brain-computer interface with vibrotactile biofeedback for haptic
information
Aniruddha Chatterjee*
1
, Vikram Aggarwal
1
, Ander Ramos
2
,
Soumyadipta Acharya
1
and Nitish V Thakor
1
Address:
1
Department of Biomedical Engineering, The Johns Hopkins University, Baltimore, MD, USA and
2
Department of Biomedical
Engineering, Fatronik Technological Foundation, Spain
Email: Aniruddha Chatterjee* - ; Vikram Aggarwal - ; Ander Ramos - ;
Soumyadipta Acharya - ; Nitish V Thakor -
* Corresponding author
Abstract
Background: It has been suggested that Brain-Computer Interfaces (BCI) may one day be suitable
for controlling a neuroprosthesis. For closed-loop operation of BCI, a tactile feedback channel that
is compatible with neuroprosthetic applications is desired. Operation of an EEG-based BCI using
only vibrotactile feedback, a commonly used method to convey haptic senses of contact and
pressure, is demonstrated with a high level of accuracy.
Methods: A Mu-rhythm based BCI using a motor imagery paradigm was used to control the
position of a virtual cursor. The cursor position was shown visually as well as transmitted haptically
by modulating the intensity of a vibrotactile stimulus to the upper limb. A total of six subjects
operated the BCI in a two-stage targeting task, receiving only vibrotactile biofeedback of
performance. The location of the vibration was also systematically varied between the left and right
arms to investigate location-dependent effects on performance.
Results and Conclusion: Subjects are able to control the BCI using only vibrotactile feedback
with an average accuracy of 56% and as high as 72%. These accuracies are significantly higher than
the 15% predicted by random chance if the subject had no voluntary control of their Mu-rhythm.
The results of this study demonstrate that vibrotactile feedback is an effective biofeedback modality
to operate a BCI using motor imagery. In addition, the study shows that placement of the
vibrotactile stimulation on the biceps ipsilateral or contralateral to the motor imagery introduces
a significant bias in the BCI accuracy. This bias is consistent with a drop in performance generated
by stimulation of the contralateral limb. Users demonstrated the capability to overcome this bias
with training.
Background
A Brain-Computer Interface (BCI) uses electrophysiologi-
cal measures of brain activity to enable communication
with external devices, such as computers and prostheses.
Recent breakthroughs in the development of BCI have
enabled practical applications that may help users with
severe neuromuscular disabilities. By modulating changes
in their electroencephalographic (EEG) activity, BCI users
Published: 17 October 2007
Journal of NeuroEngineering and Rehabilitation 2007, 4:40 doi:10.1186/1743-0003-4-40
Received: 31 March 2007
Accepted: 17 October 2007
This article is available from: />© 2007 Chatterjee et al; licensee BioMed Central Ltd.
This is an Open Access article distributed under the terms of the Creative Commons Attribution License ( />),
which permits unrestricted use, distribution, and reproduction in any medium, provided the original work is properly cited.
Journal of NeuroEngineering and Rehabilitation 2007, 4:40 />Page 2 of 12
(page number not for citation purposes)
have demonstrated two-dimensional cursor control and
the ability to type out messages on virtual keyboards [1-5].
A survey of individuals with upper-limb loss suggests that
improving prosthetic control capabilities is a top priority
in the community [6]. Most of these individuals are cur-
rently limited to cumbersome prostheses with myoelectric
control or cable-operated systems and many in fact
choose to avoid the hassle of a prosthesis [7,8]. It has been
suggested that advances in BCI may eventually allow for
control of neuroprostheses [9,10], with research groups
already having demonstrated invasive cortical control of
mechanical actuators in humans and nonhuman primates
[11-13].
Of the numerous hardware and signal processing issues
that must be resolved to make this goal a reality, one
important factor which merits attention is the nature of
the BCI biofeedback to the user. Conventional BCIs
designed for the paralyzed have utilized a visual interface,
such as a computer cursor or virtual keyboard, to close the
control loop between the subject and the interface. While
this modality is suitable for situations where the BCI user
is interested in only the position and configuration of the
controlled device, visual feedback is inadequate for grasp-
ing objects where haptic (relating to touch) senses such as
grasping force are desired. To overcome this deficiency, a
haptic information channel such as vibrotactile feedback
can provide the user with the appropriate sensory infor-
mation from a neuroprosthesis.
Vibrotactile feedback is a simple and compact mechanism
commonly used in noninvasive haptic feedback systems
because it is safe, straightforward to implement, and frees
the user from having to maintain visual attention of the
actuator [14]. Many vibrotactile feedback systems have
been developed to convey information through a tactile
interface when visual attention was deemed inefficient or
unnecessary [15]. Prior prosthetics research also investi-
gates how such feedback systems are used to convey the
intensity of grasping force [16,17]. Since any advanced
neuroprosthetic control will inevitably require communi-
cating different haptic inputs to the user, the integration
of haptic biofeedback to BCI applications deserves to be
investigated.
This study uses a vibrotactile stimulus to provide one-
dimensional feedback of a specific parameter, such as the
output of a force sensor. The vibrotactile feedback is
placed on the arm in order to mimic sensory stimulation
provided on the residual limb of an amputee. Feedback at
this location has been used in previous studies testing
haptic feedback with upper-limb prostheses [18-20]. The
BCI platform used to control this parameter is based on
the modulation of Mu (8–12 Hz) rhythm activity via
motor imagery tasks, which is a well-documented BCI
control strategy [21-23]. Actual or imagined motor move-
ments result in an event-related desynchronization (ERD)
in spectral power at these frequencies over the sensorimo-
tor cortex. Subjects can learn to modulate their Mu-band
power to produce a 1-D control signal. The platform is
designed to distinguish between three states: relaxation
and two separable desynchronization patterns that are
operant-conditioned from a starting baseline of right
hand versus left hand motor imagery. This control para-
digm can enable the Open, Close, and Rest commands
needed to actuate an upper-limb prosthetic device in real
time.
The goal of the study is to demonstrate that vibrotactile
biofeedback is an effective method to enable closed-loop
BCI control. This is a necessary step for the integration of
a haptic information channel with a BCI-controlled pros-
thesis. Accuracy and latency statistics of BCI control using
only vibrotactile biofeedback are presented to demon-
strate the feasibility of the novel feedback approach. In
addition, performance with vibrotactile feedback ipsilat-
eral to hand motor imagery is compared to performance
with feedback contralateral to hand motor imagery in
order to determine whether the subjects' ability to modu-
late Mu rhythms is related to the location of the vibrotac-
tile stimulus.
Methods
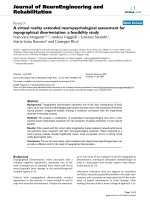
Experimental Setup
Subjects used a three-state EEG-based BCI to control a
parameter in one dimension (see Fig. 1a). Upon hearing
an auditory cue of either High or Low, the subject would
use the corresponding motor imagery task to move the
parameter value to opposite levels. Two methods of feed-
back were supported for the BCI; 1) a visual interface that
showed the parameter position on a horizontal bar on a
monitor 3 ft from the subject and 2) a vibrotactile feed-
back system that conveyed the parameter state by modu-
lating the pulse rate of a vibrating voice coil motor placed
on the subject's arm. Subjects were trained with both the
visual and vibrotactile interfaces simultaneously, and
then moved to the vibrotactile interface only for data col-
lection. The location of the vibration was also systemati-
cally varied between arms to investigate location-
dependent effects on performance (see Fig. 1b).
For High cues, the subject used right hand motor imagery
to increase the frequency of vibration to the maximum
level (Level 7), whereas for Low cues the subject used left
hand motor imagery to decrease the frequency of vibra-
tion to the minimum level (Level 1). Each trial began at a
mid-level vibration (Level 4) that did not correspond to
either Low or High, and the subject failed the task if they
remained in this region (Level 2–6). The visual interface
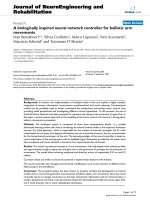
Journal of NeuroEngineering and Rehabilitation 2007, 4:40 />Page 3 of 12
(page number not for citation purposes)
shown in Fig. 2 mirrored the vibrotactile stimulus, incre-
menting or decrementing in 7 discrete levels, and with
Low and High target endpoints at the extreme left and right
respectively.
A total of six healthy male adults (aged 21–25) partici-
pated in the study. Subjects A, B, D and F had no previous
BCI training, while Subjects C and E had 25 and 12 hours
of previous BCI training respectively. Informed consent
was obtained from all subjects, and all data were collected
under certification from the Johns Hopkins University
Institutional Review Board.
EEG Data Acquisition
EEG was acquired using a Neuroscan SynAmps
2
64-chan-
nel amplifier from Compumedics (El Paso, TX). A Quick-
Cap 64-channel EEG cap (modified 10–20 system) from
Neuroscan was used for data acquisition; referenced
between Cz and CPz, and grounded anteriorly to Fz.
The SynAmps
2
amplifier and signal processing modules
were connected through client-server architecture, with
the amplifier acting as the server and the signal processing
module running on a stand-alone client PC. Data were
sampled at 250 Hz and transmitted over a TCP/IP proto-
col to the client PC for storage and real-time signal
processing using a custom BCI platform.
Mu-Band Extraction with Hierarchical Classifiers
The control signal output by the BCI was based on extract-
ing peak Mu-band power, which is well known to be mod-
ulated by motor imagery [21-23]. In general, the EEG
activity for right hand and left hand motor imagery were
focused at electrodes C3 and C4, respectively, which over-
lay the M1 hand area [24]. A large Laplacian spatial filter
was applied by re-referencing each electrode to the mean
of its next-nearest neighboring electrodes [25].
The spatially filtered EEG activity from each electrode was
modeled as an autoregressive (AR) process over a sliding
temporal window of duration T
W
s shifting every T
S
s,
yn a yn k n
k
k
K
[] [ ] []=−+
=
∑
0
ε
(1)
Visual InterfaceFigure 2
Visual Interface. Visual interface displaying horizontal bar
that is proportional to level of vibrotactile feedback. A)
shows bar when Low cue is reached (Level 1) successfully, B)
shows bar at beginning of each trial (Level 4), and C) shows
bar when High cue is reached (Level 7).
Experimental SetupFigure 1
Experimental Setup. Experimental setup showing a
closed-loop BCI system. A) 64-channel EEG data are
acquired and used to control a BCI which returns state infor-
mation to the user through vibrotactile feedback. B) Vibro-
tactile stimulation location is varied between limbs ipsilateral
and contralateral to motor imagery (contralateral placement
shown above). The scalp plot shows a representative inde-
pendent component corresponding to right hand motor
imagery.
Journal of NeuroEngineering and Rehabilitation 2007, 4:40 />Page 4 of 12
(page number not for citation purposes)
where a
k
were the autoregressive coefficients, K was the
model order, and
ε
[n] was an independent identically dis-
tributed stochastic sequence with zero mean and variance
σ
2
[26]. T
W
and T
S
were typically chosen to be 2 s and 250
ms, respectively, with a model order K of 12–15. Model
orders above this range have been shown to yield minimal
improvements in regression accuracy of the sensorimotor
rhythm [27]. Burg's method [28] was used to estimate the
time-varying AR coefficients.
The power spectral density (in dB) of the AR process for
each electrode was then computed as,
P(
ω
) = 10 log(h(
ω
)) (2)
and the peak mu-band power was extracted at discrete
times t
k
,
P
C3
(t
k
) = max(P
C3
(
ω
µ
)) (3)
P
C4
(t
k
) = max(P
C4
(
ω
µ
)) (4)
where
ω
µ
is the frequency range of the mu-band (8–12
Hz).
A novel two-stage hierarchical linear classification scheme
was used to generate the final output control signal. A gat-
ing classifier G was designed to distinguish between
motor imagery ERD and relaxation,
where w1
G
, w2
G
, B
G
, and T
G
were the weights, bias, and
threshold, respectively, determined online for each sub-
ject. A second movement classifier M was designed to dis-
tinguish between right hand and left hand motor imagery
tasks,
where w1
M
, w2
M
, B
M
, and T
M
are the weights, bias, and
threshold, respectively, determined online for each sub-
ject. The final output F(t
k
) was the product of the two clas-
sifiers,
F(t
k
) = G(t
k
) × M(t
k
)(7)
where +1 corresponds to right-hand movement, -1 to left-
hand movement, and 0 to relaxation. A classifier decision
was made every 250 ms.
This 3-type classification is highly appropriate for pros-
thetic applications, where a user controlling a prosthetic
device will require an easily-maintained "rest" state. This
is achieved with a gating classifier. Only when the subject
is actively trying to produce a movement (e.g. open or
close a prosthetic hand) does the movement classifier dis-
tinguish the movement type.
Vibrotactile Feedback System
Vibratory feedback was provided by a C2 voice coil tactor
from Engineering Acoustics, Inc. (Winter Park, FL), which
was placed on the biceps with an elastic cuff. Feedback at
this location has been used in previous studies testing
haptic feedback with prosthetic technology [18-20]. Fur-
thermore, psychophysical responses to stimulation in this
location have been well-characterized [29].
The vibratory stimulus waveform was a series of discrete
pulses with a fixed duty cycle of 50%. The waveform was
modulated by varying the width of the pulses to change
the pulse rate. Shorter, more rapid pulses were perceived
as an increase in stimulus intensity, and longer, less rapid
pulses were perceived as a decrease in stimulus intensity.
The vibration carrier frequency for each pulse was 200 Hz
in order to maximally stimulate high-frequency Pacinian
mechanoreceptors [30].
The range of vibration waveforms comprised of 7 discrete
pulse rates. A BCI classifier output of +1 generated by right
hand motor imagery increased the pulse rate, while a clas-
sifier output of -1 generated by left hand motor imagery
decreased the pulse rate. A classifier output of 0, implying
relaxation, kept the pulse rate constant. All cues and suc-
cess/failure indicators were presented to the subject audi-
bly through headphones. In addition, to ensure that the
subject was responding to purely the tactile sensation, the
headphones played white noise throughout the trial that
masked any audible vibrations from the tactor.
Subject Training
Each subject underwent a training period at the beginning
of the study in order to determine the thresholds for the
gating classifier and movement classifier. During this time
the subject practiced right and left hand motor imagery
tasks to modulate his Mu rhythm while the classifier
parameters were optimized. For each classifier, the thresh-
olds were set halfway between the average mu rhythm
powers for the two separable states. These values were set
manually for each subject using a utility that allowed the
where h
ae a e
i
K
iK
()
ω
σ
ωω
=
+++
−−
2
1
2
1
Gt
if w P t w P t B T
else
k
GC k GC k G G
()
() ()
=
++<
11 2
0
34
(5)
Mt
if w P t w P t B T
else
k
MC k MC k M M
()
() ()
=
+++<
−
11 2
1
34
(6)
Journal of NeuroEngineering and Rehabilitation 2007, 4:40 />Page 5 of 12
(page number not for citation purposes)
operator to visualize and adjust the parameters online.
Once the optimal weights and biases were selected during
this training period, they remained constant for the dura-
tion of the study for that subject. Total training time var-
ied due to subject to subject learning variations (ranging
from 10 min. for experienced Subject D to 30 min. for
novice Subject A). After the final optimization, the subject
was allowed to rest for 5 min prior to the start of the study.
Study Design: BCI Control of Vibrotactile Stimulus
The task was designed to test the subject's ability to oper-
ate a BCI to control the strength of a vibrotactile stimulus.
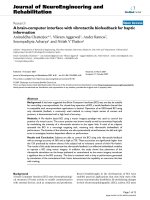
As shown in the timing diagram in Fig. 3, each experimen-
tal trial began with a variable 3–8 s rest period, at the end
of which the subject was presented with an auditory Ready
cue. Following the Ready period of 1 s, either a Low or High
cue was given to the subject audibly. The cues were pro-
vided through the headphones and overlaid the white
noise. The trial ended successfully if the subject reached
the intended vibration level and maintained this position
for 1 s. The trial ended with failure in two ways: 1) failure
at timeout if the subject could not complete the task in 15
s and 2) immediate failure if the subject reached and
maintained the incorrect vibration level for 1 s.
A single recording session consisted of a training period
and a testing period. During the training period, the sub-
ject performed a variable number of training sets; each
consisting of 10 trials with five High and five Low cues pre-
sented in a pseudorandom order. These training sets were
performed with both visual feedback and a constant level
of vibrotactile stimulation on the right biceps. In this
phase of the experiment, the vibrotactile stimulation did
not convey any information, but was present to acclima-
tize the subject to the conditions of the testing period.
Subjects completed multiple training sets until they
achieved a success rate of 60% – at which point they
moved on to the testing period.
During the testing period, the subject completed six trial
sets; each consisting of 20 trials with 10 High and 10 Low
cues presented in a pseudorandom order. The first two
testing sets were performed with both visual feedback and
vibrotactile feedback so the subject could map changes in
the vibrotactile stimulation to the visual display. The posi-
tion of the tactor was varied between trial sets so that the
feedback alternated between left and right arm. The
remaining four testing sets were performed with only
vibrotactile feedback (and alternating tactor placement).
The entire recording session ran for approximately 2
hours, including 2 minute breaks between trial sets and
additional break time as needed.
Results
Performance Measures for BCI
Accuracy was defined as the percentage of trials where the
subject completed the BCI control task successfully.
Latency was defined as the time required to complete the
task successfully. Accuracy and latency results for vibrotac-
tile feedback trials are reported in Table 1 for each subject,
separated by trials where the tactor was placed ipsilateral
or contralateral to the motor imagery.
Accuracy statistics were calculated for trials where the sub-
ject received only vibrotactile feedback. The average accu-
racy results across all subjects, separated by both motor
imagery and tactor placement, are presented in Fig. 4. The
data show that on average, subject accuracy was 56%,
Trial Timing DiagramFigure 3
Trial Timing Diagram. Timing diagram for each trial. Each trial starts with a variable 3–8 s rest period, followed by an audi-
tory Ready cue. After 1 s, an auditory High or Low cue is given. The maximum length of each trial is 15 s.
Journal of NeuroEngineering and Rehabilitation 2007, 4:40 />Page 6 of 12
(page number not for citation purposes)
which was significantly larger than the probability of ran-
domly achieving success, as outlined below.
Due to the use of a three-state classifier, and the fact that
the subject must maintain the Low or High vibration level
for 1 s, the probability of randomly succeeding was 15%.
Since a classifier decision was made every 250 ms and the
timeout period for each trial was 15 s, there was a maxi-
mum of 60 classification outputs per trial. The user began
each trial from a mid-vibration level, and seven consecu-
tive outputs of +1(-1) were needed to reach the maxi-
mum(minimum) vibration level. To successfully
complete the trial, the user then had to maintain the cor-
rect vibration level for an additional 1 s, or four classifica-
tion outputs. Therefore, the fastest a user could complete
a trial was 2.75 s. Assuming a 1:1 classification distribu-
tion between 0/+1 for the gating classifier, and a 1:1 clas-
sification distribution between +1/-1 for the movement
classifier, a random walk over 10,000 simulated trials
yielded an average success rate of 15%.
Fig. 4 also suggests that the accuracy for particular cues
varied with tactor placement. Tests for significant differ-
ence in medians between left arm and right arm accuracies
Accuracy ComparisonFigure 4
Accuracy Comparison. Means and standard errors of accuracies across all subjects, separated by motor imagery and tactor
location. The dotted line indicates the success rate expected through random chance (15%). For Low cues (which required left
hand motor imagery), mean accuracy was statistically significantly higher with vibratory stimulus on the left arm (p = 0.031).
For High cues (which required right hand motor imagery), mean accuracy was higher with the stimulus on the right arm.
Table 1: BCI Performance Results. Accuracy and latency results are reported for each subject, separated by trials where tactor was
placed ipsilateral or contralateral to the motor imagery. Accuracies for trials with ipsilateral placement are generally higher than
accuracies for trials with contralateral placement.
ACCURACIES LATENCIES
SUBJECT ID Ipsilateral Contralateral Ipsilateral (s) Contralateral (s)
A 65% 70% 8.58 7.62
B 48% 30% 8.93 9.86
C 53% 27% 8.15 8.14
D 64% 57% 7.68 7.40
E 86% 58% 8.46 7.57
F 70% 50% 6.80 8.89
Journal of NeuroEngineering and Rehabilitation 2007, 4:40 />Page 7 of 12
(page number not for citation purposes)
were performed using the Wilcoxon Sign Rank test. Dur-
ing trials with a Low cue (which required left hand motor
imagery), average performance was significantly better
with the tactor on the left biceps (p = 0.031). During trials
with a High cue (which required right hand motor
imagery), the average performance was better with the tac-
tor on the right biceps, although the increase was not sta-
tistically significant (p = 0.150). The general trend appears
to be that the vibrotactile stimulus biases results in favor
of the outcome requiring motor imagery of the hand ipsi-
lateral to the tactor location.
Latency statistics were also computed for the trials where
the subject received only vibrotactile feedback. The aver-
age latency results across all subjects, separated by both
motor imagery and tactor placement, are presented in Fig.
5. A comparison of medians using the Mann-Whitney U
test shows that during trials with a Low cue (which
required left hand motor imagery), average latencies were
significantly longer by 1.04 s with the tactor on the left
biceps (p = 0.046). Similarly, during trials with a High cue
(which required right hand motor imagery), average
latencies were significantly longer by 0.92 s with again the
tactor on the left biceps (p = 0.033).
Trajectory plots were generated to visualize the subjects'
control throughout the duration of the trial. A mean tra-
jectory plot for all trials with the tactor placed on the left
arm is shown in Fig. 6a, and with the tactor placed on the
right arm in Fig. 6b. Since the trajectory duration for each
trial varied with subject performance, the thickness of the
mean trajectory is drawn proportional to the number of
trials that reached that length of time (this value drops
with time due to early successes and failures). The mean
trajectory is shown in blue for trials with a High cue
(which required right hand motor imagery) and in red for
trials with a Low cue (which required left hand motor
imagery). Trials with the tactor on the left arm (Fig. 6a)
showed faster divergence and a clearer separation between
Low and High mean trajectories.
EEG Data Analysis
In addition to performance statistics, the peak Mu-band
powers from electrodes C3 (P
C3
) and C4 (P
C4
) were
Latency ComparisonFigure 5
Latency Comparison. Means and standard errors for average latencies across all subjects, separated by motor imagery and
tactor location. The lower dotted line indicates the fastest possible trial time (2.75 s) while the upper dotted line indicates the
trial timeout value (15 s). For Low cues (which required left hand motor imagery), mean latency was statistically significantly
longer by 1.04 s with vibratory stimulus on the left arm (p = 0.046). For High cues (which required right hand motor imagery),
mean latency was again statistically significantly longer by 0.92 s with vibratory stimulus on the left arm (p = 0.033).
Journal of NeuroEngineering and Rehabilitation 2007, 4:40 />Page 8 of 12
(page number not for citation purposes)
recorded for all subjects and analyzed using EEGLAB v.
5.02 (Schwartz Center for Comp. Neurosci., UCSD, CA)
[31]. Since the movement classifier accepts the weighted
difference of these values (see Eq. 6), a plot of (P
C3
-P
C4
)
characterizes the subjects' Mu-band activity and allows for
the separation of left and right hand motor imagery pat-
terns. These plots were averaged across all trials and sub-
jects. The cumulative plot with standard error bars is
shown in Fig. 7. The results for right hand motor imagery
trials (High cues) are shown in Fig. 7a and the results for
left hand motor imagery trials (Low cues) are shown in
Fig. 7b.
Fig. 7 shows that tactor placement tended to disturb the
control signal early on in the trial, but that this influence
was reduced as the trial progressed. Contralateral place-
ment showed greater deviation from ipsilateral placement
in left arm tactor trials, indicating a greater separation in
performance in left arm trials, which is consistent with the
trajectory analysis. In general, the contralateral and ipsi-
lateral traces merged as the trial progressed, indicating
that the tactor bias effects weakened as the trial progressed
and the user compensated for the vibrotactile stimulation.
Discussion
BCI Feedback Represents Haptic Information
To successfully complete our task, the subject was
required to drive a parameter from an initial medium state
to either a low or a high state and maintain it for 1 s. The
low and high states represented discrete regions of a 2-D
space with a third neutral state between them. The ration-
ale for selecting this type of task is based on the applica-
tion of a BCI to the context of upper-limb prosthetics. The
primary motivation for pursuing vibrotactile biofeedback
is to develop a method whereby haptic information can
be provided to the user in an appropriate manner. One
can imagine a BCI user controlling an advanced neuro-
prosthesis to grasp an object. Just as robotic mechanisms
in teleoperation systems transmit forces from the end-
effector to the operator, this advanced prosthesis is instru-
mented with force sensors so that force information can
be transmitted to the user. A compact and safe vibrotactile
feedback system is used to convey this force information
and as a result, the BCI operator's ability to interpret and
modulate his grasping force is improved.
Trajectory ComparisonFigure 6
Trajectory Comparison. Mean trajectory plot for all subjects with A) tactor placed on left arm, and B) tactor placed on
right arm. The mean trajectory of High trials (which required right hand motor imagery) is shown in blue while the mean tra-
jectory of Low trials (which required left hand motor imagery) is shown in red. The thickness of the line is proportional to the
number of trials. Faster divergence and clearer separation is evident between Low and High trajectories when tactor is on the
left arm.
Journal of NeuroEngineering and Rehabilitation 2007, 4:40 />Page 9 of 12
(page number not for citation purposes)
With this application in mind, the appropriate BCI task is
not the selection of a particular state as in a hierarchical
selection tree, but rather the direct control of a certain
parameter whose state is conveyed through biofeedback.
If the vibrotactile intensity is thought to represent grip
force strength, then the task of driving the intensity high
(through right hand motor imagery) may be thought of as
squeezing a grasped object while driving the intensity low
(through left hand motor imagery) would represent
releasing the object. Furthermore, maintaining a constant
intensity level (through relaxation) would be equivalent
to maintaining a steady hold on the object. The develop-
ment of a three-state, self-paced BCI based on simple
motor movement was motivated by this intended neuro-
prosthesis control paradigm and proved sufficient to test
the efficacy of a vibrotactile feedback system. It should be
noted that more complex BCIs that operate using different
control paradigms may interact with haptic stimuli differ-
ently.
Establishing BCI Performance Capability
Accuracy and latency statistics are the preferred methods
in literature for quantifying the performance of a BCI [32-
34]. However, due to the nature of our defined task, per-
formance figures from this study should not be compared
to results from BCIs designed for different purposes.
Unlike a typical two-state selection paradigm, the random
chance of success is not 50%, but actually much lower due
to the difficulty of the task as described in the previous
section. The effectiveness of this control scheme is estab-
lished by demonstrating that accuracies across all cues and
tactor locations were significantly higher than the 15%
random chance of success.
The accuracies from the vibrotactile feedback trials dem-
onstrate that vibrotactile stimulation is an effective means
to provide feedback information in 1-D. Considering the
fact that four of the six subjects had no prior BCI experi-
ence, additional training sessions would likely improve
performance further, as expected with any BCI paradigm.
The learning process for this feedback modality was facil-
itated by the study protocol, which was designed to intro-
duce the vibrotactile biofeedback by associating it with a
commonly used visual feedback system. The sequential
process of training the subject with visual feedback, map-
ping the visual feedback to the vibrotactile feedback, and
Mu Band PowerFigure 7
Mu Band Power. Plot of the difference in peak Mu-band power between electrodes C3 and C4, averaged across all subjects
and trials and separated by tactor location. A) shows data from right hand motor imagery trials (High cues), and B) shows data
from left hand motor imagery trials (Low cues). The direction for the desired motor imagery task is indicated with arrows.
Horizontal bars show where tactor placement produced noticeable deviations in the control signal early on.
Journal of NeuroEngineering and Rehabilitation 2007, 4:40 />Page 10 of 12
(page number not for citation purposes)
then finally testing with vibrotactile feedback, allowed the
subject to mentally associate the different stimulus
modalities. This type of paired stimulus presentation has
been used successfully in prior studies of haptic feedback
training [35,36] and studies of associative learning [37].
Tactor Placement Bias
The accuracy data also indicated that a significant bias was
introduced with regards to the tactor placement location.
Left arm tactor placement led to better performance for
Low cues and right arm tactor placement led to better per-
formance for High cues. Since Low and High were mapped
to left and right hand imagery respectively, it appears that
the tactor bias is consistent with either an enhancement of
Mu rhythm desynchronization from ipsilateral hand
imagery or an inhibition of Mu rhythm desynchroniza-
tion from contralateral hand imagery. These results are
summarized in Fig. 8.
The offline analysis of EEG data suggests that the latter
case is true. The plots of the difference in peak Mu-band
power from between C3 and C4 show that, on average,
contralateral vibrotactile stimulation produces deviations
in the signal in the first second of the trial. The contralat-
eral and ipsilateral average traces eventually converge,
indicating that subjects were able to overcome the vibra-
tory influence to an extent. If so, the tactor bias is under
some level of voluntary control and may be mitigated
with greater concentration and training time. This hypoth-
esis is supported by impressions from subjects who noted
that vibrotactile feedback tended to draw attention to the
stimulated hand. Although this inadvertent attention
might lead to changes similar to those associated with
motor imagery, most subjects reported that they were able
to consciously re-focus on the required motor imagery
task while maintaining their awareness of the information
from the vibrotactile feedback.
The mean trajectory plots suggest that average subject per-
formance is different for tactor placement on the left arm
versus the right arm, as evidenced by a higher rate of diver-
gence and earlier point of separation between Low and
High trials for mean left arm trajectories. This could be
due to a combination of a) faster successes during Low tri-
als leading to the early divergence, and b) faster failures
during High trials which keep the average trajectories sep-
arate at later stages of the trial. These results are supported
by the accuracy data, which show that on average, ipsilat-
eral left arm Low trials were the most accurate (70%) while
contralateral left arm High trials were the least accurate
(44%).
While a significant disparity exists between ipsilateral and
contralateral motor imagery accuracies with the tactor on
the left arm, the disparity is muted with the tactor on the
right arm (58% for ipsilateral vs. 53% for contralateral).
Furthermore, the average latency of trials with the tactor
on the left arm was 0.98 s longer than trials with the tactor
on the right arm with a high statistical significance. It is
possible that the training protocol of acclimating our sub-
jects with right arm tactor stimulation may have led them
to better adapt to motor imagery tasks with the feedback
at this location. It should also be noted that the tactor bias
results are averaged from only two experienced subjects
and four novice subjects. It remains to be seen whether
sufficient training with the vibrotactile stimulus at alter-
nate locations can reduce the difference in performance
between ipsilateral and contralateral motor imagery tasks.
The bias effect may be mitigated through training as well
as modifications to the BCI signal processing. Adjusting
the thresholds and weights for the linear classifier appro-
priately, possibly by introducing an adaptive algorithm,
could compensate for the stimulation and reduce this
bias. Adaptive algorithms have been utilized in some of
the latest BCIs to improve robustness against changes in
brain dynamics brought about by fatigue and other factors
[3,38]. These methods adjust the weights and biases of the
classifiers on a trial-by-trial basis by using optimization
algorithms such as Least-Mean-Squares method [23]. Fur-
ther work will be needed to determine if similar methods
can adapt to the vibrotactile stimulation during real-time
BCI classification.
Conclusion
A tactile information channel will be a critical component
of any BCI designed to control an advanced neuropros-
Summary Accuracy ComparisonFigure 8
Summary Accuracy Comparison. This representative
diagram shows summary accuracy values, separated by
motor imagery type and tactor location. The location of the
arm shows the motor imagery type (either right hand or left
hand) and the location of the hexagon indicates the location
of the tactor (right arm or left arm). Success at a motor
imagery task was higher when the tactor was placed on the
ipsilateral arm. Scalp plots show representative independent
components corresponding to the respective motor imagery
task.
Journal of NeuroEngineering and Rehabilitation 2007, 4:40 />Page 11 of 12
(page number not for citation purposes)
thetic device. To test the efficacy of this approach, a motor
imagery BCI was enhanced with a vibrotactile feedback
channel to convey 1-D information. A hierarchical classi-
fication scheme was used to generate output appropriate
for prosthesis grasping tasks. Subjects were initially
trained to perform BCI control tasks with a visual feed-
back system and were then migrated to the vibrotactile
feedback system. The performance results show that all
subjects were able to operate a three-state motor imagery
BCI using only vibrotactile biofeedback, but that varia-
tions in tactor placement led to a notable bias in accuracy.
The EEG data indicate that the choice of vibrotactile stim-
ulus location biased the user's modulation of Mu-rhythm
activity towards desynchronization generated by imagery
of the ipsilateral hand. Analysis of latency and trajectory
data indicate that preferences for stimulation location
may be affected by the training protocol. Further work will
be needed to determine exactly how the neural correlates
of vibrotactile feedback affect the modulation of Mu-
rhythm activity and to determine optimal signal process-
ing techniques to account for the feedback. In conclusion,
the successful incorporation of training procedures and
mechanisms to compensate for vibrotactile feedback bias
in BCI platforms will aid the development of haptic bio-
feedback systems for neuroprosthetic and other applica-
tions.
Authors' contributions
AC participated in study design, running the experiments,
data analysis, and drafted the manuscript. VA participated
in running the experiments, data analysis, and drafted the
manuscript. AR participated in running the experiments
and data analysis. SA participated in study design and run-
ning the experiments. NVT participated in study design
and supervised the research. All authors read and
approved of the final manuscript.
Acknowledgements
The authors thank Dongwon Lee, Yoonju Cho, Brandon O'Rourke, and
Rob Rasmussen for their contributions towards development of the BCI
platform used for this experiment. This study was supported by the
Defense Advanced Research Projects Agency, under the Revolutionizing
Prosthetics 2009 Program.
References
1. Trejo LJ, Rosipal R, Matthews B: Brain-computer interfaces for 1-
D and 2-D cursor control: designs using volitional control of
the EEG spectrum or steady-state visual evoked potentials.
IEEE Trans Neural Syst Rehabil Eng 2006, 14:225-229.
2. Vaughan TM, McFarland DJ, Schalk G, Sarnacki WA, Krusienski DJ,
Sellers EW, Wolpaw JR: The Wadsworth BCI Research and
Development Program: at home with BCI. IEEE Trans Neural
Syst Rehabil Eng 2006, 14:229-233.
3. Vaughan TM, Wolpaw JR: The Third International Meeting on
Brain-Computer Interface Technology: making a difference.
IEEE Trans Neural Syst Rehabil Eng 2006, 14:126-127.
4. Birbaumer N, Kubler A, Ghanayim N, Hinterberger T, Perelmouter J,
Kaiser J, Iversen I, Kotchoubey B, Neumann N, Flor H: The thought
translation device (TTD) for completely paralyzed patients.
IEEE Trans Rehabil Eng 2000, 8:190-193.
5. Blankertz B, Dornhege G, Krauledat M, Muller KR, Kunzmann V,
Losch F, Curio G: The Berlin Brain-Computer Interface: EEG-
based communication without subject training. IEEE Trans
Neural Syst Rehabil Eng 2006, 14:147-152.
6. Atkins DJ, Heard DCY, Donovan WH: Epidemiologic Overview
of Individuals with Upper-Limb Loss and Their Reported
Research Priorities. J Prosth Orth 1996, 8:2-11.
7. Nelson VS, Flood KM, Bryant PR, Huang ME, Pasquina PF, Roberts TL:
Limb deficiency and prosthetic management. 1. Decision
making in prosthetic prescription and management. Arch
Phys Med Rehabil 2006, 87:S3-9.
8. Roeschlein RA, Domholdt E: Factors related to successful upper
extremity prosthetic use. Prosthet Orthot Int 1989, 13:14-18.
9. Abbott A: Neuroprosthetics: in search of the sixth sense.
Nature 2006, 442:125-127.
10. Schwartz AB, Cui XT, Weber DJ, Moran DW: Brain-controlled
interfaces: movement restoration with neural prosthetics.
Neuron 2006, 52:205-220.
11. Taylor DM, Tillery SI, Schwartz AB: Direct cortical control of 3D
neuroprosthetic devices. Science 2002, 296:1829-1832.
12. Hochberg LR, Serruya MD, Friehs GM, Mukand JA, Saleh M, Caplan
AH, Branner A, Chen D, Penn RD, Donoghue JP: Neuronal ensem-
ble control of prosthetic devices by a human with tetraple-
gia. Nature 2006, 442:164-171.
13. Carmena JM, Lebedev MA, Crist RE, O'Doherty JE, Santucci DM,
Dimitrov DF, Patil PG, Henriquez CS, Nicolelis MA: Learning to
control a brain-machine interface for reaching and grasping
by primates. PLoS Biol 2003, 1:E42.
14. Kaczmarek KA, Webster JG, Bach-y-Rita P, Tompkins WJ: Electro-
tactile and vibrotactile displays for sensory substitution sys-
tems. IEEE Trans Biomed Eng 1991, 38:1-16.
15. Benali KM, Hafez M, Alexandre JM, Kheddar A: Tactile Interfaces:
A State of the Art Survey: 24-26 March 2004; Paris, France.
; 2004.
16. Shannon GF: Sensory feedback for artificial limbs. Med Prog
Technol 1979, 6:73-79.
17. Shannon GF: A comparison of alternative means of providing
sensory feedback on upper limb prostheses. Med Biol Eng 1976,
14:289-294.
18. Meek SG, Jacobsen SC, Goulding PP: Extended physiologic tac-
tion: design and evaluation of a proportional force feedback
system. J Rehabil Res Dev 1989, 26:53-62.
19. Patterson PE, Katz JA: Design and evaluation of a sensory feed-
back system that provides grasping pressure in a myoelec-
tric hand. J Rehabil Res Dev 1992, 29:1-8.
20. Pylatiuk C, Kargov A, Schulz S: Design and evaluation of a low-
cost force feedback system for myoelectric prosthetic hands.
Journal of Prosthetics and Orthotics 2006, 18:57-61.
21. Wolpaw JR, McFarland DJ: Multichannel EEG-based brain-com-
puter communication. Electroencephalogr Clin Neurophysiol 1994,
90:444-449.
22. Pineda JA, Silverman DS, Vankov A, Hestenes J: Learning to control
brain rhythms: making a brain-computer interface possible.
IEEE Trans Neural Syst Rehabil Eng 2003, 11:181-184.
23. Wolpaw JR, McFarland DJ: Control of a two-dimensional move-
ment signal by a noninvasive brain-computer interface in
humans. Proc Natl Acad Sci U S A 2004, 101:17849-17854.
24. Guger C, Ramoser H, Pfurtscheller G: Real-time EEG analysis
with subject-specific spatial patterns for a brain-computer
interface (BCI). IEEE Trans Rehabil Eng 2000, 8:447-456.
25. Ramoser H, Muller-Gerking J, Pfurtscheller G: Optimal spatial fil-
tering of single trial EEG during imagined hand movement.
IEEE Trans Rehabil Eng 2000, 8:441-446.
26. Bos R, deWaele S, Broersen PMT: Autoregressive spectral esti-
mation by application of the Burg algorithm to irregularly
sampled data. IEEE Trans Instrum Meas 2002, 51:1289.
27. Krusienski DJ, McFarland DJ, Wolpaw JR: An evaluation of autore-
gressive spectral estimation model order for brain-compu-
ter interface applications: Aug 30 - Sept 3; New York City,
USA. ; 2006:1323-1326.
28. Burg JP: Proc. 37th Meeting Soc. Exploration Geophys. 1967.
29. Cholewiak RW, Collins AA: Vibrotactile localization on the
arm: effects of place, space, and age. Percept Psychophys 2003,
65:1058-1077.
30. Mountcastle VB, LaMotte RH, Carli G: Detection thresholds for
stimuli in humans and monkeys: comparison with threshold
Publish with BioMed Central and every
scientist can read your work free of charge
"BioMed Central will be the most significant development for
disseminating the results of biomedical research in our lifetime."
Sir Paul Nurse, Cancer Research UK
Your research papers will be:
available free of charge to the entire biomedical community
peer reviewed and published immediately upon acceptance
cited in PubMed and archived on PubMed Central
yours — you keep the copyright
Submit your manuscript here:
/>BioMedcentral
Journal of NeuroEngineering and Rehabilitation 2007, 4:40 />Page 12 of 12
(page number not for citation purposes)
events in mechanoreceptive afferent nerve fibers innervat-
ing the monkey hand. J Neurophysiol 1972, 35:122-136.
31. Delorme A, Makeig S: EEGLAB: an open source toolbox for
analysis of single-trial EEG dynamics. Journal of Neuroscience
Methods 2004, 134:9-21.
32. McFarland DJ, Sarnacki WA, Wolpaw JR: Brain-computer inter-
face (BCI) operation: optimizing information transfer rates.
Biol Psychol 2003, 63:237-251.
33. Sellers EW, Krusienski DJ, McFarland DJ, Vaughan TM, Wolpaw JR: A
P300 event-related potential brain-computer interface
(BCI): the effects of matrix size and inter stimulus interval
on performance. Biol Psychol 2006, 73:242-252.
34. Kronegg J, Voloshynovskiy S, Pun T: Analysis of bit-rate defini-
tions for Brain-Computer Interfaces: June 20-23; Las Vegas,
Nevada. ; 2005.
35. Feygin D, Keehner M, Tendick R: Haptic guidance: experimental
evaluation of a haptic training method for a perceptual
motor skill: 3/24/2002 - 3/25/2002; Orlando, FL, USA. ;
2002:40-47.
36. Ernst M, Banks M: Does vision always dominate haptics: ; Uni-
versity of Southern California. ; 2001.
37. Molchan SE, Sunderland T, McIntosh AR, Herscovitch P, Schreurs BG:
A functional anatomical study of associative learning in
humans. Proc Natl Acad Sci U S A 1994, 91:8122-8126.
38. Sykacek P, Roberts S, Stokes M, Curran E, Gibbs M, Pickup L: Prob-
abilistic methods in BCI research. IEEE Trans Neural Syst Rehabil
Eng 2003, 11:192-195.