Optoelectronics Materials and Techniques Part 13 docx
Bạn đang xem bản rút gọn của tài liệu. Xem và tải ngay bản đầy đủ của tài liệu tại đây (994.31 KB, 30 trang )
An Analytical Solution for Inhomogeneous Strain Fields
Within Wurtzite GaN Cylinders Under Compression Test
349
to constant strain without end friction and 1
α
= . Fig. 4 shows the normalized axial strain
0
/
zz
zz
εε
versus the normalized vertical distance z/h for various values of
α
for r/R=0.0
and
r/R=0.5, and
0
zz
ε
is the axial strain of the cylinder under compression without end
friction and can be calculated according to (7). Fig.4 shows that the axial strain is also
inhomogeneous, and the maximum values can be more than 40% and 30% for
r/R=0.0 and
r/R=0.5 respectively, comparing to that without end friction. Fig. 5 shows the normalized
strain
0
/
H
H
εε
versus the normalized vertical distance z/h for various values of
α
for
r/R=0.0 and r/R=0.5, and
0
H
ε
is the strain of the cylinder under compression without end
friction and can be calculated according to (58). Fig.5 shows that the normalized strain
0
/
H
H
εε
is quite inhomogeneous, and the maximum values can be 100% and 53% more
than those without end friction for
r/R=0.0 and r/R=0.5 respectively. Overall, the
inhomogeneous strain distributions are induced in the cylinder as long as friction exists
between the end surface and the loading platens, and the larger the friction on the end
surfaces, that is, the smaller the value of
β
, the more non-uniform inhomogeneous strain
is induced within the cylinder.
9.2 The strain distributions within cylinder for different shape of cylinder
All of the numerical calculations given above are for / 2.0hR= . In order to investigate the
shape effect on the strain distribution within cylinder under compression with end friction,
Figs. 6-8 plot the normalized strains
0
/
rr
rr
εε
,
0
/
θθ
θθ
εε
and
0
/
zz
zz
εε
versus the normalized
vertical distance
z/h from the center of the cylinder for various values of h/R for r/R=0.0 and
0.0
β
= . Figs. 6-8 show that a larger deviation may be induced for shorter cylinder. For
example, 35% error in
0
/
H
H
εε
can be induced even at the center of the cylinder for h/R=0.5.
But the strain distributions for long cylinders are more homogeneous, especially the strains
are relatively uniform at the central part of the cylinder if / 2
hR≥ . So a relatively long
cylinder should be suggested for compression test.
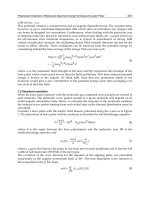
Fig. 6. The normalized strain
0
/
rr
rr
εε
versus the normalized distance z/h along the axis of
loading for various ratios of
h/R
Optoelectronics - Materials and Techniques
350
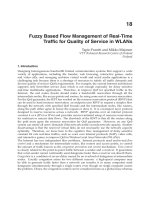
Fig. 7. The normalized strain
0
/
θθ
θθ
εε
versus the normalized distance z/h along the axis of
loading for various ratios of
h/R
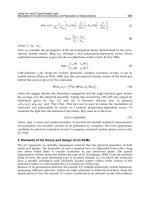
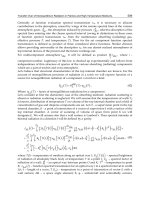
Fig. 8. The normalized strain
0
/
zz
zz
εε
versus the normalized distance z/h along the axis of
loading for various ratios of
h/R
10. The effect of strain on the valence-band structure of wurtzite GaN
The band structure of wurtzite GaN deserves attention since the valence bands, such as the
heavy-hole, light-hole and split-off bands are close each other. The strain effects on wurtzite
GaN are less understand (Chuang & Chang, 1996). Based on the deformation potential
theory of Luttinger-Kohn and Bir-Pikus (Bir & Pickus, 1974), the valence-band structure of
the strained wurtzite GaN can be described by a 6x6Hamiltonian according to the envelope-
function method, and the basis function for wurtzite GaN can be written as
An Analytical Solution for Inhomogeneous Strain Fields
Within Wurtzite GaN Cylinders Under Compression Test
351
*
*
*
*
*
*
1()()
22
2()()
22
3
4()()
22
5() ()
22
6
XiY XiY
XiY XiY
ZZ
XiY XiY
XiY XiY
ZZ
αα
ββ
ββ
αα
ββ
ββ
=− + ↑ + − ↓
=− − ↑ − + ↓
=↑+↓
=− + ↑ − − ↓
=−↑++↓
=− ↑ + ↓
(59)
where
(3 /4 3 /2) ( /4 /2)
(1/ 2) , (1/ 2 )
ii
ee
πφ πφ
αβ
++
==and
1
tan ( / )
y
x
kk
φ
−
=
.
The 6x6 Hamiltonian is obtained as
33
33
() 0
()
0()
U
L
Hk
Hk
Hk
×
×
⎡
⎤
⎢
⎥
=
⎢
⎥
⎣
⎦
(60)
and
33
tt t
U
tt t
ttt
FK iH
HKG iH
iH iH
λ
×
−
⎡
⎤
⎢
⎥
=Δ−
⎢
⎥
⎢
⎥
Δ+
⎣
⎦
(61)
33
tt t
L
tt t
ttt
FK iH
HKG iH
iH iH
λ
×
⎡
⎤
⎢
⎥
=Δ+
⎢
⎥
⎢
⎥
−Δ−
⎣
⎦
(62)
12ttt
F
λθ
=Δ +Δ + +
(63)
12ttt
G
λθ
=Δ −Δ + +
(64)
2
222
12 12
0
[()] ()
2
ttztx
y
zz xx
yy
Ak A k k D D
m
λεεε
=+++++
=
(65)
2
222
34 34
0
[()] ()
2
ttztx
y
zz xx
yy
Ak A k k D D
m
θεεε
=+++++
=
(66)
2
22
5
0
()
2
ttx
y
KAkk
m
=+
=
(67)
Optoelectronics - Materials and Techniques
352
2
221/2
6
0
()
2
ttx
y
z
HAkkk
m
=+
=
(68)
3
2Δ= Δ (69)
where
3421
2
tttt
AAAA=− = − (70)
35 6
42
tt t
AA A+= (71)
32
Δ=Δ (72)
The valence-band structure can be determined by
det[ ( ) ] 0Hk EI−= (73)
which leads to
32 2
210
()0
ttt
ECECEC+++=
(74)
where
2
()
tttt
CFG
λ
=− + + (75)
22 2
1
2
ttttttt t t
CFGG F K H
λλ
=++−Δ−− (76)
033
det[ ]
U
CH
×
=−
(77)
so we obtained
HH t
EF= (78)
2
2
()
22
tt tt
LH
GG
E
λλ
+−
=+ +Δ (79)
2
2
()
22
tt tt
SO
GG
E
λλ
+−
=− +Δ (80)
where
HH
E ,
LH
E and
so
E are the energies for the heavy-hole the light-hole and split-off
bands, respectively.
11. Conclusions
The exact analytical solution for the inhomogeneous strain field within a finite and
transversely isotropic cylinder under compression test with end friction is derived. The
method employed Lekhnitskii's stress function in order to uncouple the equations of
An Analytical Solution for Inhomogeneous Strain Fields
Within Wurtzite GaN Cylinders Under Compression Test
353
equilibrium. It was found that the end friction leads to a very inhomogeneous strain
distribution within cylinder, especially in the area near the end surface. Numerical results
show that all of the strain components, including the axial, radial, circumferential and shear
strains, are inhomogeneous, both in distribution pattern and magnitude, the maximum
value of the strain concentration near the end surfaces can be 100% higher than the constant
strain in the case without end friction. However, the strain distributions are relatively
uniform at the central parts of long cylinders, say in the area of 0.5 0.5hz h−<< , the
magnitude of the strains can be more than 2% of that without end friction. The method for
analyzing the effect of the strain and end friction on the band structure of wurtzite GaN is
discussed, end friction has effect on the shape of constant energy surfaces of valence bands
and the band gaps between the heavy-hole, light-hole and split-off bands of wurtzite GaN.
12. Acknowledgment
This work was supported by the National Natural Science Foundation of China (Grant No.
11032003 and 10872033) and the State Key Laboratory of Explosion Science and Technology.
13. References
Bir, G. L. & Pickus, G. E. (1974). Symmetry and Strain Induced Effects in Semiconductors, John
Wiley, New York, USA
Chau K. T. & Wei, X. X(1999). Finite solid circular cylinders subjected to arbitrary surface
load: part I. Analytic solution. International Journal of Solids and Structures, Vol. 37,
pp. 5707-5732
Choi, S. W. & Shah, S. P. (1998). Fracture mechanism in cement-based materials subjected to
compression. Journal of Engineering Mechanics ASCE, Vol. 124, pp. 94-102
Chuang, S. L. & Chang, C. S. (1996), k⋅p method for strained wurtzite semiconductors.
Physical Review B, Vol. 54, pp. 2491-2504
Goroff, I. & Kleinman, L. (1963). Deformation potentials in silicon. III. effects of a general
strain on conduction and valence levels. Physical Review, Vol. 132, pp. 1080-1084
Hasegawa, H. (1963). Theory of cyclotron resonance in strained silicon crystals. Physical
Review, Vol. 129, pp. 1029-1040
Hussein, A & Marzouk, H(2000). Finite element evaluation of the boundary conditions for
biaxial testing of high strength concrete. Material Structure, Vol. 33, pp. 299-308
Jiang, H. & Singh, J. (1997). Strain distribution and electronic spectra of InAs/GaAs self-
assembled dots: An eight-band study. Physical Review B, Vol. 56, pp. 4696-4701
Lekhnitskii, S. G(1963). Theory of elasticity of an anisotropic elastic body, English translation by
P. Fern , Holden~Day Inc., San Francisco, USA
Mathieu, H. ; Mele, P. and Ameziane, E. L., et al (1979). Deformation potentials of the direct
and indirect absorption edges of GaP. Physical Review B, Vol. 19,pp. 2209-2223
Pollak, F. H. & Cardona, M. (1968). Piezo-Electroreflectance in Ge, GaAs, and Si. Physical
Review, Vol. 172, pp 816-837
Pollak, F. H. (1990). In Strained-Layer Superlattices, edited by T. Pearsall, Semiconductors and
Semimetals, Academic, Boston, , USA
Suzuki, K. & Hensel, J. C. (1974). Quantum resonances in the valence bands of germanium. I.
Theoretical considerations. Physical Review B, Vool. 9, pp 4184-4218
Optoelectronics - Materials and Techniques
354
Singh, J. (1992). Physics of Semiconductors and Their Heterostructures, McGraw~Hill Higher
Education, New York, USA
Torrenti, J.M. ; Benaija, E. H. & Boulay, C. (1993). Influence of boundary conditions on strain
softening in concrete compression test. Journal of Engineering Mechanics ASCE, Vol.
119, pp. 2369-2384
Wei, X. X. ; Chau, K. T. & Wong, R. H. C. (1999). A new analytic solution for the axial point
load strength test for solid circular cylinders. Journal of Engineering Mechanics,
Vol. 125, pp. 1349-1357
Wei, X. X(2008). Non-uniform strain field in a wurtzite GaN cylinder under compression
and the related end friction effect on quantum behavior of valence-bands.
Mechanics of Advanced Materials and Structures, Vol. 15, pp. 612-622
Wright, A. F(1997). Elastic properties of zinc-blende and wurtzite AlN, GaN, and InN.
Journal of Applied Physics, Vol. 82, pp. 2833-2839
0
Application of Quaternary AlInGaN- Based Alloys
for Light Emission Devices
Sara C. P. Rodrigues
1
, Guilherme M. Sipahi
2
,LuísaScolfaro
3
and Eronides F. da Silva Jr.
4
1
Departamento de Física - Universidade Federal Rural de Pernambuco
2
Instituto de Física de São Carlos - Universidade de São Paulo
3
Department of Physics - Texas State University
4
Departamento de Física - Universidade Federal de Pernambuco
1,2,4
Brazil
3
USA
1. Introduction
Excellent progress has been made during the past few years in the growth of III-nitride
materials and devices. Today, one of the most important application of novel o ptoelectronic
devices is the design and engineering of light-emitting diodes (LEDs) working from
ultraviolet (UV) through infrared (IR), thus covering the whole visible spectrum. Since
the pioneer works of Nakamura et al. at Nichia Corporation in 1993 (Nakamura et al.
(1995)) when the blue LEDs and pure green LEDs were invented, an enormous progress
in this field was observed which has been reviewed by several authors (Ambacher (1998);
Nakamura et. al. (2000)). The rapid advances in the hetero-epitaxy of the group-III nitrides
(Fernández-Garrido et al. (2008); Kemper et al. (2011); Suihkonen et al. (2008)) have facilitated
the production of new devices, including blue and UV LEDs and lasers, high temperature and
high power electronics, visible-blind photodetectors and field-emitter structures (Hirayama
(2005); Hirayama et al. (2010); Tschumak et al. (2010); Xie et al. (2007); Zhu et al. (2007)).
There has been recent interest in the Al
x
In
1−x−y
Ga
y
N quaternary alloys due t o potential
application in UV LEDs and UV-blue laser diodes (LDs) once they present high brightness,
high quantum efficiency, high flexibility, long-lifetime, and low power consumption (Fu et al.
(2011); Hirayama ( 2005); Kim et al. ( 2003); Knauer et al. (2008); Liu et al. (2011); Park et al.
(2008); Zhmakin (2011); Zhu et al. (2007)). The availability of the quaternary alloy offers an
extra degree of freedom which allows the independent control of the band gap and lattice
constant. Another i nteresting feature of the AlGaInN alloy is that it gives rise to higher
emission intensities than the ternary AlGaN alloy with the absence of In (Hirayama (2005);
Wang et al. (2007)). An important issue is r elated to white light emission, which can be
obtained by mixing emissions in different wavelengths with appropriate intensities (Roberts
(1997); Rodrigues et al. (2007); Xiao et al. (2004)).
Highly conductive p-type III-nitride layers are of crucial importance, in particular, for the
production of LEDs. Although the control of p-doping in these materials is still subject of
discussion, remarkable progress has been achieved (Hirayama (2005); Zhang et al. (2011)) and
14
2 Will-be-set-by-IN-TECH
recently reported e xperimental results point towards acceptor doping concentration high as
≈ 10
19
cm
−3
(Liu et al. (2011); Zado et al. (2011); Zhang et al. (2011)).
The group-III nitrides crystallize in both, the stable wurtzite (w) phase and the metastable
cubic (c) p h ase. Unlike for the hexagonal w-structure, the growth of cubic GaN is more
complicated due to the thermodynamically unstable nature of the structure. In hexagonal
GaN inherent spontaneous and piezoelectric polarization fields are present along the c-axis
because of the crystal symmetry. Due to these fields, non-polar and semi-polar systems
have attracted interest. One method to produce real non-polar materials is the growth of
the c-phase. Considerable advances in the growth of c-nitrides, with the aim of getting a
complete understanding of the c-nitride-derived heterostructures have been observed (As
(2009); Schörmann et al. (2007)). Successful growth of quaternary c-Al
x
In
1−x−y
Ga
y
Nlayers
lattice matched to GaN has been reported (Kemper et al. (2011); Schö rmann et al. (2006)).
The absence o f polarization fields in the c-III nitrides may be advantageous for s ome device
applications. Besides, it has been shown that these quaternary alloys can be doped easily as
p-type, and due to the wavelength localization the optical transition energies are higher in the
alloys than in GaN (Wang et al. (2007)).
However, the exact nature of the optical processes involved in the alloys with In is a subject of
controversy. Different mechanisms have been proposed for the origin of the carriers’ localized
states in the quantum well devices. One is related to the low solubility of InN in GaN, leading
to the presence of nanoclusters inside the alloy, which can be suppressed by biaxial strain
as predicted and me asured in c-InGaN samples (Marques et al. (2003); Scolfaro et. al. (2004);
Tabata et al. (2002)). The s econd mechanism proposes that the recombination occurs through
the quantum confined states (electron-hole pairs or excitons) inside the well.
In this chapter we show the results of detailed studies of the theoretical photoluminescence
(PL) and absorption spectra for several systems based on nitride quaternary alloys, using the
k ·p theory within the framework of effective mass approximation, in conjunction with the
Poisson equation for the charge distribution. E xchange-correlation effects are also included
within the local density approximation (Rodrigues et al. (2002); Sipahi et al. (1998)). All
systems are assumed to be strained, so that the optical transitions are due to confinement
effects. The theoretical method will be described in section 2. Through these calculations
the possibility of obtaining light emission from undoped (see section 3) and p-doped (see
section 4)quaternary Al
X
In
1−X−Y
Ga
Y
N/Al
x
In
1−x−y
Ga
y
N superlattices (SLs) is addressed.
By properly choosing the x and y contents in the wells and the acceptor doping concentration
N
A
as well X and Y in the barriers, it is shown to be possible to achieve light emission which
covers the visible spectrum fr om violet to red. The investigation is also extended to double
quantum wells (DQWs), as described i n section 5 , confronting the results with experimental
data reported on these systems (Kyono et al. (2006)). The results are co mpared with regard
to the PL emissions f or the different systems , also when an external electric field i s present.
Finally it is shown that by adopting appropriated combinations of SLs is possible to obtain the
best conditions in order to get white-light emission. This fact is fundamental in the design of
new optoelectronic devices.
2. Theoretical band structure and luminescence spectra calculations
During the last few years, the super-cell
k ·p method has been adapted to quantum wells and
superlattices (SLs) ( Rodrigues et al. (2002); Sipahi et al. (1996)). Using this approach, one can
self-consistently solve the 8
×8 Kane multiband effective mass equation (EME) for the charge
356
Optoelectronics - Materials and Techniques
Application of Quater nary AlInGaN- Based Alloys for Light Emission Devices 3
distribution ( Sipahi et al. (1998)). The results below are calculated assuming an infinite SL of
squared wells along <001> direction.
The multiband EME is represented with respect to plane waves with vectors K=
(2π/d )l ( l
being an integer and d the SL period) equal to the reciprocal SL vector. The rows and columns
of the 8
×8 Kane Hamiltonian refer to the Bloch-type eigenfunctions |jm
j
k) of Γ
8
heavy- and
light-hole bands, Γ
7
spin-orbit-split-hole band and Γ
6
conduction band;
k denotes a vector in
the first SL Brillouin zone (BZ).
By expanding the EME with respect to plane waves
(z|K) one is able t o represent this equation
with respect to Bloch functions
(r|jm
j
k + Ke
z
). For a Bloch-type eigenfunction (z|E
k) of the
SL of energy E and wavevector
k, the EME takes the form:
∑
j
m
j
K
jm
j
kK
|
H
0
+ H
ST
+ V
HET
+ V
A
+ V
H
+ V
XC
|
j
m
j
kK
j
m
j
kK
|E
k
= E(
k)
jm
j
kK|E
k
,(1)
where H
0
is the effective kinetic energy operator, generalized for a heterostrucures H
ST
is
the strain operator originated from the lattice mismatch, V
HET
is the potential that arises
from the band offset at the interfaces, which is diagonal with r espect to jm
j
, j
m
j
, V
XC
is the
exchange-correlation potential for carriers taken within Local Density Approximation (LDA),
V
A
is the ionized acceptor charge distribution potential, and V
H
is the Hartree potential or
one-particle potential felt by the carrier from the carriers charge density. So the Coulomb
potential, V
C
given by contribution of V
A
and V
H
potentials, can be obtained by means of the
self-consistent procedure, where the Poisson equation stands, in the reciprocal space as,
(
K
|
V
C
K
=
4πe
2
ε
1
|K −K
|
2
(
K
|
N
A
(z)
K
−
(
K
|
p(z)
K
,(2)
with ε being the dielectric constant, e the electron charge, N
A
(z) the ionized acceptors
concentration, and p
(z) being the holes charge distribution, which is given by
p
(z)=
∑
jm
j
k∈
em pty states
( zs
|
jm
j
k)
2
,(3)
where s is the spin coordinate.
The next term in the Hamiltonian is the strain potential, V
ST
. The kind of strain in these
systems is biaxial, so it c an be decomposed into two terms, a h ydrostatic term and an
uniaxial term ( Rodrigues et al. (2001)). Since the hydrostatic term changes the gap energy,
thus not affecting the valence band potential depth, only the uniaxial strain component
will be considered ( Rodrigues et al. (2001)). This latter may be calculated by the following
expression:
= −2/3D
u
xx
(1 + 2C
12
/C
11
),(4)
where
−2/3 D
u
is the shear deformation potential, C
11
and C
12
are the elastic constants, and
xx
is the lattice mismatch which is given by:
xx
=(a
barrier
− a
wel l
)/a
wel l
,(5)
357
Application of Quaternary AlInGaN- Based Alloys for Light Emission Devices
4 Will-be-set-by-IN-TECH
with a
barrier
and a
wel l
being the lattice parameters of the barrier and well materials,
respectively.
Through these definitions one can calculate the Fourier coefficients of the strain operator
(
K
|
(z)
|
K
)
and express the strain term of the Hamiltonian V
ST
as follows:
jm
j
kK
H
S
T
j
m
j
kK
=
(
K
|
(z)
K
M
j
m
j
jm
j
,(6)
where M
j
m
j
jm
j
is defined as
M
j
m
j
jm
j
=
⎛
⎜
⎜
⎜
⎜
⎜
⎜
⎝
10 00 0 0
0
−100−i
√
20
00
−10 0 −i
√
2
00 01 0 0
0 i
√
200 0 0
00i
√
20 0 0
⎞
⎟
⎟
⎟
⎟
⎟
⎟
⎠
.(7)
Exchange-correlation effects can be taken into account in the local density approximation, by
adopting a parameterized expression for an inhomogeneous hole gas, applying the exchange
interaction only for identical particles and the correlation for all of them ( Enderlein et al.
(1997)). The band shift potential V
HET
is diagonal with respect to jm
j
, j
m
j
,andisdefinedby
jm
j
kK
V
HET
|
j
m
j
kK
=
(
K
|
V
HET
|
K
δ
jj
δ
m
j
m
j
(8)
where
(
K
|
V
HET
|
K
)
are the Fourier coefficients of V
HET
along the growth direction.
From the calculated eigenstates, one can determine the luminescence and absorption spectra
of the SL by using the following general expression ( Sipahi et al. (1998))
I
(ω)=
2¯h ω
3
c
e
2
m
0
c
2
∑
k
∑
n
e
∑
n
q
,
q
=hh,lh,so
f
n
e
n
q
(
k)N
n
e
k
1
− N
n
q
k
×
γ
π
E
n
e
(
k) − E
n
q
(
k) −¯hω
2
+ γ
2
,(9)
where m
0
is the electron mass, ω is the incident radiation frequency, γ is the emission
broadening (assumed as constant and equal to 10 meV), E
n
e
and E
n
q
are the energies associated
to n
e
and n
q
, respectively, the electron and hole states involved in the transition. The
occupation functions N
n
e
k
and [1 − N
n
q
k
] are the Fermi-like occupation functions for states
in the conduction- and valence-band, respectively.
For the calculation of luminescence (absorption) spectra, the s um in Eq. ( 9) is performed over
the occupied states in the conduction (valence) band, and unoccupied states in the valence
(conduction) band ( Sipahi et al. (1998)).
The oscillator strength, f
n
e
n
q
(
k),isgivenby
f
n
e
n
q
(
k)=
2
m
0
∑
σ
e
σ
q
n
e
σ
e
k
p
x
n
q
σ
q
k
2
E
n
e
(
k) −E
n
q
(
k)
, (10)
358
Optoelectronics - Materials and Techniques
Application of Quater nary AlInGaN- Based Alloys for Light Emission Devices 5
GaN InN AlN
γ
1
2.96 3.77 1.54
γ
2
0.90 1.33 0.42
γ
3
1.20 1.60 0.64
Δ
so
(meV)17319
a(Å) 4.552 5.030 4.380
m
∗
hh
0.86 0.84 1.44
m
∗
lh
0.21 0.16 0.42
m
∗
so
0.30 0.24 0.63
m
∗
e
0.15 0.10 0.067
E
Γ
g
(eV) 3.3 0.9 5.94
a
g
(eV) -8.50 -12.98 -9.40
2/3D
u
(eV) 1.6 1.2 1.5
C
11
(GPa) 293 187 304
C
12
(GPa) 159 125 160
Table 1. Values of the parameters used in the self-consistent calculations of the p-doped cubic
(Al
0.20
In
0.05
Ga
0.75
)N/(Al
x
In
1−x−y
Ga
y
)N SLs. Data extracted from Refs. (Ramos et al. (2001);
Rodrigues et al. (2000; 2002); Schörmann et al. (2006)).
where p
x
is the dipole momentum in the x-direction, σ
e
and σ
q
denote the spin values for
electron and holes, respectively.
All the parameters used in this analysis are shown in Table I. For the quaternary (Al
x
In
1−x−y
Ga
y
)N band gap energy dependence on the alloy contents, x and y, was used the expression
provided in Ref.( Marques et al. (2003)). For all the other quantities, linear interpolations
were taken using the values for the binaries, AlN, GaN, InN. The temperature dependence
of bandgap energies was evaluated t hrough the Varshni analytical expression as applied for
GaN ( Kohler et al. (2002)).
3. Undoped cubic Al
x
In
y
Ga
1−x−y
N systems
In order to analyze the effects of the use of quaternary alloys in the electronic transitions, Fig.
1 presents the theoretical PL spectra at T= 2 K calculated for strained undoped In
0.2
Ga
0.8
N
/Al
x
Ga
y
In
1−x−y
N S Ls with x=0.03, 0.10, and 0.20 and y=0.40, 0.47, and 0.51, respectively. The
barriers, constituted by the ternary alloy, have width d
1
= 60 nm, while the wells have width
d
2
= 3 nm. It is important to remark that all systems are strained, so the luminescence cannot
arise from nanoclusters created during the growth. In all cases in this section the first peak
seen in the PL spectra corresponds to the first electronic transition E1-HH1 (first electron level
E1 and first heavy-hole level HH1) ( Rodrigues et al. (2005)).
From Fig. 1 one can observe that with the appropriate choice of parameters it is possible to
reach wavelengths from the red to the blue region. One can also see that, by changing the well
width a s depicted in Fig. 2, the peaks in the PL spectra exhibit larger var iations. As the well
width decreases, the transition energy gets closer to the red region. T his occurs because of the
changes in the energies caused by the confinement and strain effects, which become stronger
as the In content increases.
As the results described above are from systems where InGaN represents the barriers and
the quaternary alloy is in the wells, one can change the picture and start analyzing systems
where the barriers c orrespond to the quaternary alloys while the InGaN alloy forms the wells.
359
Application of Quaternary AlInGaN- Based Alloys for Light Emission Devices
6 Will-be-set-by-IN-TECH
Fig. 1. Theoretical normalized PL spectra for strained undoped
In
0.2
Ga
0.8
N/Al
x
Ga
y
In
1−x−y
N SLs, with x=0.03 (solid line), 0.10 (dashed line), and 0.20
(dotted line) and y= 0.40, 0.47, and 0.51, respectively, barrier width d
1
= 60 nm, well width d
2
=3nm.
Fig. 2. PL peaks as a function of the well width d
2
for the same systems of Fig. 1.
Fig. 3 presents calculated SL systems with the same configurations as Fig. 1, but using
GaN as barriers instead of Al
x
Ga
y
In
1−x−y
N. It presents calculated theoretical PL spectra,
at T = 2 K, for Al
0.10
Ga
0.47
In
0.43
N/ In
0.55
Ga
0.45
N, Al
0.17
Ga
0.47
In
0.36
N/ In
0.42
Ga
0.68
N, and
Al
0.25
Ga
0.47
In
0.28
N/ In
0.25
Ga
0.75
N SLs (solid lines). The figure presents also, for comparison,
the systems of Fig. 1 (dashed lines). A similar behavior, as obtained in Fig.1, is seen also
for InGaN barriers, with the possibility of light emission covering the entire visible spectra.
360
Optoelectronics - Materials and Techniques
Application of Quater nary AlInGaN- Based Alloys for Light Emission Devices 7
Fig. 3. T h eoretical normalized PL spectra for the strained undoped SLs
Al
0.10
Ga
0.47
In
0.43
N/In
0.55
Ga
0.45
N (solid line), Al
0.17
Ga
0.47
In
0.36
N/In
0.42
Ga
0.68
N (dashed line)
and Al
0.25
Ga
0.47
In
0.28
N/In
0.25
Ga
0.75
N (dotted line). The barrier width is d
1
=60nmandthe
well width is d
2
= 3 nm. For comparison, we show the results for the SLs GaN/In
0.55
Ga
0.45
N
(dash-dotted line), GaN/GaN/In
0.42
Ga
0.68
N (dash-dot-dotted line), and GaN/In
0.25
Ga
0.75
N
(short-dashed line) systems.
However, this is not possible using GaN in the barriers, since we have a limitation imposed by
the fixed gap energy value for GaN. Another finding refers to the transition energies appearing
higher when the quaternary alloys constitute the barriers, when compared with the case in
which InGaN is in the barriers. This can be explained by the effective mass values which are
higher in the Al
x
Ga
y
In
1−x−y
N alloys than in InGaN.
It is also very important to investigate the influence of an external electrical field on the
transition energies and how the results compare with those for the wurtzite phase structures.
In Fig. 4, the theoretical PL and electroluminescence (EL) spectra were depicted at T= 2 K
calculated for strained undoped In
0.1
Ga
0.9
N/ Al
x
Ga
y
In
1−x−y
N SLs with x=0.03, 0.10 and 0.20,
and y=0.50. For these calculations the barrier width is d
1
= 8 nm and the well width is d
2
=
3 nm. The magnitude of the electric field was 1.6 MV/cm for the EL spectra calculations. The
results indicate that the electric field enhances the shift seen in the spectra towards the red
region, as compared with the PL spectra. This fact can be better visualized in Fig. 5, which
shows the reduction in the transition energy as the electric field i ncreases. Such behavior is
attributed to the fact that the potentials become deeper as the electrical field increases. The
main consequence is the presence of more levels occupied near the bottom of the potential
wells. Comparing with wurtzite structures, which have intrinsic built-in electric fields, the
situation described here is very similar, however in cubic systems higher efficiencies are
predicted ( Rodrigues et al. (2005)).
361
Application of Quaternary AlInGaN- Based Alloys for Light Emission Devices
8 Will-be-set-by-IN-TECH
Fig. 4. Theoretical normalized PL (solid line) and electroluminescence (dashed line) spectra
for strained undoped In
0.1
Ga
0.9
N/Al
x
Ga
y
In
1−x−y
N SLs, with x = 0.03, 0.10, and 0.20, and y =
0.50, respectively, b arrier width d
1
= 8 nm and well width d
2
= 3 nm . The electric field used
for EL was 1.6 MV/cm.
Fig. 5. PL peaks as a function of the magnitude of the electric field for systems with the same
quaternary alloy contents as the ones in Fig. 4.
4. Doped cubic Al
x
In
y
Ga
1−x−y
N systems
An important aspect to be analyzed is the effect of the acceptor doping on the electronic
transitions. Fig. 6 presents the PL spectra at T = 2 K for strained p-type doped
Al
0.20
Ga
0.05
In
0.75
N/ Al
x
In
y
Ga
1−x−y
N SLs, for which x and y are varied as described in Table
362
Optoelectronics - Materials and Techniques
Application of Quater nary AlInGaN- Based Alloys for Light Emission Devices 9
2. The ionized acceptor doping concentration considered to be uniformly distributed in
the barriers and fully ionized, is also varied assuming values of N
A
= 5 × 10
18
cm
−3
and
N
A
= 10 × 10
18
cm
−3
.ThesevaluesofN
A
allow us to envisage what happens in the range
from very low hole concentrations up to concentrations as high as
≈ 10
19
cm
−3
.Theundoped
system is also presented for comparison. The barriers widths are 8 nm and the wells widths
are 3 nm ( Rodrigues et al. (2007)). The choice of v alues for x and y, the Al and In alloy contents
was such to reach all the visible-UV wavelength region.
c-(Al
0.20
In
0.05
Ga
0.75
)N/(Al
x
In
1−x−y
Ga
y
)N xy1 − x − y
red 0.00 0.35 0.65
green 0.02 0.40 0.58
blue 0.08 0.45 0.47
blue-violet 0.10 0.50 0.40
violet 0.15 0.55 0.30
Table 2. Values used for the alloy contents x and y in the p-doped
c-(Al
0.20
In
0.05
Ga
0.75
)N/(Al
x
In
1−x−y
Ga
y
)N SLs, properly chosen to attain light emission in
the electromagnetic spectral regions indicated in the left column.
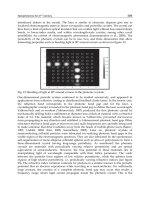
Fig. 6. Calculated normalized photoluminescence (PL) spectra, at T = 2 K, for
Al
0.20
In
0.05
Ga
0.75
N/Al
x
In
1−x−y
Ga
y
NSLs,forx and y values as shown in Table 2, for ionized
acceptor concentrations of N
A
= 0, N
A
= 5 ×10
18
cm
−3
,andN
A
= 10 ×10
18
cm
−3
.The
energy range covers the electromagnetic spectrum from red to violet.
In Fig. 7 the PL peaks are depicted as a function of the acceptor doping concentration for the
first electronic transition E1-HH1. As N
A
increases a red-shift in energy is observed for all
regions investigated, except for the red region which presents a second electronic transition
E1-HH2 (first electron level E1 and second occupied heavy-hole level HH2) for N
A
=0and
5
×10
18
cm
−3
. This behavior is directly related to the transition probabilities in such systems
and the potential profile due to the charges distribution. The later is determined by the balance
between the Coulomb and exchange-correlation potentials contribution which defines the
potential bending.
363
Application of Quaternary AlInGaN- Based Alloys for Light Emission Devices
10 Will-be-set-by-IN-TECH
Fig. 7. Peaks of PL spectra of Fig. 6 as a function of the acceptor doping concentration, N
A
.
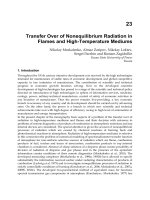
Fig. 8. p-doped Al
0.20
In
0.05
Ga
0.75
)N/In
0.65
Ga
0.35
NSL,withN
A
= 5 ×10
18
cm
−3
,whichemits
in the red: (a) Real-space energy diagram showing the spatial dependence of the valence
band edges for heavy (V
hh
), light (V
lh
), and split-off (V
so
) hole bands. Eight energy hole
levels inside the well are depicted. Also shown, by thick dash-dotted lines, are the acceptor
level in the barrier and the position of the Fermi level, E
F
. The energy zero was taken at the
top of the Coulomb potential at the barrier; (b) Different contributions to the self-consistent
total heavy-hole potential (V
hh
), due to the Coulomb (V
hh
C
) and due to the
exchange-correlation (V
hh
XC
) potentials.
In order to enhance the v isualization of this behavior, Fig. 8 shows (a) the potential profile
for the Al
0.20
In
0.05
Ga
0.75
)N/ (In
0.65
Ga
0.35
)N SL, with N
A
= 5 ×10
18
cm
−3
, corresponding to
the red emission in PL depicted in Fig. 7. The potential profile for each kind of carrier:
364
Optoelectronics - Materials and Techniques
Application of Quater nary AlInGaN- Based Alloys for Light Emission Devices 11
heavy-holes, V
hh
, light-holes V
lh
and split-off holes, V
so
is shown, as well as the Fermi
energy, E
F
. The acceptor level is also indicated; for the nitrides, the acceptor level energy
is deep, around 200 meV. However, the barriers in the nitrides are high since the strain effects
are strong due the large lattice mismatch. The energy zero was placed at the top of the
total Coulomb potential at the barrier. Fig. 8 (b) presents the exchange-correlation (V
hh
XC
)
and Coulomb potential (V
hh
C
) profiles inside the well for the heavy-holes. For this case, in
particular, the exchange-correlation potential stands out the Coulomb potential. So the total
heavy-holes potential, V
hh
is attractive and follows the same behavior of V
XC
.
The rapid screening of the Coulomb potential because of the higher effective masses of the
nitrides is responsible for this behavior. Consequently, the electronic transition decreases and
the energy shifts to the red region.
The PL spectra behavior with the increase of the temperature could also be analyzed. Fig. 9
presents the PL spectra of one of the systems shown in Fig. 6, emitting in the red wavelength,
the Al
0.20
In
0.05
Ga
0.75
N/In
0.35
Ga
0.65
NSL,withN
A
= 10 ×10
18
cm
−3
. As seen above, at T= 2
K one can observe two peaks, E1-HH1 and E1-HH2. As the temperature increases, a red-shift
in energy is seen. Above T= 200 K, other electronic transitions start to appear, showing a
third peak (E1-HH3), and for T=300 K, also a forth peak (E1-HH4). This behavior is due to
the higher probability of occupation of higher valence band energy levels as the temperatures
increases. The red-shift in energy is a consequence of the band gap shrinkage. One can also
observe that the peaks corresponding to the higher electronic transitions seen at T= 200 and
300 K are stronger due to the larger values for the oscillator strengths.
Fig. 9. Calculated PL spectra at T= 2 K (solid line), T= 40 K (dashed line), T= 80 K (dotted
line), T= 100 K (dash-dotted line), T= 200 K (dash-dot-dotted line) and T= 300 K
(short-dashed line) for the Al
0.20
In
0.05
Ga
0.75
N/In
0.35
Ga
0.65
NSL,withN
A
= 10 ×10
18
cm
−3
,
which emits in the red wavelength (see table 2).
Another important element to analyze in doped systems is the PL spectra dependence on
the doping concentration. Fig. 10 depicts the calculated PL and absorption spectra, at T =
2K, for a p-doped Al
0.20
In
0.05
Ga
0.75
N/Al
x
In
1−x−y
Ga
y
N SL, corresponding to emission in the
365
Application of Quaternary AlInGaN- Based Alloys for Light Emission Devices
12 Will-be-set-by-IN-TECH
Fig. 10. Calculated PL and absorption spectra, at T = 2 K, for a p-doped
(Al
0.20
In
0.05
Ga
0.75
)N/(Al
x
In
1−x−y
Ga
y
)N SL, which emits in the blue region (see Table II), for
N
A
= 0 (undoped), N
A
= 5 ×10
18
cm
−3
,andN
A
= 1 ×10
19
cm
−3
.
blue region, for N
A
= 0 (undoped), N
A
= 5 ×10
18
cm
−3
,andN
A
= 10 × 10
18
cm
−3
.One
can clearly observe a red shift in both, the PL and absorption spectra, as the acceptor doping
concentration increases due to the confinement and many b ody effects. From these results the
values obtained f or the Stokes shift can be extracted, taken as the energy difference between
the PL peak and the absorption edge. A significant increasing in the values of the Stokes
shifts with the increase of N
A
can be seen. This is due to the fact that many-body effects
such as exchange and correlation within the 2DHG have shown to be relevant, particularly
for high hole-density systems. The values encountered for the Stokes shifts in the systems
shown in Fig. 10 are approximately 20 meV and 40 meV, respectively, for N
A
= 5 ×10
18
cm
−3
and N
A
= 10 ×10
18
cm
−3
. Similar values for the Stokes shifts have been found for p-doped
ternary (AlGa)N/GaN SLs ( Rodrigues et al. (2007)).
5. Double Al
x
In
y
Ga
1−x−y
N quantum wells
This section is dedicated to the the study of the PL spectra for undoped and p-doped Al
x
In
1−x−y
Ga
y
N/Al
X
In
1−X−Y
Ga
Y
N double quantum wells (DQWs), in which the Al and the
In contents, as well as, the well and spike widths are varied. A schematic diagram of
the investigated DQWs is presented in Fig. 11. The well and spike widths, d
w
and d
s
,
respectively, are indicated. The first electronic transition is also shown and corresponds to the
transition between the first electron level and the first occupied heavy-hole level (E1- HH1)
( Rodrigues et al. (2008)).
Fig. 12 presents the theoretical PL s pectra from undoped DQWs constituted by A l
0.25
In
0.05
Ga
0.70
N in the barrier, 10 nm width, followed by a variable width well (d
w
)ofAl
0.08
In
0.37
Ga
0.55
N, a variable width spike (d
w
)ofAl
0.10
In
0.10
Ga
0.80
N, again a variable width well (d
w
)
of Al
0.08
In
0.37
Ga
0.55
N a nd a fixed b arrier o f 10 nm of Al
0.25
In
0.05
Ga
0.70
N. This set of spectra
corresponds to the cases in which the spike width is fixed in 4 nm and the well width is varied
366
Optoelectronics - Materials and Techniques
Application of Quater nary AlInGaN- Based Alloys for Light Emission Devices 13
Fig. 11. Sche matic diagram for the conduction and valence bands of the DQW structure
investigated here. d
w
and d
s
are the well and the spike widths, respectively. The interband
transition is also indicated, as well as the first electron (E1) and heavy-hole (HH1) occupied
levels.
Fig. 12. Calculated PL spectra at T = 2 K for undoped c-Al
0.25
In
0.05
Ga
0.70
N/
Al
0.08
In
0.37
Ga
0.55
N/Al
0.10
In
0.10
Ga
0.80
N DQWs for well width d
w
= 4 nm and spike widths d
s
= 8 nm, 6 nm, 5 nm, 4 nm, 3 nm, and 2 nm.
from 2 nm, 3 nm, 4 nm, 5nm, 6 nm, to 8 nm. A blue-shift is present in energies up to d
w
=4nm,
whereas there is a red-shift for d
w
> 4 nm, and beyond this value a blue-shift is observed for
values of d
w
> 5 nm. This behavior can be explained by the fact that for d
w
<4nmtheDQW
is in an interacting regime and at d
w
= 5 nm it reaches the changing point from interacting
367
Application of Quaternary AlInGaN- Based Alloys for Light Emission Devices
14 Will-be-set-by-IN-TECH
regime to isolated QWs. For larger wells, the spike width loses its importance and above d
w
= 5 nm it occurs a blue-shift in the energy due to the confinement effects for isolated wells.
Fig. 13 presents calculated PL spectra for systems with fixed well width d
w
=4nmandspike
width, d
s
, varying from 2 to 8 nm. One can observe a red-shift in energy as d
s
increases. This
leads to the conclusion that confinement levels are localized deeper, decreasing the electronic
transition energies.
Fig. 13. Calculated PL spectra at T = 2 K for undoped c-Al
0.25
In
0.05
Ga
0.70
N/
Al
0.08
In
0.37
Ga
0.55
N/ Al
0.10
In
0.10
Ga
0.80
NDQWsforthespikewidthd
s
= 4 nm and well width
d
w
= 8 nm, 6 nm, 5 nm, 4 nm, 3 nm, and 2 nm.
To analyze the properties of doped systems, Fig. 14 presents the PL spectra at 2 K for the same
system depicted in Fig. 12, and for spike and well widths fixed at 4 n m. The two-dimensional
(2D) acceptor doping concentration is varied assuming values of N
2D
= 2 ×10
12
cm
−2
,4×
10
12
cm
−2
,and8×10
12
cm
−2
. The undoped system is also presented for comparison. One
can observe a red-shift in energy up to N
2D
= 4 × 10
12
cm
−2
,andforN
2D
= 8 ×10
12
cm
−2
a blue-shift is seen. This behavior is due to the potential profile, which shows a bending
that curves up for low concentrations, and curves down for high concentrations, no matter
whether the total potential is attractive or repulsive. An attractive potential is observed up
to 4
× 10
12
cm
−2
, so the levels are localized near the bottom of the wells, beyond that, the
potential is repulsive, and one can expect larger transition energies.
The last issue to be addressed in DQWs is the strain. Fig. 15 presents the PL spectra at T = 2
K for strained p-type doping Al
0.60
In
0.05
Ga
0.35
N/ Al
0.10
In
0.40
Ga
0.50
N/ In
0.10
Ga
0.90
NDQWs,
in order to analyze the spike effects. The two-dimensional acceptor donor concentration was
fixed in N
2D
= 2 × 10
12
cm
−2
. Fig. 15(a) presents the spectra for a fixed spike width d
s
=4
nm and (b) for fixed well widths d
w
= 4 nm. One can observe in Fig. 15 (a) a red-shift in
energy due to confinement effects as d
s
increases. This behavior is opposite to the one seen
in Fig. 15 (b), where a blue-shift in energy exists until d
w
=3nm,followedbyaredshift,
where a change from an interacting to an isolated well regime occurs. Af ter d
s
=5nm,againa
blue-shift in energy is observed, due to many body effects, which become more important than
the spike width contribution to these systems. It is important to note that a different behavior
is observed if compared with undoped systems. This is related to the charge distribution
368
Optoelectronics - Materials and Techniques
Application of Quater nary AlInGaN- Based Alloys for Light Emission Devices 15
inside the wells, with the Fermi level lying near the bottom of wells for thicker wells, contrary
to what is observed for thin ones. Note that in this case the transition from interacting to
isolated regime occurs in d
s
=4nm.
Fig. 14. Calculated PL spectra at T = 2 K for p-doped c-Al
0.25
In
0.05
Ga
0.70
N/
Al
0.08
In
0.37
Ga
0.55
N/ Al
0.10
In
0.10
Ga
0.80
N DQWs, for well and spike widths equal to 4 nm and
doping N
2D
= 2 ×10
12
cm
−2
(dashed-dot line), 4 ×10
12
cm
−2
(dashed line), 8 ×10
12
cm
−2
(dotted line), and undoped (solid line) for comparison.
369
Application of Quaternary AlInGaN- Based Alloys for Light Emission Devices
16 Will-be-set-by-IN-TECH
Fig. 15. Theoretical normalized PL spectra at 2 K for strained
c-Al
0.60
In
0.05
Ga
0.35
N/Al
0.10
In
0.40
Ga
0.50
N/In
0.10
Ga
0.90
N DQWs, fully p-doped barrier with
N
2D
= 2 ×10
12
cm
−2
. The systems have (a) fixed d
s
= 4nm and varying from d
w
=2nmto8
nm, and (b) fixed d
w
= 4 nm and varying from d
s
=2nmto8nm.
6. Conclusions
In this chapter it was performed a detailed investigation o f the the oretical luminescence and
absorption spectra of strained undoped and doped c- Al
X
In
1−X−Y
Ga
Y
N/ Al
x
In
1−x−y
Ga
y
N
SLs and DQWs using a self-consistent resolution of the 8
×8 Kane Hamiltonian within the
effective mass theory.
At first it was shown the feasibility of reaching emissions from red light to blue light regions
by the correct combination of different quaternary alloys either in the well or in the barrier in
undoped systems. When an external field is taken into account, the theoretical spectra present
red shifts. A similar result could be obtained for the wurtzite phase of the structures, caused
by the presence of the intrinsic piezoelectric fields. In such systems, these effects lead to a
spatial segregation of the electron and hole charge distributions, causing a reduction in the
light emission efficiency. For the cubic phase structures, as the piezoelectric fields are absent,
the spatial segregation is smaller and therefore higher efficiency would be expected.
Analyzing the doped systems, it is pointed out that light emission arising from the
recombination involving confined states in the wells has not a monotonic behavior when
the doping concentration increases, even if it is always red shifted when compared to the
undoped SLs. The main reason for this is the shape of the potential bending induced by
the presence of a holes charge distribution inside the wells. The competition between the
exchange-correlation potential and the Coulomb potential was shown to be the m ain reason
for this b ehavior, since they d efine the total bending potential, attractive or repulsive, which
affects directly the optical transitions. Again, for single QWs, it was shown that by choosing
an appropriate set of alloy molar fractions and acceptor concentrations it is possible to achieve
white light emission by combining the emission in three different regions of the spectra.
370
Optoelectronics - Materials and Techniques
Application of Quater nary AlInGaN- Based Alloys for Light Emission Devices 17
Regarding to different spatial arrangements, DQWs were analyzed.It was shown for p-doped
c-Al
X
In
1−X−Y
Ga
Y
N/Al
x
In
1−x−y
Ga
y
N DQWs that the related PL spectra depict a different
behavior depending on the spike and/or adjacent well layer widths. A change in the kind of
regime from interacting we lls to isolated non-interacting we lls was demonstrated. Although
not shown here, it i s also p ossible to r each all wavelengths using the DQWs structures, as it
was demonstrated for single QWs.
Another important conclusion that must be pointed out form the set of systems analyzed
in the chapter i s that the re d region of electromagnetic spectrum can be reached through
the quaternary alloys using less In content, as compared to the ternary InGaN alloy. From
the experimental point of view this finding is fundamental, since the growth with higher In
content is more difficult.
Finally, supported by the recent advances in the growth techniques, the analysis presented
here intends to elucidate and guide the study of optical properties in semiconductor nitride
systems, bringing new possibilities for experiments and, hopefully, novel proposals for the
next generation of advanced optical devices.
7. Acknowledgments
The authors thank O. F. P. dos Santos of the Universidade Federal Rural de Pernambuco
for the discussions and Prof. E. L. Piner of Texas State University for his suggestions. We
also express our thanks to the support received from the Brazilian research financial agencies
CNPq (grants nos 564.739/2010-3/NanoSemiCon, 303.880/2008-2/PQ, 470.998/2010-5/Univ,
472.312/2009-0/Univ 304936/2009-0/ PQ, 303578/ 2007-6/ PQ, 577.219/2008-1/JP), CAPES,
FACEPE (grant no. 0553-1.05/10/APQ), and FAPESP. LS also acknowledges partial s upport
from the Materials Science, Engineering and Commercialization Program of Texas State
University.
8. References
Ambacher, O. (1998). Growth and applications of Group III-nitrides. Journal of Physics D:
Applied Physics, Vol. 31, No. 20, (October 1998) pp. 2653- 2710, ISSN 1361-6463
As, D. J. (2009). Cubic group-III nitride-based nanostructures basics and applications in
optoelectronics. Microelectronics Journal, Vol. 40, No. 2, (September 2008) pp. 204- 209,
ISSN 0022-0248
Enderlein, R.; Sipahi, G .; Scolfaro, L. M. R. & Leite, J. R. (1997). Density functional theory for
holes in semiconductors. Physical Review Letters, Vol. 79, No. 19, (November 1997) pp.
3712-3715, ISSN 0031-9007
Fernández-Garrido, S.; Redondo-Cubero, A.; Gago, R.; Bertram, F.; L una, E.; Trampert, A.;
Pereiro, J.; Muñoz, E. & Calleja, E. (2008). Effect of the g r owth temperature and the
AlN mole fraction on In incorporation and properties of quaternary III-nitride layers
grown by molecular beam e pitaxy. Journal Applied Physics, Vol. 104, No. 8, (October
2010) pp. 083510-1 -083510-7, ISSN 0021-8979
Fu,Y-K.;Jiang,R-H.;Lu,Y-H.;Chen,B-C.;Xuan,R.;Fang,Y-H.;Lin,C-F.;Su,Y-K.
& Chen, J-F. (2011). The effect of trimethylgallium flows in the AlInGaN barrier
on optoelectronic characteristics of near ultraviolet light-emitting diodes grown by
atmospheric pressure metalorganic vapor phase epitaxy. Applied Physics Letters,Vol.
98, No. 12, (March 2011) pp. 121115-1 -121115-3, ISSN 0003-6951
371
Application of Quaternary AlInGaN- Based Alloys for Light Emission Devices
18 Will-be-set-by-IN-TECH
Hirayama, H. ( 2005). Quaternary InAlGaN-based high-efficiency ultraviolet light-emitting
diodes. Journal of Applied Physics, Vol. 97, No. 9, (April 2005) p p. 091101-1-091101-19,
ISSN 0021-8979
Hirayama, H.; Noguchi, N. & Kamata, N. (2010). 222nm D eep-Ultraviolet AlGaN Q uantum
Well Light-Emitting Diode with Vertical Emission Properties. Applied Physics Express,
Vol. 3, No. 3, (March 2010) pp. 032102-1-032102-3, ISSN 1882-0778
Kemper, R. M.; Weinl, M.; Mietze, C.; Härbelen, M. H.; Schupp, T.; Tshucmak, E.; Lindner,
J. K. N., Lischka, K. & As, D. J. (2011). Growth of cubic GaN on nano-patterned
3C-SiC/Si(001)substrates. Journal Crystal Growth, Vol. 323, No. 1, (May 2011) pp. 84
-87, ISSN 0022-0248
Kim, K. H.; Li, S.; Jin, S. X.; Lin, J. Y. & Jianga, H. X. (2003). III-nitride ultraviolet light-emitting
diodes with delta doping. Applied Physics Letters, Vol. 83, No. 3 , (July 2003) pp. 566
-568, ISSN 0003-6951
Knauer, A.; Wenzel, H.; Kolbe, T.; Einfeldt, S.; Weyers, M.; Kneissl, M. & Tränkle, G. (2008).
Effect of the barrier composition on the polarization fields in near UV InGaN light
emitting diodes. Applied Physics Letters, Vol. 92, No. 19, (may 2008) pp. 191912-1
-191912-3, ISSN 0003-6951
Kyono, T.; Hirayama, H.; Akita, K.; Nakamura, T.; Adachi, M. & Ando, K. (2006). Influence
of residual oxygen impurity in quaternary InAlGaN multiple-quantum-well active
layers on emission efficiency of ultraviolet light-emitting diodes on GaN substrates.
Journal Applied Physics, Vol. 99, No. 11 , (June 2006) pp. 114509-1 -114509-7, ISSN
0021-8979
Kohler, U.; As, D. J.; Potthast, S.; Khartchenko, A.; Lischka, K.; Noriega, O. C.; Meneses, E. A.;
Tabata, A.; Rodrigues, S. C. P.; Scolfaro, L. M. R.; Sipahi, G. M. & Leite, J. R. (2002).
Optical Characterization of Cubic AlGaN/GaN Quantum Wells. physica statu solid
(a), Vol. 192, No. 1, (July 2002) pp. 129-134, ISSN 1862-6319
Liu, J.; Zhang, Y.; Lochner, Z.; Kim, S-S.; Kim, H-S.; Ryou, J-H.; Shen, S-C.; Yoder, P. D.;
Dupuis, R. D.; Wei, Q. Y.; Sun, K. W.; Fisher, A. M. & Ponce, F. A. (2011). Performance
characteristics of InAlGaN laser diodes depending on electron blocking layer and
wave guiding layer design grownby metalorganic chemical vapor deposition. Journal
of Crystal Growth, Vol. 315, No. 1, (October 2010) pp. 272-277, ISSN 0021-8979
Marques, M; Teles, L. K.; Scolfaro, L. M. R.; Leite, J. R.; Furthmüller, J . & Bechstedt, F. (2003).
Lattice parameter and energy band gap of cubic Al
x
Ga
y
In
1−x−y
N quaternary alloys.
Applied Physics Letters, Vol. 83, No. 5, (March 2003) pp. 890-893, ISSN 0003-6951
Nakamura, S; Senoh, M.; Iwasa, N. & Nagahama, S. (1995). High-power InGaN
single-quantum-well-structure blue and violet light-emitting diodes. Applied Physics
Letters, Vol. 67, No. 13, (July 1995) pp. 1868-1870, ISSN 0003-6951
Nakamura, S.; Pearton, S. & Fasol, G. (2000). The Blue Laser Diode: the complete story,Springer,
ISBN 3-540-66505-6, Berlin.
Park, S-H; Ahn, D. & Kim, J-W. (2008). Optical gain in InGaN/InGaAlN quantum well
structures with zero internal field. Applied Physics Letters, Vol. 92, No. 17, (May 2008)
pp. 171115-1 -171115-3, ISSN 0003-6951
Ramos, L. E.; Teles, L. K.; Scolfaro, L. M. R.; Castineira, J. L. P.; Rosa, A. L. & Leite, J.R.
(2001). Structural, electronic, and effective-mass properties of silicon and zinc-blende
group-III nitride semiconductor compounds. Physical Review B, Vol. 63, No. 16, (April
2001) pp. 165210-1 -165210-10, ISSN 1098-0121
372
Optoelectronics - Materials and Techniques
Application of Quater nary AlInGaN- Based Alloys for Light Emission Devices 19
Roberts, J. C.; McIntosh, F. G.; Aumer, M. E.; Piner, E. L.; Joshkin, V. A.; Liu, S.; El-Masry, N. A.
& Bedair, S. M. (1996). Stacked InGaN/AlGaN Double Heterostructures. 1996 MRS
Proceedings, Vol. 449, No. 1, (December 1996) pp. 1161-1165, ISSN 1946-4274
Rodrigues, S. C. P.; Scolfaro, L. M. R.; Leite, J. R. & Sipahi, G. M. (2000). Valence band structure
of cubic AlGaN/GaN superlattices. Applied Physics Letters,Vol.76,No.8,(December
1999) pp. 1015-1017, ISSN 0003-6951
Rodrigues, S. C. P.; Sipahi, G.; Scolfaro, L. M. R. & Leite, J. R. (2001). Exchange-correlation
effects on the hole miniband structure and confinement potential in zincblende
AlGaN/GaN superlattices. Journal of Physics. Condensed Matter, Vol. 13, No. 14, (April
2001) pp. 3381-3387, ISSN 0953-8984
Rodrigues, S. C. P.; Sipahi, G.; Scolfaro, L. M. R. & L eite, J. R. (2002). Hole charge localization
and band structures of p-doped GaN/InGaN and GaAs/InGaAs semiconductor
heterostructures. Journal of Physics. Condensed Matter, Vol. 14, No. 23, (May 2002) pp.
5813-5827, ISSN 0953-8984
Rodrigues, S. C. P.; Sipahi, G. M. & da Silva Jr, E. F. (2005). Optical and electronic properties of
AlInGaN/InGaN superlattices. Microelectronics Journal Microelectronics Journal,Vol.
36, No. 3-6, (March 2005) pp. 434-437, ISSN 0022-0248
Rodrigues, S. C. P.; d’Eurydice, M. N.; Sipahi, G. M. & da Silva Jr, E. F. (2005). Design of
InGaN/AlInGaN superlattices for white-light device applications. Microelectronics
Journal, Vol. 36, No. 3-6, (March 2005) pp. 1002-1005, ISSN 0022-0248
Rodrigues, S. C. P.; d ’Eurydice, M. N.; Sipahi, G. M.; Scolfaro, L. M. R. & da Silva
Jr, E. F. (2007). White light emission from p-doped quaternary (InGaAl)N-based
superlattices: the oretical calculations for the cubic phase. Journal Applied Physics,Vol.
101, No. 11, (June 2007) pp. 113706-113706-6, ISSN 0021-8979
Rodrigues, S. C. P.; dos Santos, O. F. P.; Scolfaro, L. M. R.; Sipahi, G. M. & da Silva Jr, E. F. (2008).
Luminescence Studies on Nitride Quaternary Alloys Double Quantum Wells. Applied
Surface Science, Vol. 254, No. 23, (February 2008) pp. 7790-7793, ISSN 0169-4332
Schörmann, J.; As, D. J.; Lischka, K.; Schley, P.; Goldhahn, R.; Li, S. F.; Lffler, W.; Hetterich, M.
& Kalt, H. (2006). Molecular beam epitaxy of phase pure cubic I nN. Appl ied P hysics
Letters, Vol. 89, No. 26, (December 2006) pp. 261903-261905, ISSN 0003-6951
Schörmann, J.; Potthast, S.; As, D. J. & Lischka, K. (2007). Molecular beam epitaxy of phase
pure cubic InN. Applied Physics Letters, Vol. 90, No. 4, (January 2007) pp. 041918-1
-041918-3, ISSN 0003-6951
Scolfaro, L. M. R.; Teles, L. K.; Marques, M.; Ferreira, L. G. & Leite, J. R. (2004). Phase
Separation and Ordering in Cubic Ternary and Quaternary Nitride Alloys, In:
Optoelectronic Devices: III-Nitrides, M. Razegui, M. Henini, (Ed.), pp. 455-478, Elsevier,
ISBN 0-08-044426-1, Oxford
Sipahi, G. M.; Enderlein, R.; Scolfaro, L . M. R. & Leite, J. R. (1996). B and structure of holes in
p-type δ-doping quantum wells and superlattices. Physical Review B, Vol. 53, No. 15,
(april 1996) pp. 9930-9942, ISSN 1098-0121
Sipahi, G. M.; Enderlein, R.; Scolfaro, L. M. R.; Leite, J. R. & Levine, A . (1998). Theory of
luminescence spectra from δ-doping structures: application to GaAs. Physical Review
B, Vol. 57, No., (April 1998) pp. 9168-9178, ISSN 1098-0121
Suihkonen, S.; Svensk, O.; Törmä, P. T.; Ali, M.; Sopane, M.; Lipsanen, H.; Odnoblyudo, M.
A. & Bougrov, V. E. (2008). MOVPE growth and characterization of InAlGaN films
and InGaN/InAlGaN MQW structures. Journal of Crystal Growth , Vol. 310, No. 7-9,
(November 2007) pp. 1777-1780, ISSN 0022-0248
373
Application of Quaternary AlInGaN- Based Alloys for Light Emission Devices