Solar Cells New Aspects and Solutions Part 3 docx
Bạn đang xem bản rút gọn của tài liệu. Xem và tải ngay bản đầy đủ của tài liệu tại đây (1.13 MB, 35 trang )
Flexible Photovoltaic Textiles for Smart Applications
61
8. Some facts about the photovoltaic textiles
To achieve a highly efficient photovoltaic device, solar radiation needs to be efficiently
absorbed. In case of solar cell the absorption of light causes electron hole pairs which
are split into free carriers at the interface between the donor and the acceptor material.
Active areas for photovoltaic fibres are generally found between 4 and 10mm
2
.
The power conversion efficiency of the MDMO-PPV:PCBM based photovoltaic fibre
was higher than the P3HT:PCBM based photovoltaic fibres
Due to circular cross-sectional shape of photovoltaic fibres, the light is absorbed at
different angles
Generally the photoactive layer thickness remain approximately between 280-350nm. A
thick film can absorb more light compared to a thin film. By the increase of film
thickness, the electrical field and the number of charge carriers decrease and
consequently a decrease in the external quantum efficiency of the devices is observed.
Although, the film thickness is restricted in presence of low-charge carrier. The
optimum thickness is required to provide both maximum light absorption and
maximum charge collection at the same fraction of moment. Optimization of thickness
of various layers of photovoltaic fibres provides the possibility to increase the power
conversion efficiency of polymer-based solar cells.
The thickness of the layers for optimal photovoltaic fibre can be controlled by solution
concentration and dipping time.
Photovoltaic fibre based organic solar cells can be curled and crimped without losing
any photovoltaic performance from their structure.
Low power conversion efficiency of photovoltaic textiles is the real challenge in this
field and can be improved by significant improvement in existing photovoltaic material
and techniques. In case of organic solar cells, the optical band gap is very critical and it
must be as narrow as possible because the polymers with narrow band gap are able to
absorb more light at longer wavelengths, such as infrared and near-infrared. Hence low
band gap polymers (<1.8 eV) can be used as better alternative for higher power
harvesting efficiency in future if they are sufficiently flexible
68,69
.
The incorporation of C60 barrier layer can improve the performance of photovoltaic
textiles.
Generally the performance of freshly made photovoltaic textiles was found best because
cell degradation happens fast when sun illumination takes place in absence of O
2
barriers.
The self life of polymer based photovoltaics is short under ambient conditions
70
.
9. Photovoltaic textile, developments at international level
The incorporation of polymer photovoltaics into textiles was demonstrated by Krebs et a.,
(2006) by two different strategies. Simple incorporation of a polyethyleneterphthalate (PET)
substrate carrying the polymer photovoltaic device prepared by a doctor blade technique
necessitated the use of the photovoltaic device as a structural element
71
.
The total area of the device on PET was typically much smaller than the active area due to
decorative design of aluminium electrode. Elaborate integration of the photovoltaic device
into the textile material involved the lamination of a polyethylene (PE) film onto a suitably
Solar Cells – New Aspects and Solutions
62
transparent textile material that was used as substrate. Plasma treatment of PE-surface
allowed the application of a PEDOT electrode that exhibited good adherence. Screen
printing of a designed pattern of poly 1,4-(2-methoxy-5-(2-ethylhexyloxy)
phenylenevinylene (MEH-PPV) from chlorobenzene solution and final evaporation of an
aluminum electrode completed the manufacturing of power generating device. The total
area of the textile device was 1000 cm
2
(25cm x 40cm) while the active area (190 cm
2
) was
considerably smaller due to the decorative choice of the active material.
Konarka Inc. Lowell, Mass., U.S.A demonstrated a successful photovoltaic fiber. Presently, a
German company is engaged with Ecole Polytechnique Fédérale de Lausanne (EPFL) to
optimize the fiber properties and weave it into the power-generating fabric. Solar textiles
would able to generate renewable power generation capabilities. The photovoltaic fibres are
able to woven in fabric form rather than attached or applied on other surfaces where
integration remains always susceptible. The structures woven by photovoltaic fibres are able
to covert into fabric, coverings, tents and garments.
Patterned photovoltaic polymer solar cells can be incorporated on PET clothing by sewing
through the polymer solar cell foil using an ordinary sewing machine. Connections between
cells were made with copper wire that could also be sewn into the garment. The solar cells
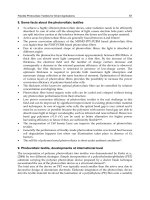
were incorporated into a dress and a belt as shown in Fig.11 (Tine Hertz).
Fig. 11. Textile solar cell pattern designed by Tine Hertz and Maria Langberg of Danmarks
Designkole
Shafarman et al., (2003) demonstrated thin film solar cells by using CuInGaSe
2
photovoltaic
polymers and this film is more suitable for patching onto clothing into different patterns
72
.
The polymer photovoltaics technology is in its infancy stage and many gaps need to be
bridged before commercialization. Prototype printing machines are useful to apply PVs on
textile surface into decorative pattern as shown in Fig. 11, 12,13.
Flexible Photovoltaic Textiles for Smart Applications
63
Fig. 12. Patterned polymer cell (with permission)
Fig. 13. Photovoltaic decorative patterns
Massachusetts Institute of Technology (MIT) Cambridge, Massachusetts revealed that the
integration of solar cell technology in architecture creates designs for flexible photovoltaic
materials that may change the way buildings receive and distribute energy. Sheila Kennedy
of (MIT) used 3-D modeling software for her solar textiles designs, generating membrane-
like surfaces that can become energy-efficient cladding for roofs or walls
73
. Solar textiles
may also be used like tents as shown in Fig. 14.
Solar Cells – New Aspects and Solutions
64
Fig. 14. Photovoltaic textile as a tent (with permission)
Fig. 15. A typical example of photovoltaic textile (with permission)
Commission for Technology and Innovation (CTI) Switzerland also exhibited a keen
interest in the development of photovoltaic textiles.
Thuringian Institute of Textiles and Plastics Research (TITK) registered their remarkable
presence in order to develop photovoltaic textiles
74
.
J Wilson and R Mather have created Power Textiles Ltd, a spin-off from Heriot-Watt
University, Scotland to develop a process for the direct integration of solar cells on
textiles.
Konarka is developing solar photovoltaic fabric with joint effort of the university Ecole
Polytechnique Fédérale de Lausanne (EPFL), Switzerland. Konarka has claimed that
Flexible Photovoltaic Textiles for Smart Applications
65
they can produce a photovoltaic fiber. Presently, the Company is working with EPFL to
optimize the fiber structure and weave it into the first power-generating fabric. Solar
textiles would open up additional application areas for photovoltaics since renewable
power generation capabilities can be tightly integrated
In 2002, Konarka became the first company in the United States to license Dr. Michael
Grätzel's dye-sensitized solar cell technology, which augmented its own intellectual
property.
Thuringian Institute of Textiles and Plastics Research (TITK), Breitscheidstraße
Rudolstadt Germany, is a technically-oriented research institute, carrying out
fundamental and applied research on PV textiles suitable to easily commercialize. The
institute supports small and medium-sized enterprises in their innovation works with
interdisciplinary scientific knowledge, innovative ideas, and knowledge of the industry
and provision of modern technical infrastructure.
Professor John Wilson and Dr Robert Mather of School of Textiles and Design, formerly
the Scottish College of Textiles have created Power Textiles Ltd, a spin-off from Heriot-
Watt University, to develop a process for the direct integration of solar cells on textiles.
In a research work at American Institute of Physics, multiwall carbon nanotubes are
introduced into poly(3-hexylthiophene) and [6,6] phenyl C
61
butyric acid methyl fullerene,
bulk heterojunction organic photovoltaic devices after appropriate chemical modification
for compatibility with solution processable photovoltaics. To overcome the problem of
heterogeneous dispersion of carbon nanotubes in organic solvents, multiwall CNT are
functionalized by acid treatment. Pristine and acid treated multiwall carbon nanotubes
have been incorporated into the active layer of photovoltaic polymers which results a fill
factor of 0.62 and power harvesting efficiency of 2.3% under Air Mass 1.5 Global
75
.
Dephotex is going to develop photovoltaic textiles based on novel fibre under
collaboration with European Union.
Photovoltaic tents are developed by integration of flexible solar panels made by thin
film technology by patching on tent fabric surface. The solar cells can run ventilation
systems, lighting and other critical electrical functions, avoiding the need for both
generators and the fuel to run them.
The integration of photovoltaic technology with UV absorption technology will open very
smart passages to new product development. However, the above opinion is only a
hypothesis of author. The textile materials which are stable against ultraviolet rays are more
suitable to work as basic substrate. However, the production and integration of photovoltaic
fibres into fabric form will solve many problems concerned about simple incorporation of a
polymer photovoltaic on a textile substrate directly or by lamination of a thin layer of PVs
onto textile material followed by plasma treatment and application of a PEDOT electrode
onto the textile materials.
10. Conclusions
The incorporation of polymeric photovoltaics into garments and textiles have been explored
new inroads for potential use in ‘‘intelligent clothing’’ in more smart ways. Incorporation of
organic solar cells into textiles has been realized encouraging performances. Stability issues
need to be solved before commercialization of various photovoltaic textile manufacturing
techniques. The functionality of the photovoltaic textiles does not limited by mechanical
stability of photovoltaics. Polymer-based solar cell materials and manufacturing techniques
Solar Cells – New Aspects and Solutions
66
are suitable and applicable for flexible and non-transparent textiles, especially tapes and
fibers, with transparent outer electrodes.
The manufactured photovoltaic fibres may also be utilized to manufacture functional yarns
by spinning and then fabric by weaving and knitting. Fibres and yarns subjected to various
mechanical stresses during spinning, weaving and knitting may possibly damage the
coating layers of photovoltaic fibres. These sensitive and delicate structures must be
protected by applying special protective layers by noble coating techniques to produce
photovoltaic textiles. Photovoltaic tents, curtains, tarpaulins and roofing are available to
utilize the solar power to generate electricity in more green and clean fashion.
11. References
[1] Aernouts, T. 19th European Photovoltaics Conference, June 7–11, Paris, France, 2004.
[2] Lund P D Renewable energy 34, 2009, 53
[3] Yaksel I Renewable energy 4, 2008, 802
[4] European photovoltaic Ind. Asso. Global market outlook for photovoltaic until 2012.
www.epia.org
[5] Gunes S, Beugebauer H and Saricftci N S Chem Rev. 107, 2007, 1324
[6] Coakley KM, ,cGehee M D, Chem Mater. 16,2004,4533
[7] Organic Photovoltaics: Mechanisms, Materials, and Devices, ed. S S. Sun and N. S.
Sariciftci, Taylor & Francis, London, 2005.
[8] Organic Photovoltaics: Concepts and Realization, ed. C. J. Brabec, V. Dyakonov, J. Parisi
and N. S. Sariciftci, Springer-Verlag, Heidelberg, 2003.
[9] Tang, C.W. Two-layer organic photovoltaic cell. Applied Physics Letters, 48, (1986) 183.
[10] Sariciftci, N.S., Smilowitz, L., Heeger, A.J. and Wudl, F. (1992) photoinduced electron
transfer from a conducting polymer to buckminsterfullerene. Science, 258, 1992, 1474.
[11] Spanggaard, H. and Krebs, F.C. (2004) A brief history of the development of organic and
polymeric photovoltaics. Solar Energy Materials and Solar Cells, 83, 125.
[12] Granstrom, M., Petritsch, K., Arias, A.C., Lux, A., Andersson, M.R. and Friend, R.H.
(1998) Laminated fabrication of polymeric photovoltaic diodes. Nature, 395, 257.
[13] Yu J W, Chin B D, Kim J K and Kang N S Patent IPC8 Class: AH01L3100FI, USPC Class:
136259, 2007
[14] />Month_GB.pdf
[15] Krebs F C., Fyenbo J and Jørgensen Mikkel “Product integration of compact roll-to-roll
processed polymer solar cell modules: methods and manufacture using flexographic
printing, slot-die coating and rotary screen printing”
J. Mater. Chem., 20, 2010, 8994-9001
[16] Krebs F C., Polymer solar cell modules prepared using roll-to-roll methods: Knife-over-
edge coating, slot-die coating and screen printing Solar Energy Materials and Solar
Cells 93, (4), 2009, 465-475
[17] Luo P, Zhu Cand Jiang G Preparation of CuInSe
2
thin films by pulsed laser deposition
the Cu–In alloy precursor and vacuum selenization, Solid State Communications,
146, (1-2), 2008, 57-60
[18] Solar energy: the state of art Ed: Gordon J Pub: James and James Willium Road London, 2001
[19] Loewenstein T., Hastall A., Mingebach M., Zimmermann Y., Neudeck A. and
Schlettwein D.,
Phys. Chem. Chem. Phys., 2008, 10,1844.
[20] Lincot D. and Peulon S., J. Electrochem. Soc., 1998, 145, 864.
[21] Bedeloglua A,*, Demirb A, Bozkurta Y, Sariciftci N S, Synthetic Metals 159 (2009) 2043–2048
[22] Pettersson LAA, Ghosh S, Inganas O. Org Electron 2002;3:143.
Flexible Photovoltaic Textiles for Smart Applications
67
[23] Kim JY, Jung JH, Lee DE, Joo J. Synth Met 2002;126:311.
[24] Kim WH, Ma¨kinen AJ, Nikolov N, Shashidhar R, Kim H, Kafafi ZH. Appl Phys Lett 80,
(2002), 3844.
[25] Jonsson SKM, Birgerson J, Crispin X, Greczynski G, Osikowicz W, van der Gon AWD,
SalaneckWR, Fahlman M. Synth. Met 1, 2003;139:
[26] Ouyang J, Xu Q, Chu C W, Yang Y,*, Lib G, Shinar Joseph S On the mechanism of
conductivity enhancement in poly(3,4-ethylenedioxythiophene) : poly(styrene
sulfonate ) film through solvent treatment” Polymer 45, 2004, 8443–8450
[27] Grätzel M.,
Nature, 414, 338 (2001)
[28] Könenkamp R., Boedecker,K. Lux-Steiner M. C., Poschenrieder M., Zenia F., Levy-
Clement C. and Wagner S., Appl. Phys. Lett., 77, 2575 (2000)
[29] Boyle D. S., Govender K. and O’Brien P.
, Chem Commun., 1, 80 (2002)
[30]
[31] Hoth, C.N., Choulis, S.A., Schilinsky, P. and Brabec, C.J. “High photovoltaic performance of
inkjet printed polymer: fullerene blends” Advanced Materials, 19, 2007, 3973.
[32] M Pagliaro, G Palmisano, and R Ciriminna “Flexible Solar Cells” WILEY-VCH Verlag
GmbH & Co. KGaA, Weinheim, 2008, 98-119
[33] Bundgaard E and Krebs F C Low band gap polymers for organic photovoltaics Solar
Energy Materials and Solar Cells 91 (11), 2007, 954-985
[34] Kroon R, Lenes M, Jan C. Paul H, Blom W. M, Boer B de “Small Bandgap Polymers for
Organic Solar Cells (Polymer Material Development in the Last 5 Years)” Polymer
Reviews, 48, (3), 2008 , 531 - 582
[35] Rajahn M, Rakhlin M, Schubert M B “Amorphous and heterogeneous silicone based
films” MRS Proc. 664, 2001
[36] Schubert MB, Werner J H, Mater. Today 9(42), 2006
[37] Drew C, Wang X Y, Senecal K, J of Macro. Mol. Sci Pure A 39, 2002, 1085
[38] Baps B, Eder K M, Konjuncu M, Key Eng. Mater. 206-213, 2002, 937
[39] Gratzel M, Prog. Photovolt: Res. Appl. 8, 2000, 171
[40] Bayinder M, Shapira O, Sayain Hazezewski D Viens J Abouraddy A F, Jounnopoulas A
D and Fink Y Nature Mat. 4, 2005, 820
[41] Verdenelli M, Parole S, Chassagneux F, Lettof J M, Vincent H and Scharff J P, J of Eur.
Ceram. Soc. 23, 2003, 1207
[42] Xie C, Tong W, Acta Mater, 53, 2005, 477
[43] Muller D, Fromm E Thin Mater. Solid Films 270, 1995, 411
[44] Hu M S and Evans A G, Acta Mater, 37, 1998, 917
[45] Yang Q D, Thouless M D, Ward S M, J of Mech Phys Solids, 47, 1999, 1337
[46] Agrawal D C, Raj R, Acta Mater, 37, 1989, 1265
[47] Rochal G, Leterrier Y, Fayet P, Manson J Ae, Thin Solid Films 437,2003, 204
[48] Park S H, Choi H J,Lee S B, Lee S M L, Cho S E, Kim K H, Kim Y K, Kim M R and Lee J
K “Fabrications and photovoltaic properties of dye-sensitized solar cells with
electrospun poly(vinyl alcohol) nanofibers containing Ag nanoparticles”
Macromolecular Research 19(2), 2011, 142-146
[49] Ramiera J., Plummera C.J.G., Leterriera Y., Mansona J A.E.,_, Eckertb B., and Gaudianab
R. “Mechanical integrity of dye-sensitized photovoltaic fibers” Renewable Energy 33
(2008), 314–319
[50] Hamedi M, Forchheimer R and Inganas O Nat Mat. 6, 2007, 357
[51] Bayindir M, Sorin F, Abouraddy A F, Viens J, Hart S D, Joannopoulus J D, Fink Y Nature
431, 2004, 826
[52] Yadav A, Schtein M, Pipe K P J of Power Sources 175, 2008, 909
Solar Cells – New Aspects and Solutions
68
[53] Coner O, Pipe K P Shtein M Fibre based organic PV devices Appl. Phys. Letters 92, 2008,
193306
[54] Ghas A P, Gerenser L J, Jarman C M, Pornailik J E, Appl. Phys. Lett. 86, 2005, 223503
[55] Regan R O, Gratzel M, Nature 353, 1991, 737
[56] Wang P, Zakeeruddin S M, Gratzel M and Fluorine J Chem. 125, 2004, 1241
[57] Bedeloglu A C, Demir A, Bozkurt Y and Sariciftci N S “A photovoltaic fibre design for
smart textiles” Text. Res. J 80(11), 2010, 1065-1074
[58] Bedeloglu A C, Koeppe R, Demir A, Bozkurt Y and Sariciftci N S “Development of
energy generating photovoltaic textile structures for smart application” Fibres and
Polymers 11(3), 2010, 378-383
[59] Krebs F C, Biancardo M, Winther-Jensen B, Spanggard H and Alstrup J “Strategies for
incorporation of polymer photovoltaics into garment and textiles” Sol. Ener. Mat.
&Sol Cells 90, 2006, 1058-1067
[60] Neef C. J. and Ferraris J. P. MEH-PPV: Improved Synthetic Procedure and Molecular
Weight Control” Macromolecules, 2000, 33 (7), pp 2311–2314
[61] Winther –Jensen B and Glejbol K “Method and apparatus for the excitation of a plasma”
US Patent US6628084, Published on Sept., 9, 2003
[62] Bedeloglu A, Koeppe R, Demir A, Bozkurt Y and Sariciftci N S “Development of energy
generating PV textile structure for smart applications” Fibres and Polym. 11(3), 2010,
378
[63] Durisch W, Urban J and Smestad G “Characterization of solar cells and modules under
actual operating conditions” WERS 1996, 359-366
[64] Kim M S, Kim B G and Kim J “Effective Variables to Control the Fill Factor of Organic
Photovoltaic Cells” ACS Appl. Mater. Interfaces
, , 1 (6), 2009,1264–1269
[65] Wang W, Xia G , Zheng J , Feng L and Hao R “Study of polycrystalline ZnTe(ZnTe:Cu)
thin films for photovoltaic cells” Journal of Materials Science: Materials in Electronics
18(4), 2007, 427-431
[66] Khanna, R.K. "Raman-spectroscopy of oligomeric SiO species isolated in solid methane".
Journal of Chemical Physics 74 (4), (1981) 2108
[67] Miller S, Fanchini G, Lin Y Y, Li C, Chen C W, Sub W F and Chhowallaa M
“Investigation of nanoscale morphological changes in organic photovoltaics during
solvent vapor annealing” J. Mater. Chem., 2008, 18, 306–312
[68] Perzon E, Wang X, Admassie S, Inganas O, and Andersson M R “An alternative low
band gap polyflourene for optoelectronic devices” Polymer 47, 2006, 4261-4268
[69] Campos L M, Tontcheva A, Gunes S, Sonmez G, Neugebauer H, Sariciftci N S and Wudl
F “Extended photocurrent spectrum of a low band gap polymer in a bulk
heterojunction solar cell” Chem. Mater. 17, 2005, 4031-4033
[70] Krebs F C, Carle J E, Cruys-Bagger N, Anderson M, Lilliedal M R, Hammond M A and
Hvidt S, Sol. Eng Mater. Sol. Cells 86, 2005, 499
[71] Krebs F.C Spanggaard H Sol. Energy Mater. Sol. Cells 83 (2004) 125
[72] Shafarman, W.N., Stolt L., in: Luque A., and Hegedus S. (Eds.), Handbook of
Photovoltaic Science and Engineering, Wiley, New York, 2003.
[73] />pdf
[74] www.titk.de/en/home/home.htm
[75] Applied Physics Letters / Volume 97 / Issue 3, 2010 / NANOSCALE SCIENCE AND
DESIGN
4
Dilute Nitride GaAsN
and InGaAsN Layers Grown by
Low-Temperature Liquid-Phase Epitaxy
Malina Milanova
1
and Petko Vitanov
2
1
Central Laboratory of Applied Physics, BAS
2
Central Laboratory of New Energy & New Energy Sources, BAS
Bulgaria
1. Introduction
A critical goal for photovoltaic energy conversion is the development of high-efficiency, low
cost photovoltaic structures which can reach the thermodynamic limit of solar energy
conversion. New concepts aim to make better use of the solar spectrum than conventional
single-gap cells currently do. In multijunction solar cells based on III-V heterostructures,
better spectrum utilization is obtained by stacking several solar cells. These cells have
achieved the highest efficiency among all other solar cells and have the theoretical potential
to achieve efficiencies equivalent to or exceeding all other approaches. Record conversion
efficiencies of 40.7 % (King, 2008) and 41,1 (Guter at al., 2009) under concentrated light for
triple- junction allows hoping for practical realization of gianed values of efficiency in more
multiplejunction structures. The expectations will be met , if suitable novel materials for
intermediate cascades are found, and these materials are grown of an appropriate quality.
Models indicate that higher efficiency would be obtained for 4-junction cells where 1.0 eV
band gap cell is added in series to proven InGaP/GaAs/Ge triple-junction structures. Dilute
nitride alloys such as GaInAsN, GaAsSbN provide a powerful tool for engineering the band
gap and lattice constant of III-V alloys, due to their unique properties. They are promising
novel materials for 4- and 5-junction solar cells performance. They exhibit strong bowing
parameters and hold great potential to extend the wavelength further to the infrared part of
the spectrum.
The incorporation of small quantity of nitrogen into GaAs causes a dramatic reduction of the
band gap (Weyeres et al., 1992), but it also deteriorates the crystalline and optoelectronic
properties of the dilute nitride materials, including reduction of the photoluminescence
intensity and lifetime, reduction of electron mobility and increase in the background carrier
concentration. Technologically, the incorporation probability of nitrogen in GaAs is very
small and strongly depends on the growth conditions. GaAsN- based alloys and
heterostructures are primarily grown by metaloorganic vapor-phase epitaxy (MOVPE)
(Kurtz et all, 2000; Johnston et all, 2005)) and molecular-beam epitaxy (MBE) (Kurtz et al.
2002; Krispin et al, 2002; Khan et al, 2007), but the material quality has been inferior to that
of GaAs. A peak internal quantum efficiency of 70 % is obtained for the solar cells grown by
MOCVD (Kurtz et al. 1999). Internal quantum values near to unit are reported for p-i-n
Solar Cells – New Aspects and Solutions
70
GaInAsN cell grown by MBE (Ptak et al 2005), but photovoltages in this material are still
low. Recently chemical-beam epitaxy (Nishimura et al., 2007; Yamaguchi et al, 2008; Oshita
et al, 2011) has been developed in order to improve the quality of the grown layer, but today
it remains a challenge to grow dilute nitride materials with photovoltaic (PV) quality.
In this chapter we present some results on thick GaAsN and InGaAsN layers, grown by low-
temperature Liquid-Phase Epitaxy (LPE). In the literature there are only a few works on
dilute nitride GaAsN grown by LPE (Dhar et al., 2005; Milanova et al., 2009) and some data
for InGaAsN (Vitanov et al., 2010).
2. Heteroepitaxy nucleation and growth modes
The mechanism of nucleation and initial growth stage of heteroepitaxy dependence on
bonding between the layer and substrate across the interface. Since the heteroepitaxy
requires the nucleation of a new alloy on a foreign substrate the surface chemistry and
physics play important roles in determining the properties of heteroepitaxial growth. In the
classical theory, the mechanism of heterogeneous nucleation is determined by the surface
and interfacial free energies for the substrate and epitaxial crystal.
Three classical modes of initial growth introduced at first by Ernst Bauer in 1958 can be
distinguished: Layer by layer or Frank–Van der Merwe FM two-dimension mode (Frank–
Van der Merwe, 1949), Volmer–Weber VW 3D island mode (Volmer–Weber, 1926), and
Stranski–Krastanov SK or layer-plus-island mode (Stranski–Krastanov, 1938) as the
intermediate case. The layer by layer growth mode arises when dominates the interfacial
energy between substrate and epilayer material. In the opposite case, for the weak interfacial
energy when the deposit atoms are more strongly bound to each other than they are to the
substrate, the island (3D), or VW mode results. In the SK case, 3D island are formed on
several monolayers, grown in a layer-by-layer on a crystal substrate.
Schematically these growth modes are shown in the Figure 2.1.
substrate
substrate
FM
VW
SK
substrate
substratesubstrate
substrate
FM
VW
SK
substratesubstrate
Fig. 2.1. Schematic presentation of FM, VW and SK growth modes
Dilute Nitride GaAsN and InGaAsN Layers Grown by Low-Temperature Liquid-Phase Epitaxy
71
The growth modes in heteroepitaxy are defined based on thermodynamic models.
The sum of the film surface energy and the interface energy must be less than the surface
energy of the substrate in order for wetting to occur and then layer by layer growth is
expected. The VW growth mode is to be expected for a no wetting epitaxial layer. If γ and γ
0
are the surface free energies of the layer and substrate, respectively, and γ
i
is the interfacial
free energy the change in the free energy Δγ associated with covering the substrate with
epitaxial layer is:
Δγ = γ + γ
i
- γ
0
(2.1)
If minimum energy determinates the mode for nucleation and growth, the dominated
mechanism will be two-dimensional for Δγ <0 and three-dimensional for Δγ>0. However,
even in the case of a wetting epitaxial layer (Δγ <0 ), the existence of mismatch strain
can cause islanding after the growth of a few monolayers. This is because the strain
energy , increases linearly with the number of strained layers. At some thickness, γ+γi
exceeds γ
0
and the growth mode transforms from FM to SK resulting in 3D islands on the
2D wetting layer. Whereas it is clear that the VW growth mode is expected for a
nonwetting epitaxial layer, the behavior of a wetting deposit is more complex and
requires further consideration. Often the interfacial contribution in the limit of zero lattice
mismatch and weak chemical interactions between the film and substrate at the interface
can be neglected in comparison to the surface free energy (γi ≈ 0). In this case the growth
mode is determined entirely by the surface free energies of the film and substrate
material.
Instead of these three main growth modes additional growth modes and epitaxial growth
mechanisms could be distinguished (Scheel, 2003): columnar growth, step flow mode, step
bunching, and screw-island growth.
The structural quality of the layer and surface morphology strongly depend on the growth
method and the main growth parameters: supersaturation, misorientation of the substrate
and the difference of lattice constants between substrate and the epitaxial layer.
In the case of flat substrate, the supersaturation increases until surface nucleation of a new
monolayer occurs and its growth cover the substrate, followed by the nucleation of the next
monolayer. For compound of limited thermodynamic stability or with volatile constituents
like GaAs, GaN, SiC the appearance of the growth mode is largely predetermined by the
choice of the growth method due to the inherent high supersaturation in epitaxy from the
vapor phase and adjustable low supersaturation in LPE.
The FM growth mode in LPE can only be obtained at quasi-zero misfit as it is established
from thermodynamic theory (Van der Merwe, 1979) and demonstrated by atomistic
simulations using the Lennard–Jones potential (Grabow and Gilmer, 1988) and also at low
supersaturation. At high supersaturation a high thermodynamic driving force leads to a
high density of steps moving with large step velocities over the surface and causes step
bunching.
The VW mode is typical of VPE. Due to the high supersaturation a large number of surface
nuclei arise, which then spread and form three-dimensional islands, that finally coalesce to a
compact layer. Continued growth of a layer initiated by the VW mode often shows
columnar growth which is a common feature in epitaxy of GaN and diamond. (Hiramatsu et
al., 1991). The SK mode has been demonstrated by MBE growth of InAs onto GaAs substrate
(Nabetani et al., 1994).
Solar Cells – New Aspects and Solutions
72
Observations, analyses and measurements of LPE GaAs on the formation of nuclei and
surface terraces show that nuclei grow into well-defined prismatic hillocks bounded by only
{100} and {111} planes and they are unique to each substrate orientation, and hillocks tend to
coalesce into chains and then into parallel surface terraces (Mattes & Route, 1974). The
hillock boundaries may cause local strain fields and variation of the incorporation rates of
impurities and dopants, or the local strain may getter or rejects impurities during annealing
processes. This inhomogeneity may be suppressed by providing one single step source or by
using substrates of well-defined small misorientation. The FM growth mode and such
homogeneous layers can only be achieved by LPE or by VPE at very high growth
temperatures.
Only at low supersaturation, nearly zero misfit and small misorientation of the substrate the
layer by-layer growth mode can be realized and used to produce low dislocation layers for
ultimate device performance. Two-dimensional growth is desirable because of the need for
multilayered structures with flat interfaces and smooth surfaces. A notable exception is the
fabrication of quantum dot devices, which requires three-dimensional or SK growth of the
dots. Even here it is desirable for the other layers of the device to grow in a two-dimensional
mode. In all cases of heteroepitaxy, it is important to be able to control the nucleation and
growth mode.
3. Pseudomorphic and metamorphic growth
One of the main requirements for high quality heterostructure growth is the lattice constant
of the growth material to be nearly the same as those of the substrate. In semiconductor
alloys the lattice constant and band gap can be modified in a wide range. The lattice
parameter difference may vary from nearly 0 to several per cent as in the cases of GaAs-
AlAs and InAs-GaAs system, respectively. The growth of dilute nitride alloys is difficult
because of the wide immiscibility range, a large difference in the lattice constant value and
very small atom radius of N atoms. The growth of thick epitaxial layers creates many
problems which absent in the quantum-well structures.
At the initial stage of the growth when the epitaxial layer is of different lattice constant
than the substrate in-plane lattice parameter of the growth material will coherently strain
in order to match the atomic spacing of the substrate. The elastic energy of deformation
due to the misfit in lattice constant destroys the epilayer lattice. The substrate is
sufficiently thick and it remains unstrained by the growth of the epitaxial layer. If the film
is thin enough to remain coherent to the substrate, then in the plane parallel to the growth
surface, the thin film will adopt the in-plane lattice constant of the substrate, i.e.a
ll
= a
o ,
where a
ll
is the in-plane lattice constant of the layer and a
o
is
the lattice constant of the
substrate. This is the case of pseudomorphic growth, and the epitaxial layer is
pseudomorphic. If the lattice constant of the layer is larger than that of the substrate as in
the case of InGaAs on GaAs, under the pseudomorphic condition growth the lattice of the
layer will be elastically compressed in the two in-plane directions. The lattice constant of
the layer in the growth direction perpendicular to the interface (the so-called out-of plane
direction) will be strained according the Poison effect and will be larger than the
unstrained value and the layer lattice will tense in the growth direction. Schematically this
situation is illustrated in Figure 3.1.
Dilute Nitride GaAsN and InGaAsN Layers Grown by Low-Temperature Liquid-Phase Epitaxy
73
Fig. 3.1. Schematic presentation of atom arrangement for two materials with different cubic
lattice constant: a) before growth; b) for pseudomorphic growth
In the case of the smaller lattice constant of the growth layer (GaAsN on GaAs for example),
a<
a
o
the layer will be elastically tensed in two in-plane directions and compressed in the
growth directions (the out-of-plane lattice constant will be smaller than substrate lattice
constant). Under pseudomorphic growth conditions the cubic lattice doesn’t remain cubic:
a
ll
= a
o
≠ a
⊥
. The out -of-plane lattice constant could be determined from the equation:
a⊥
=
a[1- D(a
ll
/a -1)] (3.1)
Where:
a
⊥ - out-of-plane lattice constant of the layer
a
ll
-
in-plane
lattice constant of the layer
a
-
lattice constant of the unstrained cubic epitaxial layer
D = 2C
12
/C
11
, where C
11
and C
12
are elastic constants of the grown layer
Beyond a given critical thickness η
c
when a critical misfit strain ε is exceeded, a transition
from the elastically distorted to the plastically relaxed configuration occurs. In this case both
mismatch component differ from zero: a
ll
≠
a
o
≠ a⊥. The lattice constant misfit is:
f = (a
- a
o
)/a
o
f⊥
= (a⊥
- a
o
)/a
o
= (1+D-DR)f (3.2)
f
ll
= (a
ll
- a
o
)/a
o
= Rf
R is a relaxation rate. For pseudomorphic growth R=0, and for full strain relaxation R =1
If the epilayer is thicker than the critical thickness, there will be sufficient strain energy in
the layer to create dislocations to relieve the excess strain. The layer has now returned to its
unstrained or equilibrium lattice parameters in both the in-plane and out-of-plane directions
and the film to be 100% relaxed. Figure 3.2 shows schematically how a misfit dislocation can
relieve strain in the heteroepitaxial structure.
a
b
Solar Cells – New Aspects and Solutions
74
Fig. 3.2. Schematic presentation of the atom arrangement for metamorphic growth
In actual films, there is usually some amount of partial relaxation, although it can be very
small in nearly coherent layers and nearly 100% in totally relaxed layers. For the partially
relaxed layer, the in-plane lattice constant has not relaxed to its unstrained value. So some
mismatch is accommodated by elastic strain, but a portion of the mismatch is
accommodated by misfit dislocations (plastic strain).
There are two widely used models for calculations the critical thickness values: the
Matthews-Blakeslee mechanical equilibrium model (Matthews.& Blakeslee, 1974) and the
People-Bean energy equilibrium model (People & Bean, 1985). The People-Bean energy
equilibrium model requires the total energy being at its minimum under critical thickness.
According this model the elastic energy is equal to the dislocation energy at the critical
thickness if the total elastic energy of the system with fully coherent interface is larger than
the sum of the total system energy for the reduced misfit, due to the generation of
dislocations, and the associated dislocation energy, and then begins the formation of
interfacial dislocations.
Generally, the Matthews-Blakeslee model based on stemming from force balance, is the
most often used to describe strain relaxation in thin films system. The equilibrium model of
Matthews-Blakeslee assumes the presence of threading dislocations from the substrate. It
gives mathematical relation for critical thickness by examining the forces originating from
both the misfit strain F
ε
and the tension of dislocation line F
L
. The critical thickness h
c
is
defined as the thickness limit when the misfit strain force F
ε
is equal to the dislocation
tension force F
L
( at h
c
F
ε
= F
L
). For layers ticker than the critical thickness, the threading
segment begins to glide and creates misfit dislocations at the interface to relieve the
mismatch strain. The dislocations can easily move if dislocation lines and the Burgers
vectors belong to the easy glide planes as {111} planes in face-centred cubic crystals.
In III-V semiconductors, the relaxation is known to occur by the formation of misfit
dislocations and /or stacking faults. The usual misfit dislocations that are considered are
located along the intersection of the glide plane and the interface plane. In zinc-blende
crystal structures, on (100) oriented substrates the glide planes intersect the interface (110)
which provides the corresponding line directions of misfit dislocations in such structures.
The component of 60˚ dislocations perpendicular to the line directions contributes to strain
relaxation. The 60˚ Burgers vector is b= ½ a
l
110 and has a length along the interface
perpendicular to the line a /
2 .
Dilute Nitride GaAsN and InGaAsN Layers Grown by Low-Temperature Liquid-Phase Epitaxy
75
Calculated values for critical thickness from People-Bean energy equilibrium and Matthews-
Blakeslee force balance models are:
2
(1 )
ln( / )
32 (1 )
cc
b
hhb
f
(3.3)
[ln( / ) 1]
4(1)
cc
b
hhb
f
(3.4)
Where:
ν=C
12
/( C
12
+ C
11
) is Poison’s ratio,
f is a lattice mismatch, b= a / 2 is a magnitude of Burgers vector
The calculated values of People-Bean models are larger than that of the Matthews-Blakeslee
model. The measurements of dislocation densities in many cases showed no evidence of
misfit dislocations for layer considerable ticker than Matthews-Blakeslee limit and nearly
close to the energy-equilibrium thickness limit. Layers with thicknesses above the People-
Bean limit can be considered to be completely relaxed, whereas layers below Matthews-
Blakeslee limit values fully strained. Layers with thicknesses between these limits are
metastable. They could be free of dislocations after growth, but are susceptible to relaxation
during later high-temperature processing.
For the semiconductor devices based on the thick metamorphic structure the influence of the
misfit dislocations which are located at the interface on active region could be reduced by
growing the additional barrier layers before active region growth. Threading dislocations,
which propagate up through the structure, are the most trouble for electronic devices since
they can create defect states such as nonradiative centres and destroy the device properties.
There are a variety of techniques used to reduce the density of threading dislocations in a
material. For planar structure a thick buffer layer with lattice parameter equal to that of the
active layers is usually used for reduction of threading dislocations. However, these
structures always have high threading dislocation densities. In most thick nearly relaxed
heteroepitaxial layers, it is found that the threading dislocation density greatly exceeds that
of the substrate. Some authors (Sheldon et al.1988, Ayers et al. 1992) are noted for a number
of heteroepitaxial material systems that this dislocation density decreases approximately
with the inverse of the thickness. The dislocation density could be reduced by postgrowth
annealing.
A linearly graded buffers and graded superlattice also are effectively used for restricting
dislocations to the plane parallel to the growth surface, and thus support the formation of
misfit dislocation and suppress threading dislocation penetration in the active region.
3.1 X-ray diffraction characterization
The X-ray diffraction (XRD) method is an accurate nondestructive method for
characterization of epitaxial structures. X-ray scans may be used for determination the
lattice parameter, composition, mismatch and thicknesses of semiconductor alloys.
In XRD experiment a set of crystal lattice planes (hkl) is selected by the incident conditions
and the lattice spacing d
hkl
is determined through the well-known Brag’s law:
2dsinθ
B
= nλ (3.1.1)
Solar Cells – New Aspects and Solutions
76
where n is the order of reflection and θ
B
is the Brag angle
The crystal surface is the entrance and exit reference plane for the X-ray beams in Bragg
scattering geometry and the incident and diffracted beams make the same angle with the
lattice planes. Two types of rocking curve scan are used: symmetric when the Bragg
diffraction is from planes parallel to crystal surface and asymmetric when the diffraction
lattice planes are at angle φ to the crystal surface (Fig. 3.3).
θ
θ
ω
φ
θ
2 θ
ω
θ
θ
ω
φ
θ
θ
ω
φ
θ
2 θ
ω
θ
2 θ
ω
Fig. 3.3. Symmetric and asymmetric reflections from crystal surface
Let ω be the incidence angle with respect to the sample surface of a monochromatic X-ray
beam. By rocking a crystal through a selected angular range, centered on the Bragg angle of
a given set of lattice planes a diffraction intensity profile I(ω) is collected. For single layer
heterostructure, the intensity profile will show two main peaks corresponding to the
diffraction from the layer and substrate. The angular separation ∆ω of the peaks account for
the difference ∆d
hkl
between the layer and substrate lattice spacing. XRD do not directly
provide the strain value on the crystal lattice. Te measurable quantities being the lattice
mismatches ∆a
⊥
/a
o
and ∆a
ll
/a
o
, i. e f
⊥
and f
ll.
The relationship between lattice mismatch
components and misfit f with respect to substrate is:
f = f
⊥ (1-ν)/(1+ ν) + 2 ν f
ll
/ (1+ ν) (3.1.2)
where ν is the Poisson ratio
This is the basic equation for the strain and composition characterization of heterostructures
for cubic lattice materials. In the case of semiconductor alloys A
x
B
1-x
the composition x can
be obtained if the relationship between composition and lattice constant is known. Poisson
ratio is also composition depending and the use of Poisson ratio ν is only valid for isotropic
materials. For a cubic lattice, it can only be applied for high symmetric directions as (001),
(011), (111), but Poison ratio may be different along different directions (ν ≈ 1/3 for the most
semiconductors alloys).
XRD can easily be employed to measure the lattice parameter with respect the substrate
used as a reference. The strain and the composition of layer can be accurately determined if
the dependence of the lattice parameter with the composition is known, the accuracy being
mainly due to the precise knowledge of the lattice parameter –composition dependence.
In many cases a good approximation of a such dependence is given by Vegard law, which
assumes that in the alloy A
x
B
1-x
the lattice of the alloy is proportional to the stoichiometric
coefficient x:
a (x) = xa(A) + (1- x) a(B) (3.1.3)
From this equation the stoichiometric coefficient x is obtained:
Dilute Nitride GaAsN and InGaAsN Layers Grown by Low-Temperature Liquid-Phase Epitaxy
77
x = (a(x) - a(B))/ (a(A) - a(B)) (3.1.4)
If a(B) is the substrate lattice parameter, the composition x can be calculated from the
measurement misfit f(x) value:
x = f(x)/f(AB) (3.1.5)
Where:
f (x) is the measured misfit value with respect to a(B) and
f(AB) is the misfit between compound A and compound B, used as reference.
In the case of GaAs
1-x
N
x
and In
x
Ga
1-x
As
1-y
N
y
dilute nitride alloys relationship between lattice
parameters and composition assuming Vegard’s law are the foolowing:
a
GaAs1-xNx
= x a
GaN
+ (1- x) a
GaAs
(3.1.6)
a
InxGa1-xAs1-yNy
= x ya
InN
+ (1- x)y a
GaN
+ x(1- y) a
InAs
+ (1- x) (1- y) a
GaAs
(3.1.7)
The lattice parameter measurements method is one of the most accurate way to determine
the composition, provided that the composition versus lattice parameter dependence is
known. The comparison between composition values obtained from XRD and that,
determined by other analytical techniques has allowed to measure the deviation from the
linear Vegard’s law in alloys.
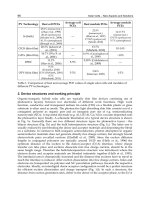
Table 1. presents the values of elastic constants and lattice parameters for GaAs, InAs, GaN,
InN binary compounds.
compound
GaAs InAs GaN InN
Parameter
C
11
, GPa
118.79
83.29
293
187
C
12
, GPa
53.76
45.26
159
125
a
0,
nm
0.5653
0.60584
0.4508
0.4979
Table 1. Elastic constants and lattice parameters for some III-V compounds
4. Low-temperature LPE growth
Low-temperature LPE is the most simple, low cost and safe method for high-quality III-V
based heterostructure growth. It remains the important growth technique for a wide part of
the new generations of optoelectronic devices, since the competing methods, MBE and
MOCVD, are complicated and expensive although they offer a considerable degree of
flexibility and growth controllability. The lowering the growth temperature for Al-Ga-As
system provides the minimal growth rate values of 1–10 Å/s, and they are comparable with
MBE and MOCVD growth values (Alferov et al, 1986). At the early stages of the process
two-dimensional layer growth occurs, which ensures structure planarity and makes it
possible to obtain multilayer quantum well (QW) structures (Andreev et al, 1996).
Solar Cells – New Aspects and Solutions
78
The results of study the crystallization process in the temperature range 650-400
o
C
demonstrate precise layer composition and thickness controllability for the low-temperature
LPE growth. A necessary requirements for successful devices fabrication is the optimal
doping of the structure layers at low temperatures. The experiments (Milanova and
Khvostikov, 2000) on doping using different type dopants covered large range of carrier
concentrations: from 10
16
to 10
19
cm
−3
for n Al
x
Ga
1−x
As layers (0<x<0.3); from 5×10
17
cm
−3
to
well above 10
19
cm
−3
for p Al
x
Ga
1−x
As (0<x<0.3); and from 10
16
to 10
18
cm
−3
for n- and p
Al
x
Ga
1−x
As (0.5<x<0.9) layers. High quality multilayer heterostructures containing layers as
thin as 2-20 nm, as well as several microns thick, with a smooth surface and flat interfaces
have been grown by low-temperature LPE. The lowest absolute threshold current of 1.3mA
(300 K) was obtained for buried laser diodes with a stripe width of ~ 1μm and cavity length
of 125μm (Alferov et al, 1990).
High-efficiency solar cells for unconcentrated (Milanova et al, 1999) and concentrated solar
cells (Andreev et al, 1999) have been fabricated by low-temperature LPE. The record
conversion efficiency under ultra-high (>1000) concentration ratio solar radiation heve been
achieved for GaAs single-junction solar cells based on multilayer AlGaAs/GaAs
heterostructures (Algora et al, 2001).
The success of the LPE method is strongly depend on the graphite boat design used for
epitaxy growth. The most widely used for LPE growth is a slide boat method. The
conventional simple slide boat consists of a boat body in which are formed containers for
liquid phase and a slider with one or more sits for the substrate (Fig. 4.1.). The slider moves
the substrates under and out of the growth melt. This boat design has some disadvantages:
the melt thicknesses is several millimeters and during growth from such semi-limited
liquid-phase a portion of dissolved materials can not reach the substrate surface and forms
stable seeds at a distance of 1 mm and more from the growth surface which deteriorate the
planarity of the grown layer.
Fig. 4.1. Conventional slide boat for LPE growth: 1, body boat; 2, slider, 3, substrate.
Another drawback is the arising the defects on the layer surface due to the mechanical
damage during its transfer from one melt to another. Also always on the surface of the melt
present oxides films and it is difficult to completely removed these films even by long high-
temperature baking. This is a critical problem for wetting of the substrate surface, especially
for epitaxial process in Al-Ga-As system. A piston growth technique has been developed for
LPE growth of AlGaAs heterostructures by Alferov at al (Alferov et al, 1975).
2
3
1
Dilute Nitride GaAsN and InGaAsN Layers Grown by Low-Temperature Liquid-Phase Epitaxy
79
Fig. 4.2. Piston boat for growth of multilayer AlGaAs/GaAs heterostructures: 1, growth
solution; 2, container for solution; 3, piston; 4, opening; 5, narrow slit; 6, substrate; 7, used
solution; 8, container for used solutions.
The substrate surface in this boat after the first wetting is always covered by a melt and this
solves difficulties of wetting during the growth of AlGaAs heterostructures in the range
600-400 °C. The piston boat design is shown in Figure 4.2. In this boat the melts of different
compositions are placed in containers which can move along the boat body. The liquid
phase falls down into the piston chamber and squeezes throw narrow slit into the substrate
which allows mechanical cleaning of oxides films from liquid phase and insures a good
wetting. The crystallization is carried out from the melt 0.5-1 mm thick. After the growth of
the layer liquid phase is removed from the substrate by squeezing of the next melt. The last
liquid phase is swept from the surface by shifting the substrate holder out side the growth
chamber.
The liquid phase can not remove completely from the surface structure and cause a poor
morphology of the last grown layer. The excess melt could be remove from the substrate by
using additional wash melt, which may either has a poor adhesion to the substrate or may
be relatively easy remove with post-growth cleaning and etching in selective etchants.
Authors (Mishurnyi at al, 2002) suggest an original method to complete remove the liquid
solution after epitaxy. The remained liquid phase is pulled up into the space between the
substrate and vertical plates made of the same materials as the substrate assembled very
closely to the substrate surface. This method is very useful for growth of multilayer
heterostructures not containing Al in modified slide boat because prevent mixing of any
liquids remaining. For the most multicomponent alloys such as InGaAsP, InGaAsSb,
InPAsSb etc., lattice constant is very sensitive to composition variation and the piston boat is
not suitable for their growth because of mixing of two deferent solutions. Slide boats with
different design are used for fabrication of complicated multilayer heterostructure on the
base of these multicomponent alloys. In order to improve the control of layer thicknesses
and uniformity it is necessary the growth to be carried out using a finite melt. In this boat
the liquid phase after saturations is transferred into the additional containers or growth
chamber with finite space for the liquid phase. Figure 4.3 shows a schematic slide boat for
epitaxy growth from finite melt.A critical requirement for the most multicomponent alloys,
instead of AlGaAs, AlGaP, is precise determination of the growth temperature. The
6 8 7 5
3
4
2 1
Solar Cells – New Aspects and Solutions
80
temperature at the interface between the liquid phase and substrate can not be measured
and common it is determined by measurements of the source component solubility
(Mishurnyi et al, 1999) .
Fig. 4.3. Slide boat for growth from finite melt: 1, boat body with container for melts;
2, slider with container for finite melts; 3, slider for the substrates.
Slide boats with different design modification are used for growth of variety structures in
different multicomponent system. A boat made of two different materials, sapphire (for
body) and graphite (for slider), is suggested by Reynolds and Tamargo (Reynolds and
Tamargo, 1984). This design reduces temperature variations around the perimeter of the
substrate which contribute to unwanted ‘edge’ growth effects. Slide boats with narrowed
melt contact for epitaxy of extremely thin epilayers have been used to grow active layer in
single-quantum well lasers by (Alferov et al, 1985 ) and later by (Kuphal, 1991). Also a
modified slide boat can be used for multilayer periodic structures growth (Arsent’ev et al,
1988). The use of two growth chambers with narrow slits makes it possible to produce such
structures by means of repeated reciprocating movements of the slider with the substrate
situated underneath these slits. Another variant of an LPE boat (Mishurnyi et la, 1997),
which is a combination of the ‘sliding’ and ‘piston’ designs has been used successfully to
grow InGaAsSb, AlGaAsSb and various multilayer structures on the basis of these materials.
5. Low-temperature LPE growth and characterization of dilute nitride GaAsN
and InGaAsN thick layers
Dilute nitride III-V-N alloys with nitrogen content in the range of few percent, such as
GaAsN and InGaAsN, are of considerable interest for application in multijunction solar
cells.
The incorporation of nitrogen into group V sublattice causes profound effect on the band
gap and properties of the dilute nitride material strongly differ from those of the
conventional III-V alloys. While in conventional alloys a smaller lattice constant increases
the band gap, the mixing of GaAs with few molar percent of GaN leads to giant reduction of
its band gap due to the smaller covalent radius and large electronegativity of N atoms. The
large changes in the electronic structure in dilute III–V nitrides could be explained by the
band anticrossing model (BAC). The interaction between the localized levels introduced by
a highly electronegative impurity, such as N in GaN
x
As
1−x
, and the delocalized states of the
host semiconductor causes a restructuring of the conduction band into E+ and E− subbands,
which in this case effectively lowers the conduction band edge of the alloy.
2
3
1
Dilute Nitride GaAsN and InGaAsN Layers Grown by Low-Temperature Liquid-Phase Epitaxy
81
Figure 5.1. shows the relationship between the lattice constant and band-gap energy in some
III-V semiconductor alloys. In the case of InGaNAs adding In to GaAs increases the lattice
constant, while adding N to GaAs decreases the lattice constant. In the same time the
incorporation of In and N in GaAs leads to reduction of the band gap energy in the new alloy.
Consequently, by adjusting the contents of In and N in quaternary InGaNAs alloys can be
grown lattice-matched to GaAs layers because In and N have opposing strain effects on the
lattice and make it possible to engineer a strain-free band gap layers suitable for different
applications.
0,45 0,50 0,55 0,60 0,65 0,70
0,0
0,5
1,0
1,5
2,0
2,5
3,0
3,5
GaAsN-
-InGaAsN
lattice matched
InAs
GaSb
GaAs
AlAs
InN
GaN
Energy band gap, eV
Lattice constant, nm
Fig. 5.1. Relationship between lattice constant and bad gap energy for some III-V
semiconductor alloys
Recently a development of the spectral splitting concentrator photovoltaic system based
on a Fresnel lens and diachronic filters has a great promise to reach super high conversion
efficiencies (Khvostiokov et al. 2010). Module efficiency nearly 50% is expected for
the system with three single-junction solar cells connected in series with band gap of
1.88-1.42-1.0 eV. The development of three optimized AlGaAs, GaAs and InGaAsN based
cells is the best combination for application in such system if PV quality of the quaternary
InGaAsN could be reached by LPE growth.
In this paper low-temperature LPE is proposed as a new growth method for dilute nitride
materials. Because of its simplicity and low cost many experiments on GaInAsN and GaAsN
growth under different condition and with different doping impurities could be made using
LPE. The systematic study of their structural, optical and electrical properties by various
methods make it possible to find optimized growth conditions for InGaAsN quaternary
compounds lattice matched to GaAs substrate.
5.1 Growth and characterization of GaAsN layers
GaAsN compounds were grown by the horizontal graphite slide boat technique for LPE on
(100) semi-insulating or n-type GaAs substrates. A flux of Pd-membrane purified hydrogen
at atmospheric pressure was used for experiments. No special baking of the system was
done before epitaxy. Starting materials for the solutions consisted of 99.9999 % pure Ga,
polycrystalline GaAs and GaN. The charged boat was heated at 750
o
C for 1 h in a purified
H
2
gas flow in order to dissolve the source materials and decrease the contaminants in the
Solar Cells – New Aspects and Solutions
82
melt. Epitaxial GaAsN layers 0.8-1.5 thick were grown from different initial temperatures
varied in the range 560-650 ºC at a cooling rate of 0.6 ºC/min.
5.1.1 Structural characterization
XRD and SIMS techniques are used to determine N concentration in grown samples.
While SIMS measures the total nitrogen content in the layer, XRD determines the change in
the lattice constant due to the substitution of nitrogen atoms on As-sublattice sites.
The N composition from XRD results could be estimated assuming Vegard’s law. In many
cases the Vegard’s law is a good approximation for the lattice parameter dependence on the
composition. The deviation from Vegard’s law dependences on many parameters, for
instance, the difference in the atom bond length, different atom electronegativity and elastic
constants of the components in the alloy. For the ideal case N incorporates predominantly as
substitutional N
As
atoms in As- sublattice substituting As atoms. However, it is known that
there are some other N configurations: N-As split interstitial; N-N split interstitial; and
isolated N interstitial. Figure 5.2 presents the main configurations of N in GaAsN as
substitutional atom N
As
and as As-N and N-N split interstitials, respectively.
The influence of these N-related complexes on the lattice constant can be calculated on the
base of the theoretical model of Chen (Chen et al. 1996) for analyzing the correlation
between lattice parameters and point defects in semiconductors. According this model the
lattice strain caused by the substitutional N
As
is given by the following relation:
()
2( )
NAs
Ga As
axrr
arr
(5.1.1)
where: r
N,
r
Ga,,
r
As
the covalent radii;
(1 ) / (1 )
, and ν is the Poissn ratio
The lattice strained caused by split interstitial is:
()
2( )
bGa As
Ga As
axdrr
arr
(5.1.2)
Where d
b
is the distance of the N-As complex from its nearest neighbours:
3
22
32
()
33
bsisiGasi
drrr r (5.1.3)
where r
si
=( r
N
+ r
As
)/2 is an effective bond radius.
Fig. 5.2. The main configurations of nitrogen atoms in GaAsN
N-atom, As-atom Ga-atom
N
N
As
N
N
As
Dilute Nitride GaAsN and InGaAsN Layers Grown by Low-Temperature Liquid-Phase Epitaxy
83
The effect of N-N interstitial is very small and can be neglected. Also the formation of an
isolated N interstitial is unlikely due to a high formation energy (Li et al. 2001) and their
concentrations in GaAsN is very small. While the substitutional N
As
atoms compress the
lattice constant , the N-As complexes expand the lattice constant of GaAsN in the growth
direction, as shown in Figure 5.3. So, XRD results may underestimated the N composition
due to the N-As and N-N split interstitials.
Fig. 5.3. Incorporation of N-atom in As-sublattice: a) as substitutional atom N
As
; b) as As-N
split interstitial
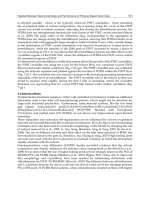
XRD rocking curves are recorded in the symmetrical (004) reflection. Fig. 5.4 shows the
experimental XRD rocking curves of two GaAsN samples, 1.2 μm thick, with N composition
of 0.3% and 0.62% and may consider that they are fuly relaxed. The N content determines
the line shape of the main peak of the spectra: it manifests itself as a broad shoulder
evolving into a weak separate peak shifted away to the right from the (004) GaAs substrate
reflection. Our data show that N compositions measured by the two methods, SIMS and
XRD, agree well and XRD measurements by using Vegard’s law could be used to determine
the lattice constant of GaAsN layers containing low N concentrations. These results are in a
good agreement with the calculations from the theoretical model and the experimental
results for small N concentration in the GaAsN reported in the literature.
The deviation from
Vegard’s law has been observed for nitrogen concentration levels above 2.9 mol % GaN in
the layer ( Spruytte at all., 2001; Li et al. 2001).
33,1 33,2 33,3 33,4 33,5 33,6
100
1000
10000
0.62% N
0.3% N
Intensity
Omega, degree
33,1 33,2 33,3 33,4 33,5 33,6
100
1000
10000
0.62% N
0.3% N
Intensity
Omega, degree
Fig. 5.4. XRD rocking curves for GaAsN samples with differenrt N content.
b
a
Solar Cells – New Aspects and Solutions
84
Unlike XRD used for assessing the incorporation of nitrogen in GaAs
1-x
N
x
alloys grown by
LPE the nitrogen bonding configurations and local atomic structures have been studied
using x-ray photoelectron spectroscopy (XPS) and Fourier transform infrared (FTIR)
spectroscopy. The XPS spectra have been measured over a range of binding energies from 1
to 550 eV. The X-ray photoelectron spectra of N 1s photoelectron and Ga LMM Auger lines
recorded from the as grown GaAs
1-x
N
x
samples prepared in different temperature ranges
are shown in Fig 5.5. It is clearly seen the Ga Auger peak around 391 eV and the N 1s level
photoemission peak of the samples. The variation of the intensity of the N 1s peak with
respect to the Ga LMM peaks reflects is due to the different nitrogen content of the samples.
Sample grown from higher initial epitaxy temperature of 650 ºC contains 0.2% N and
exhibits a N 1s peak with lower intensity and lower binding energy in comparison with the
N 1s peak intensity of the sample grown in the lower temperature range (600-570 ºC) with
0.5% N content. It has been established that lower epitaxy temperatures favours nitrogen
incorporation in the layers. The N 1s spectra of the samples indicate that nitrogen atoms
exist in a single-bonded configuration, the Ga-N bond, and interstitial nitrogen complexes is
not observed, in contrast to data of high nitrogen content GaAsN samples where the
additional nitrogen complex associated peak is recorded (Spruytte at all., 2001).
388 390 392 394 396 398 400 402 404 406388 390 392 394 396 398 400 402 404 406
0.2% N
397.6
393.1
397.3
XPS Intensity, arb.units
bonding energy, eV
0.5% N
397.6
393.1
397.3
XPS Intensity, arb.units
bonding energy, eV
Fig. 5.5. XPS spectra of two GaAsN samples with different N content.
420 430 440 450 460 470 480 490 500 510
Wavenumber, cm
-1
Absorbance, arb. units
Fig. 5.6. FTIR spectrum of as grown GaAsN sample.
Dilute Nitride GaAsN and InGaAsN Layers Grown by Low-Temperature Liquid-Phase Epitaxy
85
FTIR absorption spectra of an as grown GaAs
1-x
N
x
layer on a n-GaAs substrate is plotted in
Fig. 5.6. A peak at 472.6 cm
-1
, attributed to a local vibrational mode of nitrogen at arsenic site
in GaAs is clearly seen.
5.1.2 Electrical characterization
Electrical parameters of undoped GaAs and GaAsN layers with different nitrogen content
grown on seminsulating (001) GaAs substrates are measured in the temperature range
80 – 300 K using van der Pauw geometry.
Figure 5.7. shows the temperature dependence of the Hall-concentration n
H
on reciprocal
temperature for two layers GaAsN with nitrogen concentration of 0.2% and 0.5%,
respectively in comparison with undoped GaAs. It is seen that all samples are of n-type and
for layers containing nitrogen electron concentration increases about one order of
magnitude. This could be explained by the assumption that nitrogen behaves mainly as an
isoelectronic donor, which arises from the local heterojunction scheme GaAs-GaN according
to Belliache (Bellaiche et al., 1997). The results shown in figure indicate that the free carrier
concentration increases strongly with the N concentration. The increase in n
H
has also been
observed in GaN
x
As
1−x
doped with S (Yu et al., 2000a) and in Ga
1−3x
In
3x
NxAs
1−x
alloys
doped with Se (Skierbiszewski at al., 2000). This large increase of the free electron
concentration can be quantitatively explained by a combination of the band anticrossing
model (Shan et al, 1999) and the amphoteric defect model (Walukiewicz, 1989). The later
suggests that the maximum free carrier concentration in a semiconductor is determined by
the Fermi energy with respect to the Fermi-level stabilization energy E
FS
which is a constant
for III-V semiconductors. Since the position of the valence band in GaAsN is independent of
N concentration, the giant downward shift of the conduction band edge toward E
FS
and the
enhancement of the density of states effective mass in GaAsN lead to much larger
concentration of uncompensated, electrically active donors for the same location of the
Fermi energy relative to E
FS
. In order to explain the large enhancement of the doping limits
in dilute nitride alloys both the effects of band gap reduction and the increase in the
effective mass have to be taken into account (Yu et al., 2000 b; Skierbiszewski at al., 2000).
Fig. 5.7. Free carrier concentration as a function of inverse temperature for as grown GaAs,
and two GaAsN layers with different N content
2 4 6 8 10 12 14
10
17
10
18
0% N
0.2% N
0.5% N
Hall concentrations, cm
-3
1000/T, K
-1