Solar Cells Thin Film Technologies Part 10 docx
Bạn đang xem bản rút gọn của tài liệu. Xem và tải ngay bản đầy đủ của tài liệu tại đây (2.09 MB, 30 trang )
Innovative Elastic Thin-Film Solar Cell Structures
259
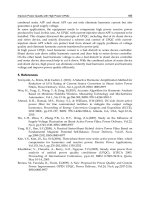
Fig. 6. SEM picture and the diagram of CdS wurtzite grains with vertical growth orientation
and CdS hexagonal grain model.
to achieving of this structure under some technology circumstances [17] and may be
matched with crystal constant differences not higher than 9,7% [18]. Structure of model CdS
layer, obtained by authors, organized in wurtzite phase is presented in Figure 6.
The most popular manufacturing technologies of CdS/CdTe solar cells are nowadays CVD
(Chemical Vapour Deposition) and the variants like PECVD (ang: Plasma Enhanced CVD, or
MOCVD ( Metall Organic Chemical Vapour Deposition) [19],CBD (Chemical Bath Deposition) and
physical methods like PVD (Physical Vapour Deposition), CSS (Close Space Sublimation) [20], and
variants of CSVT (Close Space Vapour Transport) [21, 22]. Alternatively screen-printing
technology was also successfully employed for production of relatively thick CdTe base [23].
Morphology of the last mentioned layers was verified by authors with the help of SEM
analysis indicating dense compact structure of hexagonal grains (Figure 7).
Fig. 7. SEM picture of dense, compact CdTe grain layer up to 8µm, manufactured by ICSVT
technology on glass substrate.
As the additional experiments AFM profile of this layer, presented in Figure 8 was
prepared.
Solar Cells – Thin-Film Technologies
260
Fig. 8. AFM profiling of CdTe polycrystalline layer, made by ICSVT technology.
This measurement gives some important information about grains structure and inter-
crystal surfaces. By means of polycrystalline CdS/CdTe layers profiling one may easily
detect the diameter and grain shape but also the inter-grain valleys depth and possible
structure fluctuations and layer discontinuities. These structure disorders may result in
serious parameter losses by producing of shunt interconnections or other charge flow
parasitic effects. Taking into account cadmium dichloride dissolvent presence, frequently
caused by recrystallization demands morphology defects may cause a real and serious
threat for CdS/CdTe structure functioning. No such phenomenon was confirmed by
presented results.
All new production techniques of thin –film polycrystalline solar cells and particularly
CdS/CdTe structure, designed for new application field, should be verified according to
obtained layers profile to eliminate structure disorder. Since AFM spectroscopy gives the
profiling results for some strictly limited area for wider statistical examination mechanical
profiling of high accuracy may be applied. These experiments were also conducted for test
CdS/CdTe structure. The experiment for each sample was conducted by the help of
mechanical profilometer Dektak 3 VEECO Instruments. The measurements were performed
for representative 100 µm scan range with 50nm resolution.
As the first analysis ICSVT CdTe layer morphology was checked (Figure 9). By this
investigation the average grain diameter of 6-8µm was confirmed and the typical roughness
of 1200 A. Series of measurements confirmed dense, compact structure of absorber grains
with no interlayer shunts. Obtained average roughness and the CdTe grain surface profile
suggests that inter-grain trenches are insufficient for significant degradation of shunt
resistance value. The total layer level fluctuations are smaller than 4 µm, which taking into
consideration typical glass thickness accuracy confirms homogenous thickness of the whole
base layer.
Alternative technology, used for CdS/CdTe cell layers deposition is a standard PVD
method. Under some circumstances it offers a possibility of semiconductor material
deposition even on profiled, elastic and untypical substrates. Evaporation of examined
materials caused serious technology problems connected with proper thickness of obtained
layers and homogeneous structure of deposited material. Some serious parasitic effect like
boiling, splitting and granulation of the material were solved by proper temperature profile
and optimized one-directional tantalum evaporation source adopted by authors [24].
Innovative Elastic Thin-Film Solar Cell Structures
261
Fig. 9. Morphology of CdTe solar cell base absorber manufactured by ICSVT technology on
glass substrate.
The investigation of CdTe base manufactured by evaporation and subsequent
recrystallization is presented in Figure 10.
Fig. 10. Morphology of CdTe solar cell base absorber manufactured by evaporation and
subsequent high-temp. recrystallization.
Solar Cells – Thin-Film Technologies
262
The measurements indicated homogenous grains of the average dimension 2-4µm. Typical
roughness of 1230 µm is similar layers obtained by ICSVT, however one may observe higher
peak values of grain top-trench profile. This may result in some interlayer parasitic
connections. Additionally in this case, total layer thickness fluctuation is similar to the layer
thickness (±2 µm), what may cause some absorber discontinuities.
Third investigated technology (Figure 11) is based on adaptation of screen-printing
technique for semiconductor layers manufacturing. Printing paste is produced by milling of
cadmium and tellurium in stochiometric proportion and mixing with special binder. After
printing, leveling and drying process CdTe layer is recrystallized in high-temperature
process similarly to the previously described way.
Fig. 11. Morphology of CdTe solar cell base absorber manufactured by screen-printing and
subsequent high-temp. recrystalization.
Profilometry of screen-printed base (Figure 11) indicated very high thickness of investigated
layer (even up to 20 µm), but also serious morphology defects. Typical roughness of
obtained layers is beyond 3000µm, which exceeds 240% of average value for ICSVT and
PVD techniques. Moreover obtained grains present different diameters from 1-2 µm up to
10 µm. Total layer thickness also varies strongly (locally up to 50%), which results in various
optoelectronic parameters. Layers produced by screen-printing technology presents
additionally high porosity, which prevents cadmium dichloride from volatilization and
causes fast base oxidation and thus cell parameters degradation.
Considering the results obtained for three technologies aimed at manufacturing of
CdS/CdTe solar structure on novel substrate material conclusion of their applicability and
further development may be drawn.
ICSVT being the most complicated and so-far not commercialized method appeared to be
the most efficient in creation of the proper polycrystalline base structure. The morphology of
obtained layers confirms proper column grain structure of hexagonal CdTe crystals and thus
high electrical parameters of final solar cell. Taking this into consideration further
Innovative Elastic Thin-Film Solar Cell Structures
263
development of this technique is desired in terms of non-flat architectonic elements as the
solar cell substrate. First steps towards this goal have been undertaken.
Evaporation and post annealing of CdTe material in order to formation of proper base
structure appeared to be less efficient. However simple and effective for various substrates
technique leads to thin film base production only. Moreover the diameters of single grains
obtained by the author are significantly lower than by ICSVT technology.
Screen – printing and sintering as the last investigated method appeared to be insufficient
for the stabile cell-base production. The advantage of high layer thickness is seriously
diminished by poor homogeneity, thickness instability and high surface porosity.
Nevertheless screen printed layers can be effectively used as the in-production material for
ICSVT or similar processes.
3. Innovative polycrystalline elastic structures, based on polymer substrates
Although CdS/CdTe cells have now entered the mass - production phase, but still there are
many possibilities of their new applications fields. Basing on this idea, authors proposed the
implementation of modified CdS/CdTe cell structure in universal, attractive application called
BIPV (Building Integrated Photovoltaics) and also elaborated elastic cell structure [25]. The
CdTe cell construction gives the opportunity of achieving these goals, under the conditions of
the proper technology modifications, as well as proper substrate and contacts implementation.
Due to successful application of CSS variants of CdS/CdTe manufacturing technology for
effective solar cells production, further experiments towards new cell structure and properties
became possible. Considering cell composition, two opposite configuration of CdTe cell
became possible. Historically first one is a classical substrate configuration (Figure 12 a),
whereas based on glass + ITO, emitter-based configuration is called superstrate (Figure 12 b).
Fig. 12. Substrate a) and superstrate b) configuration of CdS/CdTe solar cell. A- glass cover,
B- CdS emitter, C-CdTe base, D – base P+ sub layer, E-back contact, F-TCO layer, emitter
metal contacts not visible.
Both of them possess some important advantages and technology drawbacks. Substrate
configuration offers more mature manufacturing technology and lower substrate demands,
while superstrate configuration ensures higher efficiencies (smaller surface shadowing) and
better encapsulation. Adaptation of the described technology for new application and cell
construction, demands deep consideration of all possible solutions.
a)
b
A
B
C
D
E
A
F
B
C
D
E
Solar Cells – Thin-Film Technologies
264
Every introduced concept posses some value according to different aspects of BIPV
applications and each is subsequently investigated by Technical University of Łódz research
group. Ceramic substrates could be recognized as the best platform for the complete
integration of the photovoltaic element with the architectonic component. One may find the
reports on practical investigation of this construction for other thin –film solar cells e.g. CIS
devices [26]. However, for CdS/CdTe construction, there is still research and technology
adaptation needed. Additionally this kind of application is strictly connected with one
particular architectonic element type such as roof-tile or brick. Moreover it has to provide
the complete modular interconnection and regulation system, since the whole installation is
made of hundreds of elements, working in different conditions. Furthermore, different
interconnection systems (series, parallel and series-parallel) are necessary for optimum
power and load polarization. Finally, standard ICSVT/CSS technology needs some
fundamental modifications, in case of implementation in profiled architectonic elements
(roof tiles or ornaments), since the material transport occurs only between very closely
positioned source and target.
Taking into account cadmium telluride solar cells, possessing flexible construction two base
materials may be considered. One is thin metal foil, while the second is the polymer
material. Implementation of metal foils, for example Mo substrates, for CdTe construction
has been already investigated and reported [27]. In this work we focus on polymer foil
implementation as the elastic solar cell substrate. Flexibility of this material, combined with
policrystalline thin-film structure properties, gives a promise that manufacturing of elastic
solar panel, ready for integration with any shape architectonic substrate is possible.
Moreover, it offers the opportunity of constructing both substrate and superstrate
configuration of CdS/CdTe cell. Additionally, polymer foils are lightweight, high-durable
materials, which enhances the possible application field of cells. Depending on the
configuration, production technology and desired application different properties of the
substrate foils will be demanded. Finding proper foil material and appropriate technology
adaptation are the key to obtain efficient elastic PV cells.
To define the properties of polymer base foils, one may consider the specific of each
configuration. So far, in the superstrate configuration highest conversion efficiencies were
obtained However, in this case, polymer substrates must meet several conditions. One can
mention as the most important: high optical transparency in the full conversion range of
CdS/CdTe cell, ability of TCO surface electrode covering, high thermal durability, high
chemical and water resistance. Apart from these specific demands, substrate foil of any
configuration is expected to be light-weight, have high elongation coefficient, thermal
expansion similar to semiconductor polycrystalline layers (CdS and CdTe) and be low
cost. In both cases elastic cells can be easily attached to different shape architectonic
elements.
Taking this into account, also substrate configuration of elastic cadmium telluride cell was
investigated. As the preliminary step possible polymer material options were verified.
Polymers, as the materials, are constructed on a base of multi-modular chains of single,
repetitive units called monomers. In the manmade polymers, even the number of a few
thousand monomer types is being achieved. The properties of manufactured polymer
material depend strongly, not only on its chemical content and even monomer construction,
but also on the monomers interconnecting system. Due to complexity of the typical polymer
construction, it is impossible to evaluate the physical properties of these materials using
theoretical analysis. This gave the prompt to the series of experiments, aimed at
Innovative Elastic Thin-Film Solar Cell Structures
265
comprehensive evaluation of polymer foils physical parameters, potentially efficient as the
CdS/CdTe cell substrate materials.
As the test group of polymer foils wide set of materials, including standard commercial
solutions as well as high – temperature polyester and polyamide, was accepted. Among
polyamide foils of high thermal durability, two materials - KAPTON® and UPILEX® foils
were chosen. Both of them are commercially available high-technology materials
implemented in specific applications (eg: space shuttles wings and nose cover, high power
loudspeakers membranes). They are characterized by high mechanical and thermal
durability, high dielectric constant and UV durability. Among the polyester materials high
– temperature MYLAR® material was adopted. As the reference material, popular PET foil
in standard and high - temperature production version was applied. First evaluation step of
material properties is a verification of their mechanical parameters. Comparison of these
results is presented in Table 2.
Parameter\Foil
PET/High
temp PET
UPILEX® MYLAR®
KAPTON® HN
100
Thickness
[μm]
25.0 30.0 30.0 25.4
Weight
[g/m
2
]
30.0
44.1 41.7 35.0
Surface mass coefficient
[m
2
/kg]
31.2 22.7 23.98 27.9
Thermal expansion
[%/ 1
o
C]
0.025 0.018 0.007 0.005
Standard elongation
(25
o
C) [%]
600.0 54.0 103.5 40.0
Table 2. Main mechanical parameters of tested polymer foils.
Obtained parameters suggest similar properties of all investigated materials. However,
some important differences are evident. The most important is the value of the thermal
expansion coefficient (TEC). In general, one may say that in the case of high-temperature
materials the value of thermal expansion is lower. Exceptionally, in the case of UPILEX® the
value of this parameter is close to standard PET foil. According to considered configuration,
thermal expansion coefficient of substrate foil should be adjusted to the value of the
semiconductor base or emitter and contact layer. In both cases of semiconductor materials
(CdS, CdTe), the value of TEC is very low (at the level of 5·10
-4
[% / 1ºC]), but the most
typical metal contacts present TEC value higher by the order of magnitude.
The critical parameter in the standard re-crystallization process, as well as in the ICSVT, is a
thermal durability of layer material. The maximum values of declared operational
temperature for each investigated foil are: 130ºC for Standard PET, 185ºC for High-temp
PET, 254ºC for Polyester MYLAR®, 380ºC and 430ºC for Polyamide KAPTON® foil. Basing
on the declared temperatures and considering the ICSVT temperature demands, two most
durable foils were accepted for further investigations. As the subsequent step the weight
loss of KAPTON® and UPILEX® in higher temperatures was measured. The measurements
of thermal durability were performed in the temperature range of a standard re-
Solar Cells – Thin-Film Technologies
266
crystallization process (450ºC - 650ºC). During the experiment, the percentage loss of the foil
weight was measured. Additionally, plastic properties were tested as the indicator of
usefulness for the elastic substrate application. For higher accuracy of obtained outcomes, as
the additional test, the plastic properties of the materials for each temperature were
estimated. Complete results of this test are presented in Table 3. Grey color of the table cell
marks a permanent deformation or loss of elastic properties.
Weight in temperature:
UPILEX® KAPTON®
12.5µm 25.0µm 12.5µm 25.0µm
480ºC
91.82% 95.16% 96.70% 95.30%
500ºC
91.36% 94.84% 96.00% 94.60%
550ºC
89.55% 92.26% 74.70% 81.12%
600ºC
70.00% 78.38% Burnt Burnt
Table 3. Temperature durability of examined foils. Dark-grey color indicates the loss of
elastic properties or permanent deformation.
Analyzing obtained results, one may state that in the opposite to the manufacturer
suggestions, the biggest weight loss in temperatures above 500ºC, is observed in polyamide
KAPTON®. Additionally, the loss of its elastic parameters occurs very rapidly. Contrary,
UPILEX®, which melting point is declared below 400ºC proved to be fairly resistant to
temperatures until 550ºC. In both cases thicker foils reacted slower for the temperature rise,
which was expected due to their relatively high thermal resistance. It is worth mentioning
that the experiment was conducted in conditions (time, equipment) similar to the
manufacturing process. However, identified maximal allowable temperature is relatively
lower than standard demanded temperature for ICSVT process. There were reasonable
presumptions suggesting the possibility of re-crystallization temperature decreasing, in
favor of longer process duration. Thus, examined foils were conditionally positively
evaluated. Taking this into account, UPILEX® foil was accepted for further experiments,
leading to manufacturing of the CdS/CdTe elastic layers. Considering possible
configuration of designed cell, the light transparency characteristic of investigated foil was
measured. The light transmission in the conversion range of CdS/CdTe cell both of
KAPTON® and UPILEX® foils is presented in Figure 13.
Due to low transmission (below 60%) in the range 400 nm – 700 nm, which would decrease
largely the total cell efficiency, for UPILEX®, substrate cell configuration was chosen. Basing
on presented results, experimental sample of CdTe absorber, manufactured on 25 μm
UPILEX® foil was prepared. Obtained semiconductor layer is based on Cu contact of 2 µm
thick, made by PVD in pressure 5·105 Torr. The total area of the sample is 30 cm
2
and elastic
properties of all manufactured layers are preserved (Figure 14). After the investigation, the
average thickness of 2 µm and good uniformity of manufactured layer was confirmed. This
makes proper base for CdS layer manufacturing and completing of the elastic CdS/CdTe
construction.
Obtained results confirm the assumption that flexibility of polycrystalline cadmium
compound layers may be employed in alternative applications, such as elastic cell structure.
Finding the proper material for substrate of these devices is a key to manufacturing of
efficient cell, however it demands considering of many technological aspects. Thermal and
Innovative Elastic Thin-Film Solar Cell Structures
267
0
10
20
30
40
50
60
70
80
90
100
110
400 450 500 550 600 650 700 750 800 850
Transmission [%]
Wavelenght [nm]
UPILEX
Fig. 13. Optical transparency of KAPTON® and UPILEX® foils in the wavelength range of
CdS/CdTe cell effective photoconversion.
Fig. 14. Test structure of elastic CdTe layer based on UPILEX® foil and contacted by 2 μm
Cu layer.
mechanical properties of some high-temperature polymer foils give the possibility to
construct complete solar cell with some technological modifications (particularly during the
re-crystallization process). Another important factor is a proper, flexible and durable
contacting system of such cell.
Solar Cells – Thin-Film Technologies
268
4. Novel carbon nanotube contacts for proposed devices
An essential challenge in the development of flexible photovoltaic structures, excepting the
elaboration of an appropriate semiconductor junction and optical properties of active layers,
is providing suitable contacts. PV electrodes are required to be reliable, efficient, low cost
and compatible with solar cell structure. An extremely frequently used solution is applying
flexible transparent conductive oxides (TCO) as PV cell front (generally emitter) layer
electrodes. As it was mentioned before emitter contacts are usually realized by using
conductive transparent metal oxides, such as: SnO
2
, ITO, Zn
2
O
4
, CdSnO
4
, In
2
O
3,
ZnO:Al, as
well as CdO, ZnO and RuSiO
4
. In order to integrate solar cells into PV modules or for more
convenient measurements execution, additional metal contacts attached to TCO are applied.
The most popular among listed TCO compounds is indium tin oxide (ITO).
ITO is a mixture of tin (IV) oxide: SnO
2
and indium (III) oxide: In
2
O
3
so called ITO. This
material is characterized by high optical transmission of above 90% in visual range and
relatively low electrical resistivity of 10 Ω/square ÷ 100 Ω/square for thickness of
150 nm ÷ 200 nm. Unfortunately, applying ITO and other TCO layers in flexible
photovoltaics encountered a significant barrier. Those metal oxides indicate a lack
mechanical stress resistance which leads to breaking and crushing of the contact. This
disadvantageous characteristic was observed and reported also during the research on
flexible diode display electrodes. Furthermore, thin ITO layers are predominantly
manufactured by cost-consuming magnetron sputtering method [28], which increases the
final cost of new PV cell and module. Moreover, the indium resources are strictly limited
and expected to be exhausted within next fifteen years of exploitation.
A novel method of creating flexible transparent contacts for solar cells is to use carbon
nanotubes (CNT). Due to the broad range of potential manufacturing techniques and
diversified properties of obtained layers, carbon nanotubes are becoming increasingly
popular in electronic applications. Especially CNT layers obtained using low-cost
technologies such as screen printing or sputtering are potentially useful in flexible electronic
devices [30] and smart textiles. This subsection presents the summary of experiments which
were conducted up to now and led to adaptation of carbon nanotubes as thin transparent
contacts of selected flexible photovoltaic structures.
To create CNT based transparent conductive layer (TCL), preparation of particular
composite is necessary. Since there is a requirement of low cost material, multilayer carbon
nanotubes, synthesized in catalytic chemical vapor deposition (CCVD), were used in tested
compounds. CCVD process has a drawback which causes that not perfectly pure CNT
material is obtained. Although, the material contains significant amount of non CNT carbon
structures and metal catalyst, either purification or alternative fabrication methods, can
increase costs up to a few orders of magnitude. The average dimensions of nanotubes in the
material (determined by Scanning Electron Microscopy - SEM) are 10÷40 nm in diameter
and 0.5÷5 μm length, however longer structures have also been observed. Figure 15 presents
HRSEM image of applied CNTs.
Carbon nanotube composites are printed on given substrates using, low cost screen printing
technique. To specify a relationship between the content of CNT in the composition and the
value of sheet resistance, electrical properties of printed layers was measured. Table 4
presents achieved results. All samples showed electrical conductivity and were much above
the percolation threshold [11].
Innovative Elastic Thin-Film Solar Cell Structures
269
Fig. 15. HRSEM image of applied carbon nanotubes
Paste No CNT content in the composition [%] Sheet resistance [Ω/square]
CNT.0.1 0.10 613 k
CNT.0.25 0.25 28 k
CNT.0.5 0.50 3.3 k
CNT.1.0 1.00 870
Table 4. Sheet resistance values for samples with different CNT amount [11].
Transparent conductive layers were prepared using four composites with various CNT
content (Table 1). As a substrate borosilicate glass was used. In order to compare CNT and
ITO layer parameters, an identical Bo Si glass sample, covered by 160 nm sputtered ITO,
was taken. As a first step of carbon nanotubes TCL application in solar cell structure,
transmittance of printed layers have been measured (Figure 16).
Fig. 16. Transmittance comparison of 0,25%, 1,5 µm CNT layer and 160 nm ITO on
borosilicate glass, for standard solar cell absorption spectrum
Solar Cells – Thin-Film Technologies
270
A very important characteristic for printed CNT layers, is stability of the resistance while
applying multiple mechanical stress. To verify this parameter for manufactured CNT layers,
additional experiment was undertaken. TCL of 1.5 μm thick was screen printed on
polyamide Kapton® and tested by rapid mechanical bending in 80 cycles. The results of
resistivity change (Figure 17a) was compared with literature outcomes, obtained for optical
ITO layer (Figure 17b).
Fig. 17. Resistance changes of: a) CNT and b) ITO layers while bending [31]
After a positive estimation of CNT layers optical and electrical parameters, the possibility of
implementation as a solar cell transparent conductive coating was verified. For creating
models of screen printed CNT layer, as TCO replacement, in different PV cell structures,
SCAPS simulator was used. Simulation models are generated by digital description of
physical parameters of each structure layer, including contacts. Solar Cell Capacitance
Simulator (SCAPS) is available free of charge for scientific research. Figure 18 shows I-V
curves simulations, for CdTe/CdS solar cell structure with ITO and CNT contact layer.
Operating parameters of simulated cells are presented in Table 4.
a)
b)
Innovative Elastic Thin-Film Solar Cell Structures
271
Fig. 18. SCAPS simulations of I-V characteristics of CdTe/CdS solar cell with filters: red-
none, blue-ITO, green-CNT.
Filter
Open circuit voltage
V
OC
[V]
Short circuit current
J
SC
[mA/cm
2
]
Fill Factor
FF [%]
Efficiency
η [%]
none 0.754 21.602 44.99 7.33
ITO 0.743 17.194 47.00 6.00
CNT 0.733 14.236 48.50 5.06
Table 5. Electrical parameters of CdTe/CdS solar cell
5. Conclusions
Carbon nanotube layers with relatively high optical transmittance were fabricated by
inexpensive screen printing technique on glass and on elastic polymer substrates as well.
The average difference of 10% in transmittance within standard CdTe cell photoconversion
range between 160 nm ITO and 1.5 µm 0.25% CNT layer was observed. Sheet resistance of
obtained layers are at relatively high level and should be diminished for efficient
photovoltaic applications. To achieve this goal special technology and material compositions
(including various CNT content) are tested. The resistance of CNT layers, in opposite to
standard ITO, turned out completely independent on bending, which is critical in terms of
flexible solar cells construction. According to SCAPS simulations the lowest P
m
drop, caused
by CNT layer implementation, was observed in case of thin-film cells, which is consistent
with postulate of new construction flexibility. Preliminary practical experiments confirmed
the presence of photovoltaic effect in solar cell equipped exclusively with CNT emitter
electrode.
Presently, due to weaker optical and electrical parameters those layers cannot be a
competitive alternative to the existing transparent conductive layers. Nevertheless, they
Solar Cells – Thin-Film Technologies
272
have much better elastic properties and high prospects for improving the optical and
electrical parameters, and therefore they can be potential solar cells layers. Further
experiments are planned for development of manufactured structure (including
incorporation of main metal contacts) and manufacturing of thin-film cells with carbon
nanotube emitter contacts. However, CNT composites obtain higher optical permeability
at a lower carbon nanotubes content, which in turn, increases the resistivity of these
materials. Thus, the simultaneous increasing of the permeability and reducing the
resistivity is a difficult issue.
Flexible solar cells, based on thin film heterostructure are expected to be a natural
development of currently produced devices. For elaboration of fully functional photovoltaic
structure, ready for industrial production, many technological problems must be solved.
Presented work is a small part of impact put in this process. It is highly probable that some
of presented concepts will soon find the implementation in the commercially available
elastic cells, based on II-VI compounds.
6. References
[1] K. Zweibel “Thin Films: Past, Present, Future” Progress in Photovoltaics, Special Issue on
Thin Films, NREL 1995.
[2] O. Mah “Fundamentals of photovoltaic materials” National Solar Power Research
Institute 1998 pp 1-10.
[3] A. Hepp et al. “Ultra-Lightweight Hybrid Thin-Film Solar cells: A survey of Enabling
Technologies for Space Power Applications” Proc. 5
th
International Energy
Conversion Engineering Conference and Exhibit (IECEC) St Louis 2007 p 4721.
[4] V. Bemudez, A. Moreau, N. Laurent, L. Jastrzebski “Roadmap of characterization
techniques for the development of thin film photovoltaic technology” Proc.
Photovoltaic Technical Conference – Thin Film 2010, Aix-en-Provence, France
2010.
[5] D. Bonnet, H. Rabenhorst “New results on the development of a thin film p-CdTe/n-CdS
heterojunction solar cell” Proc. 9
th
IEEE Photovoltaic Specialist Conference, New
York 1972 pp 129-131.
[6] X. Wu, J. Keane, R Dhere, C. DeHart, A. Duda, T. Gessert, S. Asher, D. Levi, P. Sheldon
„16.5% efficiency CdS/CdTe polycrystalline thin film solar cell“ Proc. 17
th
European Photovoltaic Solar Energy Conference, Munich 2002 pp 995-1000.
[7] ZSW Press Release 05/2010, Stuttgart, Germany 2010.
[8] A. Tiwari “Flexible solar cells for cost effective electricity. High efficiency flexible solar
cells based on CIGS and CdTe” Proc. Photovoltaic Technical Conference – Thin
Film 2010, Aix-en-Provence, France 2010.
[9] V. Fthenakis, EMRS-2006 Spring meeting
[10] J. Perrenoud, B. Schaffner, L. Kranz, S. Buecheler, A. Tiwari „Flexible CdTe thin film
solar modules“ Proc. Photovoltaic Technical Conference – Thin Film 2010, Aix-en-
Provence, France 2010.
[11] M. Sibiński, M. Jakubowska, K. Znajdek, M. Słoma, B. Guzowski „Carbon nanotube
transparent conductive layers for solar cells applications”, Proc. 10
th
Electron
Innovative Elastic Thin-Film Solar Cell Structures
273
Technology Conf. ELTE 2010 and 34
th
International Microelectronics and Packaging
IMAPS-CPMT Conf., 22-25.09, 2010, 81-82.
[12] H. S. Ullal, K. Zweibel, B. G. Roedem “Polycrystalline thin-film photovoltaic
technologies: from the laboratory to commercialization” NREL 0-7803-5772-8/00
IEEE 2000.
[13] H.S. Ullal, B. Roedern “Thin Film CIGS and CdTe Photovoltaic Technologies:
Commercialization, Critical Issues, and Applications” Proc. 22
nd
European
Photovoltaic Solar Energy Conference (PVSEC) and Exhibition, Milan, Italy 2007
[14] P. Mints „Principal Analyst Navigant Consulting” PV Services Program 2010
[15] T. Markvart, L. Castaner “Solar Cells: Materials, Manufacture and Operation” Elsevier
Amsterdam 2006.
[16] T. Nisho Thin film CdS/CdTe solar cell with 15,05% efficiency 25 th Photovoltaic
Specialists Conference 1996 ss. 953 -956
[17] L. Kazmierski, W. Berry, C. Allen „Role of defects in determining the electrical
properties of CdS thin films”. J. Appl Phys Vol43 No8 1972 pp 3515-3527
[18] R. Bube „Photovoltaic materials“ Imperial college press Londyn 1998 pp 135-136.
[19] S. Bernardi “MOCVD of CdTe on foreign substrates”. Materials Science Forum Vol 203
1996 ss115-122.
[20] C. Ferekides, D Marinski, V. Viswanathan i in.” High efficiency CSS solar cells”. Thin
Solid Films 2000 ss 520-526
[21] Mendoza-Pérez, R.b , Aguilar-Hernández, J.R.a , Sastré-Hernández, J.a , Tufiño-
Velázquez, M.a, Vigil-Galán, O.a , Contreras-Puente, G.S.a , Morales Acevedo, A.c ,
Escamilla-Esquivel, A.a , Ortega-Nájera, B.a , Mathew, X.d , Jean-Marc-Zisae
“Photovoltaic modules processing of CdS/CdTe by CSVT in 40 cm2” 2009 34th
IEEE Photovoltaic Specialists Conference, PVSC 2009; Philadelphia
[22] M. Sibiński, M. Burgelman „Development of the thin-film solar cells technology”.
Microtherm ‘2000 Łódź-Zakopane 2000 ss. 53-60.
[23] B. Depuydt, I Clemminck, M. Burgelman, M. Casteleyn, . “Solar Cells with screen-
printed and sintered CdTe layers on CdS/TCO substrates”. Proc. of the 12th EPSEC
Stephens & Associates. 1994. ss. 1554-1556
[24] M. Sibiński, Z. Lisik "Polycrystalline CdTe solar cells on elastic substrates", Bulletin of
the Polish Academy of Sciences, Technical Sciences Vol. 55, No. 3, 2007, 2007, str.
287-292
[25] M. Sibiński “Thin film CdTe Solar Cells in Building Integrated Photovoltaics”, 1st SWH
International Conference, 13-15 (2003).
[26] I. Lauremann, I. Luck, K. Wojczykowski „CuInS2 based thin film solar cells on roof tile
substrates“ 17th EPSEC 1256-1259 (2001)
[27] D. Batzner, A. Romeo, D. Rudman, M. Kalin, H. Zogg, A. Tiwari . “ CdTe/CdS and
CIGS thin Film Solar Cells.” 1st SWH International Conference 56-60 (2003),
[28] A. Hepp et al. “Ultra-Lightweight Hybrid Thin-Film Solar cells: A survey of Enabling
Technologies for Space Power Applications” 5
th
International Energy Conversion
Engineering Conference and Exhibit (IECEC) St Louis 2007 p 4721
[29] H. Sirringhaus, T. Kawase, R. H. Friend, T. Shimoda, M. Inbasekaran, W. Wu, E. P. Woo,
"High-Resolution Inkjet Printing of All-Polymer Transistor Circuits", Science 15,
vol. 290, no. 5499, 2000, pp. 2123 – 2126.
Solar Cells – Thin-Film Technologies
274
[30] Y. Seunghyup, Y. Changhun, H. Seung-Chan and C. Hyunsoo “Flexible/ ITO-free
organic optoelectronic devices based on versatile multilayer electrodes” – Raport
Integrated Organic Electronics Lab (IOEL)Dept. of Electrical EngineeringKorea
Advanced Institute of Science and Technology (KAIST), Daejeon, Korea 2009.
13
Computer Modeling of Heterojunction with
Intrinsic Thin Layer “HIT” Solar Cells:
Sensitivity Issues and Insights Gained
Antara Datta and Parsathi Chatterjee
Energy Research Unit, Indian Association for the Cultivation of Science,
Jadavpur, Kolkata,
India
1. Introduction
Despite significant progress in research, the energy provided by photovoltaic cells is still a
small fraction of the world energy needs. This fraction could be considerably increased by
lowering solar cell costs. To achieve this aim, we need to economize on the material and
thermal budgets, as well as increase cell efficiency. The silicon “Heterojunction with
Iintrinsic Thin layer (HIT)” solar cell is one of the promising options for a cost effective, high
efficiency photovoltaic system. This is because in “HIT” cells the P/N junction and the back
surface field (BSF) layer formation steps take place at a relatively low temperature (~200°C)
using hydrogenated amorphous silicon (a-Si:H) deposition technology, whereas in normal
crystalline silicon (c-Si) cells the wafer has to be raised to ~800°C for junction and BSF layer
formation by diffusion. This means not only a lower thermal budget, but also cost reduction
from thinner wafers, since the danger of the latter becoming brittle is strongly reduced at
lower (~200°C) temperatures. Thin intrinsic layers on either face of the c-Si substrate,
effectively passivate c-Si surface defects, which would otherwise degrade cell performance.
Moreover it has been demonstrated that carriers can pass through the passivating layers
without significant loss.
In this chapter, we use detailed electrical-optical modeling to understand carrier transport in
these structures and the sensitivity of the solar cell output to various material and device
parameters. The global electrical - optical model “Amorphous Semiconductor Device
Modeling Program (ASDMP)”, originally conceived to simulate the characteristics of solar
cells based on disordered thin films, and later extended to model also mono-crystalline
silicon and “HIT” solar cells (Nath et al, 2008), has been used for all simulations in this
chapter. The model takes account of specular interference effects, when polished c-Si wafers
are used, as well as of light-trapping when HIT cells are depositd on textured c-Si.
2. Historical development of HIT solar cells
One of the successful applications of hydrogenated amorphous silicon (a-Si:H) is in
crystalline silicon heterojunction (HJ) solar cells. Fuhs et al (1974) first fabricated
heterojunction silicon solar cells, where the absorber is P (N) type c-Si, while the emitter N
Solar Cells – Thin-Film Technologies
276
(P) a-Si:H layer is deposited by the standard plasma-enhanced chemical vapor deposition
(PECVD) technique at ~200ºC. However the efficiency achieved was much lower than in c-Si
solar cells. In the early 80’s Prof. Y. Hamakawa and his co-workers [Osuda et al, 1983]
predicted the relevance of a-Si:H /c-Si stacked solar cells in silicon applications. Following
the study of Prof. Hamakawa, many research groups world wide became interested in the
technological development of a-Si:H/c-Si heterojuction solar cells as an alternative to
traditional diffused emitter solar cells. It was almost a decade later that Sanyo began work in
1990 on the growth of low temperature junctions on c-Si and developed a new type of
heterojunction solar cells called ACJ-HIT (Artificially Constructed Junction- Heterojunction
with Intrinsic Thin layer), now shortened to “HIT”, with a conversion efficiency of 18.1%
(Tanaka et al, 1992) that has thereafter been continuously improved to yield an outstanding
22% efficiency in 100 cm
2
solar cells (Taguchi et al, 2005). Moreover Sanyo also achieved
19.5% efficiency in mass production (Tanaka et al, 2003). The innovation that made this
possible was the introduction of thin films of intrinsic a-Si:H on either side of the c-Si wafer,
to passivate the defects on its surface, that were responsible for the low efficiency of the
earlier heterojunction cells [Fuhs et al, 1974]. A low recombination surface velocity of 15
cm/s has been demonstrated for passivation by intrinsic a-Si:H by Wang et al (2005). This is
as good as the best dielectric surface passivation, such as by SiO
2
and amorphous silicon
nitride (SiN
x
) (Meier et al, 2007). More importantly, the a-Si:H I-layer can be inserted
between the c-Si and a doped layer without significant restriction to carrier transport. The
device structure of HIT cells that has been developed by Sanyo is shown in Fig. 1. This cell is
fabricated with CZ N-type wafer of thickness ~250 m. The emitter (doped) layer,
passivating intrinsic layers and the doped BSF layer of the cell are all thin films (a-Si:H) and
deposited by the PECVD technique at ~200ºC. The device terminates with a TCO anti
reflection coating followed by metallic electrodes.
Fig. 1. Schematic diagram of HIT cell proposed by SANYO
HIT cells have (1) potential for high efficiency, (2) very good surface passivation: low
surface recombination velocity, (3) low processing temperature - all processes occur at ~
200C resulting in low thermal budget, (4) reduced material cost (low temperature
processing permits the use of thinner wafers), leading to overall cost reduction and (5)
excellent stability- since the base material of the structure continues to be c-Si. With nearly
19 years of steady progress, in 2009, the best HIT solar cells have recorded a efficiency of
23% over a 100.4 cm
2
cell area (press release SANYO, 2009). Another advantage of HIT solar
Computer Modeling of Heterojunction
with Intrinsic Thin Layer “HIT” Solar Cells: Sensitivity Issues and Insights Gained
277
cells is that it has excellent temperature dependence characteristics and its efficiency does
not deteriorate as much as that of diffused junction c-Si cells at higher temperatures (Sakata
et al, 2000). The efficiency of HIT cells deteriorates by 0.33%/ C with increase of
temperature while it is 0.45%/ C for conventional c-Si solar cells. This means HIT cells
would generate more output power in summer time than its diffused junction counterpart.
References Wafer Solar cell output parameters Emitter &
BSF
deposition
technique
Type Surface J
sc
mA cm
-2
V
oc
mV
Fill
factor
%
SANYO press release N Textured 39.50 729 0.800 23 PECVD
Schmidt et al, 2007 N Textured 39.3 639 0.789 19.8 RF-PECVD
P 34.3 629 0.79 17.4
Wang et al, 2010,2008 P Textured 36.20 678 0.786 19.3 HWCVD
N 35.30 664 0.745 17.2
Olibet et al, 2010, 2007 N Flat 34.0 680 0.82 19.1 VHF-
PECVD
P 32 690 0.74 16.3
Das et al, 2008 N Textured 35.68 694 0.741 18.4 PECVD
Sritharathikhun et al 2008 N Textured 35.20 671 0.76 17.9 VHF-
PECVD
Damon-Lacoste, 2008
P Flat 33.0 664 0.778 17.1 PECVD
Fujiwara & Kondo, 2009 N Flat 32.79 631 0.764 17.5 PECVD
Table 1. Summary of best perfoemances of HIT solar cells on P- and N-type c-Si wafer.
Inspired by the outstanding performance of Sanyo HIT cells, many research groups
throughout the world have been working with these cells and a-Si:H layers have been
deposited by PECVD, hot-wire CVD (HWCVD) and very-high-frequency PECVD (VHF-
PECVD). A summary of the best HIT solar cells reported till date is given in Table 1. We find
that currently, no group has been able to duplicate what Sanyo has achieved in terms of cell
efficiency. Very few groups have reached beyond 19% efficiency: Helmholtz Zentrum Berlin
on N-type textured wafers (Schimdt et al, 2007) and the National Renewable Energy
Laboratory (NREL) on P-type textured wafers (Wang et al, 2008, 2010) have achieved this
feat. Good results have also been obtained by the group of EPFL, IMT, Neuchâtel,
Switzrland with high open-circuit voltsge (V
oc
) on flat wafers. The P-type HIT cell of Damon
Lacoste et al (2008) from LPICM-Ecole Polytechnique, France also deserves mention. Here
the efficiency is limited by the lower short-circuit current density (J
sc
)
characteristic of flat
wafers. The difficulty in attaining the Sanyo HIT cell efficiency illustrates that the a-Si:H/c-
Si HJ is indeed a very challenging structure to understand. Therefore, over the last decade
scientists are using detailed computer modeling to fully understand the structure. In the
next section we will briefly review the computer modeling of HIT solar cells. Recently a few
groups have started fabricating HIT cells with intrinsic hydrogenated amorphous silicon
oxide (I-a-SiO:H) as the buffer layer between crystalline and doped amorphous silicon.
Sritharathikhun et al (2008) have achieved 17.9% cell efficiency with P-c-SiO:H /N-c-Si cell
structure and I-a-SiO:H as the buffer layer. A group from AIST (Fujiwara et al, 2009) has
reported 17.5% cell efficiency with a similar cell structure.
Solar Cells – Thin-Film Technologies
278
2.1 Detailed one-dimensional computer modeling of HIT solar cells:-
Pioneering work in detailed electrical modeling of a-Si:H solar cells was done by Hack and
Schur (1985). Other notable models in this respect are the model AMPS (McElheny et al,
1988, Arch et al, 1991) by S. J. Fonash’s group at the Pennsylvania State University, USA, the
model of Guha’s group (Guha et al, 1989), the ASDMP program by P. Chatterjee (Chatterjee,
1992, 1994, 1996), the ASPIN program of Smole and Furlan (1992) and the ASA program by
von der Linden et al (1992). Regarding detailed electrical-optical models, which include
textured surfaces and light-trapping kinetics to some extent, the first global electrical-optical
model developed in the world was when ASDMP was integrated (Chatterjee et al, 1996) to a
semi-empirical optical model by Leblanc et al (1994). This program also takes account of
specular interference effects for cells with flat surfaces. Later the developed AMPS program
(D-AMPS – Plà et al, 2003) and the ASA package, developed at the Delft University of
Technology (Zeman et al, 2000) also introduced light trapping effects.
Modeling of HIT cells was started by van Cleef et al (1998 a,b) using the AMPS computer
code (McElheny et al, 1988), which however does not have a proper built-in optical model;
and the derivative of the AMPS program (D-AMPS), where a fairly good optical model has
been introduced (Plà et al, 2003). The numerical PC program AFORS-HET (Stangl et al, 2001,
Froitzheim et al, 2002) has been developed especially for simulating HIT solar cells. The
latter has recently also been extended to include light-trapping effects. The ASA program in
its later version (Zeman et al, 2000) models both the electrical and optical properties of HIT
cells. The PC-1D program (Basore, 1990, Basore et al, 1997), developed at the University of
News South Wales, Australia for modeling textured mono-crystalline silicon solar cells, has
also been fairly successful in modeling HIT cells. The program ASDMP by Chatterjee et al
(1994,1996), has also been extended to model N-a-Si:H/P-c-Si type front (with a
heterojunction only on the emitter side) (Nath et al, 2008) HIT cells and subsequently used
to model double hetreojunction solar cells both on N- and P-type substrates ( Datta et al,
2008, 2009, Rahmouni et al, 2010).
2.1.1 Simulation model ASDMP
We will discuss this model in a little more detail, since it has been used in all simulations in
this chapter. The “Amorphous Semiconductor Device Modeling Program (ASDMP) ”
(Chatterjee et al, 1996, Palit et al, 1998 ), originally conceived to model amorphous silicon
based devices, has been extended to also model c-Si and “HIT” cells (Nath et al, 2008). This
one-dimensional program solves the Poisson's equation and the two carrier continuity
equations under steady state conditions for the given device structure, without any
simplifying assumptions, and yields the dark and illuminated current density - voltage (J-
V), the quantum efficiency (QE) and the photo- and electro-luminescence characteristics of
HIT cells. Its electrical part is described in P. Chatterjee (1994, 1996). The gap state model
used in these calculations for the amorphous layers, consists of the tail states and the two
Gaussian distribution functions to simulate the deep dangling bond states, while in the c-Si
part, the tail states absent. The lifetime of the minority carriers inside the N(P) -c-Si wafer
may be estimated using the formula:
0
p
p
p
R
or
0
n
nn
R
, (1)
Computer Modeling of Heterojunction
with Intrinsic Thin Layer “HIT” Solar Cells: Sensitivity Issues and Insights Gained
279
where
p
(
n
), p(n) and p
0
(n
0
)
are the minority carrier lifetime, its density under the given
experimental conditions (in this case under 100 mW cm
-2
of AM1.5 light), and at
thermodynamic equilibrium respectively; while R is the recombination rate in the c-Si wafer.
The lifetime, calculated in this manner, is in general, position-dependent; however over a
large region inside the c-Si wafer, away from the edges, it is a constant and it is this value
that is taken to be the minority carrier lifetime in the wafer. van Cleef et al (1998a,b) and
Kanevce et al (2009) have also used the DOS model to simulate their HIT cells.
The generation term in the continuity equations has been calculated using a semi-empirical
model (F. Leblanc et al, 1994) that has been integrated into the ASDMP modeling program
(Chatterjee et al, 1996, Palit et al, 1998). Both specular interference effects and diffused
reflectance and transmittance due to interface roughness can be taken into account. The
complex refractive indices for each layer of the structure, required as input to the modeling
program, have been measured by spectroscopic ellipsometry. In all cases studied in this
article, experimentally or by modeling, light enters through the transparent conducting
oxide (TCO)/emitter window, which is taken as x = 0 on the position and referred to as the
front contact. Voltage is also applied at x = 0. The BSF/ metal contact at the back of the c-Si
wafer is taken as x = L on the position scale, where L is the total thickness of all the
semiconductor layers of the device. This back contact is assumed to be at ground potential.
Fig. 2. Energy band diagram for HIT solar cells on P and N type wafers under 100 mW of
AM1.5 light and short-circuit conditions.
The calculated energy band diagrams for typical HIT cells on P- and N-type wafers, with
passivated surface defects and under 100 mW of AM1.5 light, 0 volts, are shown in Fig. 2.
4. Modeling of HIT solar cells on P-type wafer
4.1 Simulation of experimental results of P-type HIT cells
We have studied both front and double “HIT” structure solar cells on P-type c-Si wafers.
These have the structure: N-a-Si:H emitter/ P-c-Si/ aluminum diffused BSF (front HIT) and
N-a-Si:H emitter/ P-c-Si/ P
+
-a-Si:H BSF (double HIT). The experimental data were obtained
from the Laboratoire de Physique des Interfaces et des Couches Minces (LPICM), Ecole
Polytechnique, Palaiseau, France. Table 2 compares our modeling results to the measured
output parameters for front and double HIT structures. Two thicknesses of the N-a-Si:H
layer are employed for the front HIT structures, while results are given for two types of
-2
-1.5
-1
-0.5
0
0.5
1
1.5
0.001 0.01 0.1 1 10 100 10
E
c
E
F
E
F
E
v
p
n
P-Type HIT cell
Energy (eV)
Position (microns)
-1.5
-1
-0.5
0
0.5
1
1.5
0.001 0.01 0.1 1 10 100 1000
E
c
E
F
E
F
E
v
p
n
Position (microns)
N-Type HIT cell
Solar Cells – Thin-Film Technologies
280
double HIT cells having the following structures: (A) 8 nm N-a-Si:H/ 3 nm pm-Si:H intrinsic
layer/ P-c-Si wafer/ 23 nm P
+
-a-Si:H/ 1.5 m Al, and (B) the above structure, but with a 4
nm P
+
-a-SiC:H layer sandwiched between the P-c-Si wafer and a 19 nm P
+
-a-Si:H layer. The
pm-Si:H intrinsic layer on the front surface (FS) of the c-Si wafer is there to passivate the
defects on this surface. However, no such passivating layer has been deposited on the rear
surface (RS) of the c-Si wafer. The defect density on FS was deduced by modeling to be 10
11
cm
-2
. Cell B, which has a 4 nm P-type a-SiC:H layer on the rear c-Si wafer surface, has a
slightly higher V
oc
but a lower FF relative to case A, leading to a better efficiency. However,
we could not replicate these results in our modeling calculations by the introduction of a P
+
-
a-SiC:H layer of the given properties alone (case B1 in Table 2). In fact, the defect density on
the rear wafer surface had to be slightly reduced (case B2, Table 2) to match the
experimental results.
Table 2 indicates good agreement between experiments and modeling, except that our
modeling results appear to overestimate the FF and hence the efficiency of front HIT cells. In
reality this is because screen-printed contacts with low temperature silver paint was used
for these cells; resulting in high series resistance and low FF experimentally, which cannot
be accounted for by modeling. For double HIT structures, developed later, improved contact
formation resulted in very low series resistance and high fill factors experimentally, which
agree well with model calculations (Table 2).
HIT
type
Sample
N-a-Si:H
(nm)
N
ss
on the DL
(cm
-2
)
V
oc
(mV)
J
sc
(mA cm
-2
)
FF
(%)
Front
X1 (E) 12 634 31.90 0.711 14.38
X1 (M) 12 FS- 4x10
11
636 31.85 0.823 16.67
X2 (E) 8 640 32.54 0.730 15.20
X2 (M) 8 FS- 4x10
11
640 32.57 0.824 17.18
Double
A (E) 8 650 32.90 0.790 16.90
A (M) 8
FS-10
11
660 32.84 0.781 16.93
RS-8x10
11
B (E) 8 664 33.10 0.779 17.12
B1(M)
FS-10
11
653 33.17 0.749 16.24
RS-8x10
11
B2 (M) 8
FS-10
11
667 33.21 0.773 17.12
RS- 3x10
11
Table 2. Comparison between measured (E) and modeled (M) solar cell output parameters
of front and double P-c-Si HIT cells with a flat ITO front contact. DL refers to the defective
layer on the wafer surface.
In Fig. 3 (a), we compare the experimentally measured external and internal quantum
efficiency (EQE and IQE respectively) curves of the solar cell B to modeling results, while in
Fig. 3 (b) we compare the measured IQE curves of a front HIT and the above-mentioned
double HIT solar cells, both deposited in the same reactor and under approximately the
same conditions of RF power and pressure as solar cells A and B above. The IQE is obtained
from the EQE using the formula:
() ()/(1 () ())IQE EQE R ITOabs
, (2)
Computer Modeling of Heterojunction
with Intrinsic Thin Layer “HIT” Solar Cells: Sensitivity Issues and Insights Gained
281
where R(λ) is the reflectivity of the HIT cell and ITOabs(λ) is the fraction of the light that is
absorbed in the transparent conducting oxide, that is indium tin oxide (ITO) in this case.
Fig. 3. Comparison of the experimentally measured external and internal QE curves of (a) a
double heterojunction cell (case B2 of Table 2); and (b) of a front and the above double HIT
solar cell, to modeling results, indicating a higher long wavelength IQE for the double HIT
case, both experimentally and in the modeling calculations. The ITO layer is different for the
two cases resulting in the difference in the short wave length QE. The lines represent the
calculated results, experimental measurements are shown as symbols.
We have used the above simulations to extract the parameters that characterize different
layers of the double HIT cells A and B on P-type wafers. These are given in Table 3, together
with the extracted parameters of double HIT cells on N-type wafers. The experimental
results used to extract the latter and comments thereon, will be discussed in section 5.1. The
data in Table 3 includes some measured data: the thickness and doping density of each
layer/ wafer, the band gaps of the layers and the electron and hole mobility in the c-Si wafer
(Sze, 1981). We also found that a higher value of N
ss
(as indicated in Case B2 in Table 2 and
Table 3) was necessary at the RS to simulate the experimental results. No layer was
intentionally deposited to passivate these defects in cells A and B.
Since the 4-nm P
+
-a-SiC:H layer on the RS of the c-Si wafer (part of the highly doped thin
film BSF layer) produces a small but reproducible improvement in the overall device
performance, we have tried to understand the basic reasons for this improvement. To realize
the role of the thin P-a-SiC:H layer on the RS in case B2 we have made the P
+
-a-SiC:H layer
thicker than in case B2 and adjusted the thickness of following P
+
-a-Si:H layer to yield a total
BSF thickness of 23 nm. We found an all-round deterioration of the solar cell output for the
thicker P
+
-a-SiC:H layers, including a striking fall in the fill factor. We have thus concluded
that the introduction of the thin carbide layer as such is not responsible for the observed
improvement in cell efficiency of case B2 relative to case A (Table 2). Rather, it appears likely
that this wider band gap material helps in passivating the defects on the RS of the c-Si wafer
(for which a very thin layer is sufficient) and thereby improves cell performance. In the next
section we will discuss how solar cell performance is affected by the defects on the FS and
RS of the c-Si wafer.
0
0.2
0.4
0.6
0.8
1
0.2 0.4 0.6 0.8 1 1.2
EQE_model
IQE_model
EQE_expt
IQE_expt
QE
EQE
IQE
(a)
Wavelength (microns)
0
0.2
0.4
0.6
0.8
1
0.2 0.4 0.6 0.8 1 1.2
Double HIT_model
Front HIT_model
Double HIT_expt
Front HIT_expt
Internal QE
Wavelength (microns)
(b)
Solar Cells – Thin-Film Technologies
282
Parameters
N-a-Si:H/P-
a-Si:H
emitter
I-pm
Si:H
buffer
I-a-Si:H
buffer
DL
on P-c-Si/
N-c-Si
on emitter
side
P-c-Si/N-c-
si wafer
P
+
-a-Si :H
/ N
+
-a-
Si : H
BSF
Layer thickness (m)
0.008/
0.0065
0.003 0.003 0.003 300/220 0.019
Electron affinity (eV) 4 3.95 4 4.22 4.22 4
Mobility gap (eV) 1.80 1.96 1.80 1.12 1.12 1.78/1.80
Don (accep)doping
(cm
-3
)
10
19
/
1.41x10
19
0 0 9x10
14
9x10
14
1.4x10
19
/
1.45x10
19
Eff. DOS in CB (cm
-3
)
Eff. DOS in VB (cm
-3
)
2x10
20
2x10
20
2x10
20
2x10
20
2x10
20
2x10
20
2.8x10
19
1.04x10
19
2.8x10
19
1.04x10
19
2x10
20
2x10
20
Exp.tail prefact.
-cm
-3
eV
-1
4x10
21
4x10
21
4x10
21
4x10
21
Charac.energy – VB
tail (ED) (eV)
0.05 0.05 0.07
― 0.05
Charac.energy – CB
tail (EA) (eV)
0.03 0.03 0.04 — — 0.03
Elec.mobility
(cm
2
/V-s)
20/25 30 25 1000/1500 1000/1500 20
Hole mobility
(cm
2
/V-s)
6/5 12 5 450/500 450/500 6/4
Gaussian
defect density (cm
-3
)
9x10
18
7x10
14
9x10
16
2.6x10
18
/
4.5x10
18
10
12
8x10
18
/
9x10
18
Table 3. Input parameters, extracted by modeling, that characterize the above HIT cells. The
defect density of 3.3x10
17
cm
-3
on the front wafer surface corresponds to a defect density of
10
11
cm
-2
(FS) and 3.5x10
18
cm
-3
to 8x10
11
cm
-2
on the rear surface (RS). The P
+
-a-SiC:H BSF
layer in P-type HIT cells has a larger band gap (1.84 eV), and broader band taills: ED=0.7 eV,
EA=0.5 eV
4.2 Influence of the defect density on the front surface of the c-Si wafer:
The effect on the solar cell output parameters of varying the defect density, N
ss
, on front
surface of the P-type c-Si wafer (that which faces the incoming light) is shown in Table 4,
using as the base case the double HIT cell B2, but with an assumed textured wafer to
reproduce state-of-the-art currents obtainable in HIT cells. The defect density on the RS is
held at 10
11
cm
-2
for all cases. The results indicate a sharp fall in V
oc
, and FF.
To understand the sensitivity, we turn to Fig. 4. We note that the electric field is higher at
the amorphous - crystalline interface, when N
ss
= 3x10
13
cm
-2
than when N
ss
= 10
11
cm
-2
(Fig.
4a). This is because when the N-a-Si:H layer is joined to a P-c-Si wafer, with a high defect
density on its surface, most of the electrons that flow from the N-side to the P-side during
junction formation, to bring the thermodynamic equilibrium Fermi levels on either side to
the same level, are trapped in these states. The space charge region on the P-c-Si wafer side
is therefore localized near the surface and does not extend appreciably into the c-Si wafer.
We therefore have a huge density of trapped electrons, a very high interface field (Fig. 4a),
Computer Modeling of Heterojunction
with Intrinsic Thin Layer “HIT” Solar Cells: Sensitivity Issues and Insights Gained
283
N
ss
on FS
(cm
-2
)
J
sc
(mA cm
-2
)
V
oc
(mV)
FF
(%)
10
11
37.50 672 0.770 19.40
2x10
12
38.33 586 0.658 14.79
3x10
13
38.14 463 0.545 9.65
Table 4. Calculated values of the solar cell output parameters J
sc
, V
oc
, FF and , for different
values of the defect density (N
ss
) on that (front) surface of the crystalline silicon wafer
through which light enters, indicating high sensitivity to the V
oc
and FF. The defect density
at the rear surface of the c-Si wafer is 10
11
cm
-2
.
Fig. 4. Effect of changing the defect density (shown in units of cm
-2
) on the front surface of
the c-Si wafer under 100 mW cm
-2
of AM1.5 light and 0 volts, on (a) the electric field (the
inset shows the electric field on an expanded scale over the depletion region) and (b) the
band diagram over the front part of the device.
and a collapse of the field over the adjacent depletion region of the c-Si wafer (Fig. 4a inset)
for the case with N
ss
= 3x10
13
cm
-2
. This results in the flattening of the energy bands in the
totality of the P-type crystalline silicon wafer (Fig. 4b, dashed lines), and a consequent fall in
V
oc
and FF (Table 4). For the case of low N
ss
, the space charge region on the P-c-Si wafer is
not localized and more field exists up to the neutral zone of the c-Si wafer (Fig. 4a inset and
band diagram in Fig. 5b, solid lines); resulting in higher V
oc
and FF (Table 4).
4.3 Influence of the defect density on the rear surface of the c-Si wafer
Table 5 gives the calculated solar cell output parameters J
sc
, V
oc
, FF and efficiency for
different values of the defect density (N
ss
) on the rear surface of the c-Si wafer (away from
the side where light enters). We have again varied N
ss
between 10
11
cm
-2
and 3x10
13
cm
-2
, but
this time the largest effect is on the fill factor and the short-circuit current density, as seen
from Table 5 and Fig. 5 (a). In order to understand why, we have traced the band diagrams
for different N
ss
on the RS, with the N
ss
at the FS held at 10
11
cm
-2
(Fig. 5b). We find that the
band bending over the depletion region has completely disappeared for the highest value of
N
ss
(3x10
13
cm
-2
) at RS. From our modeling calculations we also note that up to a defect
density of ~10
12
cm
-2
at RS, the solar cell output parameters do not deteriorate appreciably.
For higher values of N
ss
the decrease in J
sc
and FF in particular, is extremely rapid, the
sensitivity to V
oc
being relatively small. Experimentally also it has been found that whether
or not an intrinsic passivating layer is deposited on the rear face of the P-type c-Si wafer, the
0
2x10
6
4x10
6
0.001 0.01 0.1 1
10
11
2x10
12
3x10
13
Field on holes (volt cm
-1
)
Position (microns)
(a)
0
2x10
4
4x10
4
0.01 0.1 1
-2
-1.5
-1
-0.5
0
0.5
1
1.5
0.001 0.01 0.1 1
Energy (eV)
Position (microns)
(b)