REPORT NO. 2009-116 FEBRUARY 2009 SOUTH FLORIDA COMMUNITY COLLEGE _part2 pot
Bạn đang xem bản rút gọn của tài liệu. Xem và tải ngay bản đầy đủ của tài liệu tại đây (115.25 KB, 10 trang )
FEBRUARY 2009 REPORT NO. 2009-116
-7-
6-30-08 6-30-07 12-31-07 12-31-06
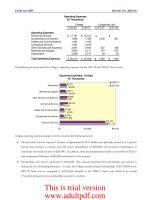
Operating Expenses
Personnel Services 17,151$ 16,124$
Scholarships and Waivers 1,899 1,338 1,005 427
Utilities and Communications 1,634 1,445
Contractual Services 1,231 2,916
Other Services and Expenses 2,087 2,585 327 429
Materials and Supplies 2,642 2,111 197 276
Depreciation 2,569 2,217 64 58
Total Operating Expenses
29,213$ 28,736$ 1,593$ 1,190$
Operating Expenses
(In Thousands)
College Component Unit
$ $
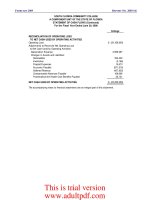
The following chart presents the College’s operating expenses for the 2007-08 and 2006-07 fiscal years:
Operating Expenses: College
(In Thousands)
$17,151
$1,899
$1,634
$1,231
$2,087
$2,642
$2,569
$16,124
$1,338
$1,445
$2,916
$2,585
$2,111
$2,217
$0 $10,000 $20,000
Personnel Services
Scholarships and Waivers
Utilities and Communications
Contractual Services
Other Services and Expenses
Materials and Supplies
Depreciation
2006-07
2007-08
College operating expense changes were the result of the following factors:
¾ The personnel services expenses’ increase of approximately $1.03 million was primarily caused by a 5 percent
annual salary increase to faculty and staff (salary expenditures of $650,000) and increased contributions to
retirement and social security of $296,000. In addition, other postemployment health care benefits of $30,131
and compensated absences of $30,000 contributed to this increase.
¾ Scholarships and waivers increased by $562,000. The amount presented for scholarships and waivers is
reduced by the scholarship allowance. As such, the College actually awarded scholarships of $3,750,906 in the
2007-08 fiscal year as compared to $2,951,660 awarded in the 2006-07 fiscal year, which is an overall
27 percent increase in gross scholarships awarded to students.
This is trial version
www.adultpdf.com
FEBRUARY 2009 REPORT NO. 2009-116
-8-
¾ Utilities and communication charges increased $189,000 primarily due to increases in electrical rates and air
conditioning for additional square footage in the newly completed Health and Science Education Center.
¾ Contractual services decreased $1.69 million due to the loss of the grant that funded the operations of the
Florida Center for Dual Addictions.
Component unit operating expense changes were the result of the following factors:
¾ The South Florida Community College Foundation, Inc. (Foundation), awarded $1 million in scholarships, an
increase of $577,425. In the current year, an individual donor gave a significant gift to the Take Stock in
Children program that paid for scholarships that did not occur in the prior year.
¾ Other services and expenses decreased by $102,500 and materials and supplies expense decreased by $79,000
because the Foundation did not do as much renovation in the Hotel Jacaranda as in the prior year.
Nonoperating Revenues and Expenses
Certain revenue sources that the College relies on to provide funding for operations, including State appropriations,
certain gifts and grants, and investment income, are defined by GASB as nonoperating. Nonoperating expenses
include capital financing costs and other costs related to capital assets. The following summarizes the College’s
nonoperating revenues and expenses for the 2007-08 and 2006-07 fiscal years:
2007-08
2006-07
State Appropriations 17,374$ 16,820$
Gifts and Grants 4,814 4,190
Investment Income 299 359
Other Nonoperating Revenue 2
Gain on Disposal of Capital Assets 335
Interest on Capital Asset-Related Debt (5)
Net Nonoperating Revenues 22,822$ 21,366$
Nonoperating Revenues (Expenses): College
(In Thousands)
Nonoperating revenues changes were the result of the following factors:
¾ State appropriations increased in total by $553,934. While the College was originally awarded $17,665,678,
cutbacks to balance the State budget reduced appropriations by $549,713.
¾ Gifts and grants in total increased by $624,163. Student aid increased by $797,499, mainly attributable to
increases in Bright Futures scholarships and Pell grants and other gifts and grants decreased $173,336.
¾ College investment income decreased $59,684 as a result of lower interest rates. This seems contrary to the
Foundation investment income increase of $128,000; however, the Foundation is reported on the calendar
year and rates have dropped since their year end of December 31, 2007. Also, the Foundation invests in many
types of investments and the College only invests in low risk, cash equivalents.
This is trial version
www.adultpdf.com
FEBRUARY 2009 REPORT NO. 2009-116
-9-
¾ The increase in other nonoperating revenues was caused primarily by a gain recognized during the course of
capital renovations.
Other Revenues, Expenses, Gains, or Losses
This category is mainly composed of capital appropriations and capital grants, contracts, gifts, and fees. The
following summarizes the College’s other revenues, expenses, gains, or losses for the 2007-08 and 2006-07 fiscal
years:
2007-08 2006-07
Capital Appropriations 7,207$ 5,801$
Capital Grants, Contracts, Gifts, and Fees 576 960
Total
7,783$ 6,761$
Other Revenues, Expenses, Gains, or Losses: College
(In Thousands)
The $1.4 million increase in capital appropriations revenue is primarily attributable to PECO appropriations for
renovations on the Highlands campus and at the Lake Placid Center. The $383,764 decrease in capital grants,
contracts, and fees is mainly attributable to the transfer, during the prior year, of the Lake Placid Center to the
College as donated property at market value of $760,000.
T
HE STATEMENT OF CASH FLOWS
Another way to assess the financial health of an institution is to look at the statement of cash flows. Its primary
purpose is to provide relevant information about the cash receipts and cash payments of an entity during a period.
The statement of cash flows also helps users assess:
¾ An entity’s ability to generate future net cash flows.
¾ Its ability to meet its obligations as they come due.
¾ Its need for external financing.
This is trial version
www.adultpdf.com
FEBRUARY 2009 REPORT NO. 2009-116
-10-
A summary of the College’s cash flows for the 2007-08 and 2006-07 fiscal years is presented in the following table:
2007-08 2006-07
Cash Provided (Used) by:
Operating Activities (23,350)$ (19,652)$
Noncapital Financing Activities 22,215 21,052
Capital and Related Financing Activities (195) 185
Investing Activities 299 359
Net Increase (Decrease) in Cash and Cash Equivalents
(1,031) 1,944
Cash and Cash Equivalents, Beginning of Year 8,831 6,888
Cash and Cash Equivalents, End of Year
7,800$ 8,832$
Condensed Statement of Cash Flows: College
(In Thousands)
Major sources of funds came from State appropriations ($17.4 million), capital appropriations ($4.9 million), gifts
and grants ($4.8 million), and net student tuition and fees ($2 million). Changes in cash and cash equivalents were
the result of the following factors:
¾ Cash used by operating activities increased approximately $3.7 million. Tuition and fees provided $305,938
more while grants and contracts provided $2.2 million less than in the 2006-07 fiscal year. Personnel expenses
increased by $731,119, benefits increased by $294,981, scholarship increased by $552,417, and utilities and
communications increased by $188,737. While the ancillaries brought in additional cash flows of $134,719, the
auxiliaries saw their cash flows slightly reduced by $231,451. Payments to suppliers declined $1.5 million in
direct correlation to the declining level of construction activity similar to other receipts and payments.
¾ The increase of just under $1.2 million dollars from noncapital financing activities was primarily caused by the
$553,934 increase in State appropriations and an additional $624,164 in gifts and noncapital financial grants.
¾ Net cash used from capital activities reflects a decline in construction activity of $4.9 million from the prior
year. Similarly, purchases of capital assets decreased $4.1 million. In total during the year, capital expenditures
exceeded capital cash flows by $195,450 despite a $384,854 increase in capital grants.
¾ A lower rate of return on investments resulted in a $59,691 decrease in investment income.
These factors contributed to an overall decrease in cash of $1,031,247.
CAPITAL ASSETS AND DEBT ADMINISTRATION
C
APITAL ASSETS
At June 30, 2008, the College had $85.6 million in capital assets, less accumulated depreciation of $27 million, for
net capital assets of $58.6 million. Depreciation charges for the current fiscal year totaled $2.6 million. The
following table summarizes the College’s capital assets for the 2007-08 fiscal year:
This is trial version
www.adultpdf.com
FEBRUARY 2009 REPORT NO. 2009-116
-11-
Capital Assets Beginning Additions Reductions Ending
Balance Balance
Land 2,478$ $ $ 2,478$
Artwork 402 2 404
Buildings 56,441 9,911 1,477 64,875
Other Structures and Improvements 9,541 2,360 309 11,592
Furniture, Machinery, and Equipment 2,753 248 131 2,870
Construction in Progress 10,554 4,568 11,747 3,375
Total 82,169 17,089 13,664 85,594
Less, Accumulated Depreciation:
Buildings 17,637 1,483 1,936 17,184
Other Structures and Improvements 6,878 793 185 7,486
Furniture, Machinery, and Equipment 2,156 293 130 2,319
Total Accumulated Depreciation 26,671 2,569 2,251 26,989
Capital Assets, Net 55,498$ 14,520$ 11,413$ 58,605$
Capital Assets: College
(In Thousands)
The College made several additions during the current fiscal year. The Health and Science Building was completed
along with several site improvements to accommodate shifting student flow because the new building is large.
Renovations to building F, C, C2, and T were started and almost completed during the year. Renovations to the
Auditorium and to the Lake Placid Center are underway but are still in the planning phases. Other projects
completed included the addition of a parking lot to the Hardee Center, upgrades to the College’s computer network,
and a telephone system upgrade. Projects that are currently underway include renovations to the amphitheatre area
on the Highlands campus. College Trustees have approved a $7.3 million budget for capital projects for 2008-09.
More detailed information about the College’s capital assets is presented in the notes to financial statements.
D
EBT ADMINISTRATION
At fiscal year-end, the College was debt free. During the 2007-08 fiscal year, there were no bond sales. Additional
information about the College’s long-term liabilities is presented in the notes to the financial statements.
ECONOMIC FACTORS THAT WILL AFFECT THE FUTURE
South Florida Community College‘s economic condition is closely tied to that of the State of Florida. Because of
limited economic growth and increased demand for State resources, only a modest increase in State funding is
anticipated in the coming year. In response to the lack of substantial State appropriation increases, the Board of
Trustees increased the tuition rate 6 percent to take effect beginning with the Fall 2009 term. The College’s current
financial and capital plans indicate that the infusion of additional financial resources from an increase in tuition rates
will be necessary to maintain its present level of services.
This is trial version
www.adultpdf.com
FEBRUARY 2009 REPORT NO. 2009-116
-12-
REQUESTS FOR INFORMATION
Questions concerning information provided in the MD&A, and financial statements and notes thereto, or requests
for additional financial information should be addressed to the Controller, South Florida Community College,
600 West College Drive, Avon Park, Florida 33825.
This is trial version
www.adultpdf.com
FEBRUARY 2009 REPORT NO. 2009-116
-13-
BASIC FINANCIAL STATEMENTS
College Component
Unit
ASSETS
Current Assets:
Cash and Cash Equivalents 3,812,332$ 613,580$
Restricted Cash and Cash Equivalents 327,097
Investments 3,631,237
Accounts Receivable 292,706 181,621
Due from Other Governmental Agencies 5,787,427
Due from Component Unit 56,738
Inventories 18,662
Prepaid Expenses 224,438 20,386
Total Current Assets
10,519,400 4,446,824
Noncurrent Assets:
Restricted Cash and Cash Equivalents 3,660,759 462,877
Investments 3,903,196
Depreciable Capital Assets, Net 52,348,466 1,221,326
Nondepreciable Capital Assets 6,256,682 317,720
Total Noncurrent Assets
62,265,907 5,905,119
TOTAL ASSETS
72,785,307$ 10,351,943$
LIABILITIES
Current Liabilities:
Accounts Payable 276,321$ 134,685$
Salary and Payroll Taxes Payable 246,849
Retainage Payable 262,426
Deferred Revenue 427,028
Deposits Held for Others 309,027 6,100
Long-Term Liabilities - Current Portion:
Compensated Absences Payable 90,647
Total Current Liabilities
1,612,298 140,785
Noncurrent Liabilities:
Compensated Absences Payable 1,885,241
Postemployment Health Care Benefits Payable 30,131
Total Noncurrent Liabilities
1,915,372
TOTAL LIABILITIES
3,527,670 140,785
SOUTH FLORIDA COMMUNITY COLLEGE
A COMPONENT UNIT OF THE STATE OF FLORID
A
STATEMENT OF NET ASSETS
A
s of June 30, 2008
This is trial version
www.adultpdf.com
FEBRUARY 2009 REPORT NO. 2009-116
-14-
College
Component
Unit
NET ASSETS
Invested in Capital Assets, Net of Related Debt 58,605,148$ 1,539,046$
Restricted:
Nonexpendable:
Endowment 4,366,073
Expendable:
Grants and Loans 131,372 3,940,987
Scholarships 25,600
Capital Projects 8,764,395
Unrestricted 1,731,122 365,052
Total Net Assets
69,257,637 10,211,158
TOTAL LIABILITIES AND NET ASSETS
72,785,307$ 10,351,943$
The accompanying notes to financial statements are an integral part of this statement.
SOUTH FLORIDA COMMUNITY COLLEGE
A COMPONENT UNIT OF THE STATE OF FLORIDA
STATEMENT OF NET ASSETS (Continued)
As of June 30, 2008
This is trial version
www.adultpdf.com
FEBRUARY 2009 REPORT NO. 2009-116
-15-
Colle
g
e
Component
Unit
REVENUES
Operating Revenues:
Student Tuition and Fees, Net of Scholarship
Allowances of $1,851,571 1,894,611$ $
Federal Grants and Contracts 262,653
State and Local Grants and Contracts 60,198
Nongovernmental Grants and Contracts 155,820
Sales and Services of Educational Departments 591,147
Auxiliary Enterprises 1,036,793
Other Operating Revenues 45,551 210,710
Total Operating Revenues
4,046,773 210,710
EXPENSES
Operating Expenses:
Personnel Services 17,151,444
Scholarships and Waivers 1,899,335 1,004,852
Utilities and Communications 1,634,036
Contractual Services 1,230,904
Other Services and Expenses 2,087,097 326,992
Materials and Supplies 2,641,529 197,087
Depreciation 2,569,087 63,767
Total Operating Expenses
29,213,432 1,592,698
Operating Loss
(25,166,659) (1,381,988)
NONOPERATING REVENUES
State Appropriations 17,374,161
Gifts and Grants 4,814,130 1,525,267
Investment Income 299,111 737,335
Net Realized and Unrealized Gain on Investments 9,248
Other Nonoperating Revenues 114
Gain on Disposal of Capital Assets 334,781
Net Nonoperating Revenues
22,822,297 2,271,850
Income (Loss) Before Other Revenues,
Expenses, Gains, or Losses
(2,344,362) 889,862
Capital Appropriations 7,206,652
Capital Grants, Contracts, Gifts, and Fees 576,472
Total Other Revenues
7,783,124
Increase in Net Assets
5,438,762 889,862
Net Assets, Beginning of Year 63,818,875 9,321,296
Net Assets, End of Yea
r
69,257,637$ 10,211,158$
The accompanying notes to financial statements are an integral part of this statement.
SOUTH FLORIDA COMMUNITY COLLEGE
A COMPONENT UNIT OF THE STATE OF FLORIDA
STATEMENT OF REVENUES, EXPENSES, AND CHANGES IN NET ASSETS
For the Fiscal Year Ended June 30, 2008
This is trial version
www.adultpdf.com
FEBRUARY 2009 REPORT NO. 2009-116
-16-
Colle
g
e
CASH FLOWS FROM OPERATING ACTIVITIES
Tuition and Fees, Net 2,096,027$
Grants and Contracts 191,678
Payments to Suppliers (5,962,696)
Payments for Utilities and Communications (1,634,036)
Payments to Employees (13,573,752)
Payments for Employee Benefits (3,444,052)
Payments for Scholarships (1,899,335)
Auxiliary Enterprises 1,028,866
Sales and Service of Educational Departments 591,147
Other Payments (744,106)
Net Cash Used by Operating Activities
(23,350,259)
CASH FLOWS FROM NONCAPITAL FINANCING ACTIVITIES
State Appropriations 17,374,161
Gifts and Grants Received for Other Than Capital or Endowment Purposes 4,814,130
Other Nonoperating Receipts 27,060
Net Cash Provided by Noncapital Financing Activities 22,215,351
CASH FLOWS FROM CAPITAL AND RELATED FINANCING ACTIVITIES
Capital Appropriations 4,935,412
Capital Grants and Gifts 571,471
Proceeds from Sale of Capital Assets 4,291
Purchases of Capital Assets (5,706,624)
Net Cash Used by Capital and Related Financing Activities (195,450)
CASH FLOWS FROM INVESTING ACTIVITIES
Investment Income 299,111
Net Cash Provided by Investing Activities 299,111
Net Decrease in Cash and Cash Equivalents (1,031,247)
Cash and Cash Equivalents, Beginning of Year 8,831,435
Cash and Cash Equivalents, End of Yea
r
7,800,188$
SOUTH FLORIDA COMMUNITY COLLEGE
A COMPONENT UNIT OF THE STATE OF FLORIDA
STATEMENT OF CASH FLOWS
For the Fiscal Year Ended June 30, 2008
This is trial version
www.adultpdf.com