REPORT NO. 2009-160 MARCH 2009 UNIVERSITY OF CENTRAL FLORIDA_part2 pptx
Bạn đang xem bản rút gọn của tài liệu. Xem và tải ngay bản đầy đủ của tài liệu tại đây (106.79 KB, 9 trang )
MARCH 2009 REPORT NO. 2009-160
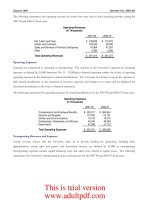
The following summarizes the operating revenues by source that were used to fund operating activities during the
2007-08 and 2006-07 fiscal years:
2007-08 2006-07
Net Tuition and Fees 128,836$ 119,672$
Grants and Contracts 109,232 90,930
Sales and Services of Auxiliary Enterprises 47,964 47,287
Other 5,382 3,383
Total Operating Revenues
291,414$ 261,272$
Operating Revenues
(In Thousands)
Operating Expenses
Expenses are categorized as operating or nonoperating. The majority of the University’s expenses are operating
expenses as defined by GASB Statement No. 35. GASB gives financial reporting entities the choice of reporting
operating expenses in the functional or natural classifications. The University has chosen to report the expenses in
their natural classification on the statement of revenues, expenses, and changes in net assets and has displayed the
functional classification in the notes to financial statements.
The following summarizes the operating expenses by natural classifications for the 2007-08 and 2006-07 fiscal years:
2007-08 2006-07
Compensation and Employee Benefits 393,017$ 365,944$
Services and Supplies 119,780 113,151
Utilities and Communications
18,103 19,270
Scholarships, Fellowships, and Waivers
49,325 49,008
Depreciation 47,026 41,712
Total Operatin
g
Expenses 627,251$ 589,085$
Operating Expenses
(In Thousands)
Nonoperating Revenues and Expenses
Certain revenue sources that the University relies on to provide funding for operations, including State
appropriations, certain gifts and grants, and investment income, are defined by GASB as nonoperating.
Nonoperating expenses include capital financing costs and other costs related to capital assets. The following
summarizes the University’s nonoperating revenues and expenses for the 2007-08 and 2006-07 fiscal years:
-6-
This is trial version
www.adultpdf.com
MARCH 2009 REPORT NO. 2009-160
2007-08 2006-07
State Appropriations 291,315$ 281,032$
Federal and State Student Financial Aid 88,942 80,248
Investment Income 14,671 14,047
Other Nonoperating Revenues 6,198 8,120
Loss on Disposal of Capital Assets (1,759) (1,031)
Interest on Capital Asset-Related Debt (10,673) (7,879)
Other Nonoperating Expenses (22,128) (27,000)
Net Nonoperating Revenues
366,566$ 347,537$
Nonoperating Revenues (Expenses)
(In Thousands)
Other Revenues, Expenses, Gains, or Losses
This category is mainly composed of capital appropriations and capital grants, contracts, and donations. The
following summarizes the University’s other revenues, expenses, gains, or losses for the 2007-08 and 2006-07 fiscal
years:
2007-08 2006-07
Capital Appropriations 73,145$ 71,127$
Capital Grants, Contracts, and Donations 21,077 1,661
Total
94,222$ 72,788$
Other Revenues, Expenses, Gains, or Losses
(In Thousands)
Capital grants, contracts and donations increased from the prior year primarily due to $17.7 million in donations for
the Burnett School of Biomedical Sciences building.
T
HE STATEMENT OF CASH FLOWS
The statement of cash flows provides information about the University’s financial results by reporting the major
sources and uses of cash and cash equivalents. This statement will assist in evaluating the University’s ability to
generate net cash flows, its ability to meet its financial obligations as they come due, and its need for external
financing. Cash flows from operating activities show the net cash used by the operating activities of the University.
Cash flows from the capital financing activities include all plant funds and related long-term debt activities. Cash
flows from the investing activities show the net source and use of cash related to purchasing or selling investments,
and earning income on those investments. Cash flows from the noncapital financing activities include those
activities not covered in other sections.
-7-
This is trial version
www.adultpdf.com
MARCH 2009 REPORT NO. 2009-160
The following summarizes cash flows for the 2007-08 and 2006-07 fiscal years:
2007-08 2006-07
Cash Provided (Used) by:
Operating Activities (285,911)$ (266,120)$
Noncapital Financing Activities 369,144 344,971
Capital and Related Financing Activities (32,542) 7,716
Investing Activities 22,106 (87,084)
Net Increase
(
Decrease
)
in Cash and Cash Equivalents 72,797 (517)
Cash and Cash Equivalents, Beginning of Year 8,831 9,348
Cash and Cash Equivalents, End of Year 81,628$ 8,831$
Condensed Statement of Cash Flows
(In Thousands)
Major sources of funds came from State appropriations ($291.3 million), net student tuition and fees
($126.8 million), grants and contracts ($109 million), Federal and State student financial aid ($88.9 million), and sales
and services of auxiliary enterprises ($48.2 million).
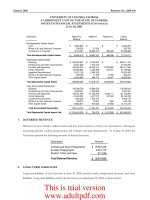
CAPITAL ASSETS, CAPITAL EXPENSES AND COMMITMENTS,
AND DEBT ADMINISTRATION
C
APITAL ASSETS
At June 30, 2008, the University had $1,049.4 million in capital assets, less accumulated depreciation of
$420.6 million, for net capital assets of $628.8 million. Depreciation charges for the current fiscal year totaled
$47 million. The following table summarizes the University’s capital assets, net of accumulated depreciation, at
June 30:
2008 2007
Land 9,685$ 9,685$
Buildings 428,022 437,317
Infrastructure and Other Improvements 32,100 25,733
Furniture and Equipment 52,267 53,694
Library Resources 25,973 24,260
Leasehold Improvements 10,815 9,675
Works of Art and Historical Treasures 434 386
Other Capital Assets 2,147 2,592
Construction in Progress 67,394 8,123
Total Capital Assets, Net
628,837$ 571,465$
Capital Assets, Net at June 30
(In Thousands)
Additional information about the University’s capital assets is presented in the notes to the financial statements.
-8-
This is trial version
www.adultpdf.com
MARCH 2009 REPORT NO. 2009-160
C
APITAL EXPENSES AND COMMITMENTS
Major capital expenses through June 30, 2008, were incurred on the following projects: Burnett Biomedical Science
Center, Physical Science Building, and Medical School. The University’s major capital commitments at
June 30, 2008, are as follows:
Total Commitment 106,740$
Completed to Date (67,394)
Balance Committed
39,346$
Amount
(In Thousands)
Additional information about the University’s capital commitments is presented in the notes to the financial
statements.
D
EBT ADMINISTRATION
As of June 30, 2008, the University had $216.1 million in outstanding bonds and revenue certificates, including
$60 million of bonds attributable to the UCF Finance Corporation, representing a decrease of $7 million, or
3.1 percent, from the prior fiscal year. This decrease is the result of principal payments on current debt. The
following table summarizes the outstanding long-term debt by type for the fiscal years ended June 30:
2008 2007
Bonds 216,091$ 223,095$
Loans and Notes 6,100
Installment Purchases 2,317 543
Other Noncurrent Liabilities 4,403 6,050
Total
228,911$ 229,688$
Long-Term Debt, at June 30
(In Thousands)
Additional information about the University’s long-term debt is presented in the notes to the financial statements.
ECONOMIC FACTORS THAT WILL AFFECT THE FUTURE
During the 2005-06, the Florida State Board of Governors approved plans for a medical school at UCF that will
open in August 2009. The medical school will have a major positive impact on the financial status of the University
of Central Florida.
The condition of the State of Florida’s economy has a direct effect on appropriations for higher education. State
appropriations comprise 37 percent of total revenues (operating, nonoperating, and capital) at the University of
Central Florida and are the largest source of funding. The State is withholding 4 percent of the University’s
appropriations during the 2008-09 fiscal year as a result of the weak economy. The amount withheld may increase at
a later date depending on the economy and legislative decisions.
-9-
This is trial version
www.adultpdf.com
MARCH 2009 REPORT NO. 2009-160
The initial University operating budget adopted by the Florida Legislature for the 2008-09 fiscal year was
$420.3 million which included a $9.2 million appropriation for the new medical school. There was no additional
budget allocated for enrollment growth this year. The amount listed above does not reflect the 4 percent reduction
currently in effect.
REQUESTS FOR INFORMATION
Questions concerning information provided in the MD&A, and financial statements and notes thereto, or requests
for additional financial information should be addressed to the University Controller, University of Central Florida,
12424 Research Parkway, Suite 300, Orlando, Florida 32826-3249.
-10-
This is trial version
www.adultpdf.com
MARCH 2009 REPORT NO. 2009-160
BASIC FINANCIAL STATEMENTS
University Component
Units
ASSETS
Current Assets:
Cash and Cash Equivalents 1,528,714$ 64,765,509$
Restricted Cash and Cash Equivalents 2,284,011
Investments 202,090,083 19,474,226
Restricted Investments 14,782,591
Accounts Receivable, Net 31,864,728 10,437,630
Loans and Notes Receivable, Net 964,886
Due from State 104,809,847
Due from Component Units 1,929,482 1,817,423
Due from University 6,748,884
Inventories 2,214,131
Other Current Assets 309,397 865,374
Total Current Assets
362,777,870 104,109,046
Noncurrent Assets:
Restricted Cash and Cash Equivalents 77,815,693 14,269,062
Restricted Investments 36,795,261 112,552,187
Loans and Notes Receivable, Net 6,968,079 8,672,506
Depreciable Capital Assets, Net 551,463,001 296,689,228
Nondepreciable Capital Assets 77,374,277 52,678,143
Due from Component Units 10,345,852
Other Noncurrent Assets 6,595,009 12,567,669
Total Noncurrent Assets
767,357,172 497,428,795
TOTAL ASSETS
1,130,135,042$ 601,537,841$
LIABILITIES
Current Liabilities:
Accounts Payable 9,573,558$ 12,098,544$
Construction Contracts Payable 20,912,175
Salaries and Wages Payable 16,277,291
Deposits Payable 6,923,112
Due to Component Units 6,748,884 1,817,423
Due to University 1,929,482
Deferred Revenue 18,674,669 9,594,052
Other Current Liabilities 5,386,610
Long-Term Liabilities - Current Portion:
Bonds Payable 7,083,233
Certificates of Participation Payable 4,590,000
Loans and Notes Payable 14,881,479
Installment Purchases Payable 690,485
Capital Leases Payable 34,570
Compensated Absences Payable 2,051,059 92,997
Total Current Liabilities
88,934,466 50,425,157
UNIVERSITY OF CENTRAL FLORIDA
A COMPONENT UNIT OF THE STATE OF FLORIDA
STATEMENT OF NET ASSETS
As of June 30, 2008
-11-
This is trial version
www.adultpdf.com
MARCH 2009 REPORT NO. 2009-160
University Component
Units
LIABILITIES (Continued)
Noncurrent Liabilities:
Bonds Payable 209,007,724$ $
Certificates of Participation Payable 307,006,963
Loans and Notes Payable 6,100,000 23,928,836
Installment Purchases Payable 1,626,733
Capital Leases Payable 64,363
Compensated Absences Payable 27,249,774 557,246
Postemployment Health Care Benefits Payable 2,701,000
Due To University 10,345,852
Other Noncurrent Liabilities 4,403,123 2,225,238
Total Noncurrent Liabilities
251,088,354 344,128,498
TOTAL LIABILITIES
340,022,820 394,553,655
NET ASSETS
Invested in Capital Assets, Net of Related Debt 480,871,291 42,744,171
Restricted for Nonexpendable:
Endowment 103,706,190
Restricted for Expendable:
Debt Service 268,797
Loans 9,783,273
Capital Projects 116,525,744
Other 41,590,726 58,143,985
Unrestricted 141,072,391 2,389,840
TOTAL NET ASSETS 790,112,222 206,984,186
TOTAL LIABILITIES AND NET ASSETS 1,130,135,042$ 601,537,841$
The accompanying notes to financial statements are an integral part of this statement.
UNIVERSITY OF CENTRAL FLORIDA
A COMPONENT UNIT OF THE STATE OF FLORIDA
STATEMENT OF NET ASSETS (Continued)
As of June 30, 2008
-12-
This is trial version
www.adultpdf.com
MARCH 2009 REPORT NO. 2009-160
University Component
Units
REVENUES
Operating Revenues:
Student Tuition and Fees, Net of Scholarship
Allowances of $63,226,673 128,835,729$ $
Federal Grants and Contracts 71,005,211
State and Local Grants and Contracts 20,268,933
Nongovernmental Grants and Contracts 17,957,714
Royalties and Licensing Fees 10,800,582
Gifts and Donations 14,099,080
Sales and Services of Auxiliary Enterprises 47,964,409
Interest on Loans and Notes Receivable 130,920
Other Operating Revenues 5,251,093 58,368,036
Total Operating Revenues 291,414,009 83,267,698
EXPENSES
Operating Expenses:
Compensation and Employee Benefits 393,017,522 11,526,812
Services and Supplies 119,779,617 88,096,152
Utilities and Communications 18,103,566
Scholarships, Fellowships, and Waivers 49,324,636
Depreciation 47,025,821 9,001,362
Total Operating Expenses 627,251,162 108,624,326
Operating Loss (335,837,153) (25,356,628)
NONOPERATING REVENUES (EXPENSES)
State Appropriations 291,315,215
Federal and State Student Financial Aid 88,941,759
Investment Income 14,670,881 3,093,718
Other Nonoperating Revenues 6,198,001 18,304,237
Loss on Disposal of Capital Assets (1,759,396)
Interest on Capital Asset-Related Debt (10,672,994)
Other Nonoperating Expenses (22,127,386) (23,473,329)
Net Nonoperating Revenues (Expenses) 366,566,080 (2,075,374)
Income (Loss) Before Other Revenues, Expenses,
Gains, or Losses 30,728,927 (27,432,002)
Capital Appropriations 73,144,724
Capital Grants, Contracts, and Donations 21,077,745
Additions to Permanent Endowments 10,809,768
Increase (Decrease) in Net Assets 124,951,396 (16,622,234)
Net Assets, Beginning of Year 665,160,826 223,606,420
Net Assets, End of Year 790,112,222$ 206,984,186$
The accompanying notes to financial statements are an integral part of this statement.
UNIVERSITY OF CENTRAL FLORIDA
A COMPONENT UNIT OF THE STATE OF FLORIDA
STATEMENT OF REVENUES, EXPENSES, AND CHANGES IN NET ASSETS
For the Fiscal Year Ended June 30, 2008
-13-
This is trial version
www.adultpdf.com
MARCH 2009 REPORT NO. 2009-160
University
CASH FLOWS FROM OPERATING ACTIVITIES
Tuition and Fees, Net 126,821,645$
Grants and Contracts 108,962,171
Sales and Services of Auxiliary Enterprises 48,156,911
Interest on Loans and Notes Receivable 171,010
Payments to Employees (387,532,890)
Payments to Suppliers for Goods and Services (141,073,504)
Payments to Students for Scholarships and Fellowships (49,324,636)
Net Loans Issued to Students (483,581)
Other Operating Receipts 8,392,010
Net Cash Used by Operating Activities (285,910,864)
CASH FLOWS FROM NONCAPITAL FINANCING ACTIVITIES
State Appropriations 291,315,215
Federal and State Student Financial Aid 88,941,759
Net Change in Funds Held for Others 143,718
Other Nonoperating Disbursements (11,256,834)
Net Cash Provided by Noncapital Financing Activities
369,143,858
CASH FLOWS FROM CAPITAL AND RELATED FINANCING ACTIVITIES
Proceeds from Capital Debt 38,830,000
Capital Appropriations 73,144,724
Capital Grants, Contracts, Donations, and Fees 20,078,115
Capital Subsidies and Transfers (15,226,986)
Other Receipts for Capital Projects 3,316,988
Purchase or Construction of Capital Assets (95,926,509)
Principal Paid on Capital Debt (46,149,386)
Interest Paid on Capital Debt (10,608,770)
Net Cash Used by Capital and Related Financing Activities
(32,541,824)
CASH FLOWS FROM INVESTING ACTIVITIES
Sale of Investments, Net 6,131,418
Investment Income 15,974,776
Net Cash Provided by Investing Activities
22,106,194
Net Increase in Cash and Cash Equivalents
72,797,364
Cash and Cash Equivalents, Beginning of Year 8,831,054
Cash and Cash Equivalents, End of Yea
r
81,628,418$
UNIVERSITY OF CENTRAL FLORIDA
A COMPONENT UNIT OF THE STATE OF FLORIDA
STATEMENT OF CASH FLOWS
For the Fiscal Year Ended June 30, 2008
-14-
This is trial version
www.adultpdf.com