Advanced Biomedical Engineering Part 9 pot
Bạn đang xem bản rút gọn của tài liệu. Xem và tải ngay bản đầy đủ của tài liệu tại đây (1.06 MB, 20 trang )
Semiconductor II-VI Quantum Dots with Interface States and Their Biomedical Applications
151
superlattices and in core/shell QDs by more than 20 cm
-1
(Dinger et al., 1999). The authors
supposed that the Cd-S vibration related Raman peak appeared at 270 cm
-1
, which
downward shifted on 30 cm
-1
from the bulk value of the CdS LO phonon, 305 cm
-1
, due to
the formation of an alloyed layer at the interface between CdSe core and CdS shell.
The interdiffusion during the ZnS shell growth was also assumed for CdSe/ZnS QDs, which
revealed a similar Cd–S mode (Dzhagan et al., 2008). The role of sulfur as an initiator of the
interdiffusion was supported by the fact that the CdS-like peak was observed to be stronger
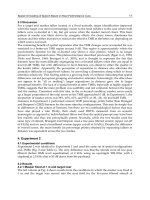
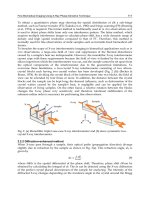
(Fig.7) for the samples where sulfur atoms were deposited first (CdSe/ZnS2). The larger
lattice mismatch for the CdSe/ZnS interface can further stimulate interdiffusion. The red
shift of the CdSe LO phonon peak after passivation (Fig. 7) was explained by the formation
of an intermixed core/shell interface as well. The late effect is accompanied by the
quenching of QD emission intensity.
4. Theoretical analysis of the emission spectra of QDs using mirror boundary
conditions in the quantum mechanical description
To explain the emission spectra of QDs observed, the corresponding system of electronic
energy levels for them should be known. Theoretical analysis of the energy spectra and
optical properties of nanosized semicoinductor sphere was published first in 1982 (Efros &
Efros, 1982), and the discussed core-shell II-VI semiconductor QDs present ideal material for
comparison of theory with experiment.
Fig. 7. Normalized Raman spectra of CdSe and core–shell QDs. Inset: Absorption and PL of
CdSe and CdSe/ZnS QDs (Dzhagan et al., 2008).
Advanced Biomedical Engineering
152
However, during almost two decades of investigation of these objects, no one publication
appeared related to such a comparison. As we shall see, the reason for that is simple: the
calculations performed in (Efros & Efros, 1982; Gaponenko, 1998) predict much larger
energy levels separations than those observed experimentally. We attribute this discrepancy
to the boundary conditions used for description of a spherical QDs in all previous
publications: namely, the traditional “impenetrable walls” boundary conditions. Another
point is that the effective mass approximation normally used in these calculations, could be
questioned in case of nanosized semiconductor particles. We have shown that both the
agreement of theory with experiment and the applicability of the effective mass
approximation could be greatly improved using another type of boundary conditions, as we
call them, even mirror boundary conditions. We assume that a particle (electron) confined
in a QD is specularly reflected by its walls; the assumption is based on the data of STM
(Schmid et al., 2000) showing a clear interference pattern near the surface of a solid created
by incident and reflected de-Broglie waves for an electron; an attempt to treat walls of a
quantum system as mirrors was made previously (Liboff and Greenberd, 2001; Liboff, 1994)
in so-called “quantum billiard” problem; however, the analytical form of the conditions
employed in these papers was different from ours and much more complicated.
In our treatment of QD boundary as a mirror, the boundary condition will equalize values
of particle’s Ψ-function in an arbitrary point inside the QD and the corresponding image
point in respect of mirror-reflective wall. In a general case, one can allow Ψ-functions to
coincide by their absolute value, since the physical meaning of the wave function is
connected to Ψ
*
Ψ. Thus, depending on the sign of the equated values of Ψ, one will obtain
even and odd mirror boundary conditions. For the case of odd boundary condition incident
and reflected waves cancel each other at the boundary, so that one will obtain the case
equivalent to that of impenetrable walls with zero Ψ-function at the boundary, representing
‘‘strong’’ confinement case. However, experimental data (Dabbousi et al., 1997) show that it
is not always so – there is a possibility that a particle may penetrate the barrier, and then
return again into the confined volume. Thus, the wave function will not vanish at the
boundary, and the system will be considered as a ‘‘weak’’ confinement as long as particle
flux through the boundary is absent (Liboff, 1994).
Application of the new boundary conditions for such weak confinement case will yield
solution different from those for QD with impenetrable boundaries. Supposedly, the resulting
energy spectrum would be also different, which may offer better explanation of some
experimental data. Therefore, here the treatment is focused on weak confinement case with
even mirror boundary conditions, which is a timely and very important task that, to our point
of view, will be important for bringing theory and experiment together. In the considered
quantum dot with mirror-reflective boundaries, as a particle (electron, hole) is approaching the
wall from inside, its image will also do so from the outside, meeting with the particle at the
boundary. Due to the specular reflection, the actual particle continues to move along the
trajectory of its image inside the QD whereas the image keeps on moving outside, virtually
expanding a QD into a lattice of reflected cells. Formation of such virtual periodic structure
extension greatly favours the effective mass approximation. Thus, to investigate the specific
features of the problem, we consider only the even form of mirror boundary conditions here.
Assuming the potential inside the quantum box (QD) equal to zero and using the common
variable separation method, we look for a solution of the stationary Schrödinger equation
ΔΨ + k
2
Ψ = 0 (with k
2
= 2mE/ħ
2
and particle mass m) in the form
Semiconductor II-VI Quantum Dots with Interface States and Their Biomedical Applications
153
() ( exp( ) exp( ))
jj j jj j jj
jj
xAikxBikxΨ= Ψ = + −
∏∏
. (1)
Here x
j
describe the coordinates x, y, z and k
j
– the components of wave vector k. For our case
of a spherical QD, following the treatment made in (Efros & Efros, 1982; Gaponenko, 1998) we
apply the common methodology of a particle confined in a three-dimensional square well
potential (for example, Schiff, 1968). The wave function in polar coordinates has a form
Ψ(r,θ,ϕ) = R(r) Υ
l,m
(θ,ϕ) (2)
The angular part Y
l,m
is similar to that of hydrogen atom. The energy spectrum is
determined by solution of the radial part of equation R(r), which is expressed in spherical
Bessel functions of half-odd-integer order for the new variable ρ = α r; for our purposes it
will be sufficient to analyze the first of them
j
0
(ρ) = sinρ/ρ (3)
with ρ/r = α = ħ
-1
(2mE)
1/2
.
For the case of the impenetrable walls of a QD, the boundary condition is sin αr = 0 (for
sphere radius r = a/2 and diameter a). Thus, one will have αa/2 = π n yielding the energy
spectrum (in agreement with (Efros & Efros, 1982; Gaponenko, 1998))
22
22
22
(2 ) , 1,2,3,
28
hh
En nn
ma ma
== =
(4)
Here m is the effective mass of a particle confined in a QD. As one can see, the parameter α
has the meaning of a wave vector, i.e. if we introduce de-Broglie wavelength λ, then α =
2π/λ. The condition obtained a = n λ requires an integer number of wavelengths fit along the
diameter of the sphere.
To introduce the mirror boundary condition, we employ the spherical reflection laws to find
the position “x” of the reflected image of the point characterized with a radius vector “r”
nearby the wall, so that x = 0 and r = 0 will correspond to the centre of a sphere. For the
standard expression for spherical mirror
(r – a/2)
-1
+ (x – a/2)
-1
= – 4/a.
so that
x = a r/(4r – a).
If the particle given by r-value locates in direct vicinity of quantum dot wall, one should set
r = a/2 − δ having δ << a/2. In this case x ≈ a/2 + δ, meaning that at negligibly small
distances between the mirror and the object, a spherical mirror behaves similarly to the
planar one. Under these assumptions, the mirror boundary condition will have the form
Ψ(
α
/2 −δ, θ, ϕ) = Ψ(
α
/2 +δ, θ, ϕ) (5)
Using spherical Bessel functions for the radial eigen-function, we obtain from (5) the
condition cos α a/2 = 0, which gives α a/2 = π(2n + 1)/2, and the energy spectrum
2
2
2
(2 1) , 0,1,2,
8
h
Enn
ma
=+=
(6)
Advanced Biomedical Engineering
154
As one can see, now the diameter of the sphere can include only odd number of half-
wavelengths. This expression is different from the previous one: in (4) we have the
coefficient h
2
/8ma
2
multiplied by squares of even integers, whereas (6) feature the squares of
odd integers only. For large quantum numbers this difference is not essential, but for small
“n” it is pronounced, reaching 400% for the lowest energy state.
Since the form of the energy spectra obtained with mirror boundary conditions does not
differ from that obtained with traditional methodology, we will use the classification of
quantum confinement types for a spherical QDs employed in (Efros & Efros, 1982;
Gaponenko, 1998) and discuss only the strong confinement case with a/2 << a
B
, where a
B
is
the Bohr radius for an exciton:
2
2
B
a
e
ε
μ
=
with reduced mass
()/( )
eh e h
mm m m
μ
=+, electron and hole masses m
e,h
and dielectric
constant of the material ε. Following the argumentation of (Efros & Efros, 1982; Gaponenko,
1998), the current case can be considered as a simplification when one can use the
expressions for energy spectra obtained (4, 6) with the corresponding effective mass m. The
reason for that is that the separation between the quantum levels is of the order ħ
2
/ma
2
,
which is large compared to the Coulomb interaction energy between an electron and a hole
that is proportional to e
2
/εa. Therefore, we can ignore the Coulomb interaction, taking only
the aforementioned energy spectra expressions for the case of quantum confinement effect.
According to (Efros & Efros, 1982; Gaponenko, 1998), the optical absorption threshold for
the spherical semiconductor QD is given by the expression
2
01
2
2
g
h
E
a
ω
μ
=+ (7)
which corresponds to the spectrum (4) with n = 1 for the case of impenetrable walls. For the
spherical quantum well with mirror-reflecting walls we use the expression (6), which for the
optical absorption threshold (n = 0) will yield:
2
01
2
8
g
h
E
a
ω
μ
=+ (8)
Among the great amount of papers devoted to various QDs, not many present the
experimental values of energy levels together with the exact well dimensions. Luckily, such
data can be found for CdSe/ZnS core-shell quantum dots. They are pronouncedly spherical,
with exactly known dimensions and positions of the lower energy levels.
We assume that in these core-shell QDs the carrier reflections conditions are fulfilled at the
CdSe/ZnS boundary, as discontinuity of electrical potential causes reflection of the particle
flux. Thus, one can safely hypothesize the walls of CdSe quantum well could be considered
as effective mirror surface confining the particles.
To compare the experimental data with the theory, we use the following parameters of CdSe
(Gaponenko, 1998; Haus et al., 1993): m
e
/m
o
= 0.13, m
h
/m
o
= 0.45 (m
o
- the free electron mass),
material dielectric constant around 10. For the band gap, we take recently found value of
E
g
= 1.88 eV (Esparsa-Ponce et al., 2009) (while the previous value of 1.84 eV (Gaponenko,
Semiconductor II-VI Quantum Dots with Interface States and Their Biomedical Applications
155
1998; Haus et al., 1993) is also not much different). The reduced mass corresponding to the
effective masses cited is
μ
= 0.1 m
o
, resulting in the Bohr radius for the exciton to be about 5.3
nm. The spherical nanocrystals of CdSe described above featured radii between 1.15 and
2.75 nm, keeping the strong confinement condition valid for all the cases considered.
The Table 1 below summarizes the experimental data on spherical QDs of CdSe together
with the calculated data. The absorption threshold wavelength λ
0
1
for nanocrystals with
diameter a = 2.85 nm was taken from (Hines & Guyot-Sionnest, 1996), the rest of the
experimental data proceed from (Dabbousi, 1997). The photon energy ħω
01
corresponds to
the absorption threshold, which differs by the energy difference ΔE from the band gap (i.e.,
supplying the degree of an actual quantum confinement effect). The values of
ΔE
calc
= ħω
01
− E
g
were calculated after expression (8) for QD with mirror-reflecting walls.
a, nm 2.3 2.85 4.2 4.8 5.5
λ
01
, nm
470 515 555 582 612
ħω
01
, eV 2.64 2.41 2.24 2.13 2.1
ΔE, eV
0.76 0.53 0.36 0.25 0.22
ΔE
calc
, eV (8)
0.72 0.47 0.22 0.17 0.13
Table 1. Comparison of theoretical and experimental data on light absorption in CdSe
nanocrystals
As one can see, the energy values calculated using the expression (8) obtained for mirror-
reflecting walls of a quantum well yields very good correlation with the experimental data,
while the expression (7) obtained for the case of traditional impenetrable wall case gives the
values about 4 times larger.
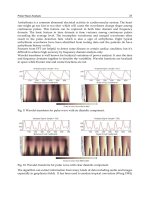
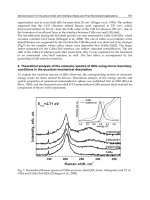
In Fig. 8 we present a data set for CdSe nanocrystals taken from (Invitrogen, 2010), showing
the dependence of emitted photon energy upon well diameter a (curve 1). Curve 2
corresponds to the energy (8), displaying a good agreement with the experimental data.
In our previous publications we have shown that the mirror boundary conditions could be
successfully applied to other geometries of QDs, such as hexagonal, triangular and
pyramidal (Vorobiev et al., 2009; Vorobiev et al., 2010; Vorobiev et al., 2011).
3456
2.0
2.5
hν, eV
a, nm
1
2
Fig. 8. Experimental (1) and calculated (2) exciton energy in CdSe QDs.
Advanced Biomedical Engineering
156
Thus we can conclude that the method used can be considered as a simple and reliable
approach for solution of the Schrödinger equation describing the particles confined in the
semiconductor quantum dots, in particular, for the framework of effective mass
approximation. Our theoretical predictions feature very good agreement with the
experimental data for the spherical CdSe nanocrystals, while the traditional impenetrable wall
approximation yields much overestimated results. The mirror boundary conditions are easy to
implement, which allows simplifying consideration of a large variety of QD geometries and
obtaining analytical expressions for the energy spectra for the different types of nanosystems.
5. The process of QD bioconjugation for imaging, labelling and sensing
As we mentioned above in n.2, the preparation of water-soluble II-VI core/shell QDs is an
important step for many biological applications. QDs, as a rule, can be grown easily in
hydrophobic inorganic solvents (see n.2). Then the methods of solubilisation are applied
based mainly on exchange of the technological hydrophobic surfactant layer with a
hydrophilic one (Bruchez et al., 1998; Gerion et al., 2001; Kim et al., 2003), or the preparation
of a second surface QD layer by the adsorption of bifunctional linker molecules, which
provide both hydrophilic character and functional groups for bioconjugation. In second
method the layers are used, such as: the amphiphilic molecule cyclodextrin (Pellegrino et al.,
2004), chitosan, a natural polymer with one amino group and two hydroxyl groups (Calvo et
al., 1997; Miyzaki et al., 1990), PEG-derivatized phospholipids, encapsulation in
phospholipid micelles (Dubertret et al., 2002), addition of dithiothreitol (Pathak et al., 2001),
organic dendron (Guo et al., 2003; Wang et al., 2002), oligomeric ligands (Kim et al., 2003), or
poly (maleicanhydride alt-1-tetradecene), as well as silica and mercaptopropionic acid
(MPA) (Bruchez et al., 1998; Gerion et al., 2001). MPA achieves the conjugation through
carboxyl groups, and silica through thiol groups on its surface. It is essential that, for
example, phospholipid and block copolymer coatings tend to increase the diameter of
CdSe–ZnS QDs from ~4–8 nm before encapsulation to ~20–30 nm (Chan et al., 1998;
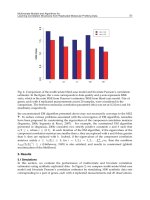
Medintz et al., 2005). Fig. 9 presents the schemes widely used for conjugation of proteins to
QDs (Medintz et al., 2005).
The numbers of steps were used for preparing QDs to bioconjugation: the mixture of QDs
during some time with the bifunctional linker in solution, the extraction from the organic
solvent by centrifugation and re-dissolving QDs in an appropriate conjugation buffer (Chan
et al., 1998). This algorithm was used initially for such linker molecules as: mercaptoacetic
acid, glutathione and histidine, mercaptosuccinic acid, dithiothreitol, and for bifunctional
compounds containing sulfhydryl groups (Aldana et al., 2001; Pathak et al., 2001). The
disadvantage of this procedure is the slow desorption of linker molecules that causes the
QD precipitation and long-term storage problems (Jamieson et al., 2007; Mattoussi et al.,
2000). To improve the long–term stability of biocompatible QDs a set of methods has been
proposed, such as (Jamieson et al., 2007): (a) the use of engineered recombinant proteins
joint electrostatically to a QD surface which were modified with dihydrolipoic acid, (b) the
use of hydrophilic organic dendron ligands to create a hydrophilic shell of QDs, (c) the
application of a micellar encapsulation procedure in which phospholipid molecules
surround the TOPO coated QD surface, and (d) the conjugation of QDs to streptavidin via
an amphiphilic polymer coating. The steady improvement in producing of biocompatible II-
VI QDs made over the past 10 years has contributed essentially to the successful
implementation of these new luminescent markers in biology and medicine.
Semiconductor II-VI Quantum Dots with Interface States and Their Biomedical Applications
157
Fig. 9. A schematic presentation of different approaches of QD conjugation to biomolecules
(Jamieson et al., 2007; Medintz et al., 2005): (a) Use of a bifunctional ligand such as
mercaptoacetic acid for linking QDs to biomolecules. (b) TOPO-capped QDs bound to a
modified acrylic acid polymer by hydrophobic forces. (c) QD solubilisation and
bioconjugation using a mercaptosilane compound. (d) Positively charged biomolecules
linked to negatively charged QDs by electrostatic attraction. (e) Incorporation of QDs into
microbeads and nanobeads.
6. PL spectra of nonconjugated core/shell CdSe/ZnS QDs with interface states
The ability to cover core/shell II-VI QDs with polymers and biomolecules is a critical step,
as we mentioned above, in producing efficient bio-luminescent markers. We have shown
early (Torchynska et al., 2009 a, b and c) that core/shell CdSe/ZnS QDs with radiative
interface state are very promising for the spectroscopic confirmation of the bioconjugation
process. These systems permit to detect both the variation of PL intensity at the
bioconjugation, that ordinary has been monitored, and the transformation of emission
spectra related to the change of a full width at half maximum (FWHM) (Torchynska b and c;
Vega Macotela et al., 2010a) and PL peak positions, as well as the transformation of Raman
scattering spectra (Torchynska et al., 2007; Torchynska et al., 2008; Vega Macotela, 2010b;
Diaz-Cano et al., 2010).
The nature of radiative interface states in the core /shell CdSe/ZnS QDs has to be
investigated. To study the origin of interface states, the PL spectra of CdSe/ZnS QDs
covered by the amine-derivatized PEG polymer with core emission at 525, 565, 605 and 640
nm have been investigated in dependence on the size of CdSe cores. Then PL spectra of 565
and 605 nm QDs have been studied in dependence on a set of factors, such as: i) the size of
CdSe cores, ii) the temperature of PL measurements (10 and 300K), iii) the state of
bioconjugation and iv) the time of aging in ambient air.
Advanced Biomedical Engineering
158
Commercially available core-shell CdSe/ZnS QDs, covered with amine-derivatized
polyethylene glycol (PEG) polymer, are used in a form of colloidal particles diluted in a
phosphate buffer (PBS) with a 1:200 volumetric ratio. Studied QDs are characterized by the
sizes: i) 3.2-3.3 nm with color emission at 525-530 nm (2.34-2.36 eV), ii) 3.6-4.0 nm with color
emission at 560-565 nm (2.19-2.25 eV), ii) 5.2-5.3 nm with emission at 605-610 nm
(2.03-2.08 eV) and iv) 6.3-6.4 nm with color emission at 640-645 nm (1.92-1.94 eV). Some
parts of CdSe/ZnS QDs (named 565P and 605P) were bioconjugated that we will discuss in
next section. Other parts of CdSe/ZnS QDs (named 525N, 565N, 605N and 640N) have been
left nonconjugated and serve as a reference object. Nonconjugated CdSe/ZnS QDs in the
form of a 5 mm size spot were dried on a polished surface of crystalline Si substrates as
described earlier in (Torchynska et al., 2009 a, b and c; Vega Macotela et al., 2010a).
PL spectra were measured at 300 K and some of them at 10 K at the excitation by a He-Cd
laser with a wavelength of 325 nm and a beam power of 20 mW using a PL setup described
in (Torchynska et al., 2009 a, b and c; Vega Macotela et al., 2010a).
0
1
1.5 2.0 2.5 3.0 3.5
0
1
0
1
0
1
565N
300K
x1.0
x7.5
640N
300K
Emission energy, eV
x1.0
605N
300K
PL intensity, arb. un.
d
b
c
x0.7
525N
300K
a
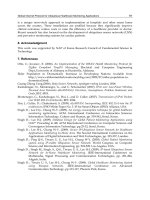
Fig. 10. CdSe/ZnS QDs of different sizes with interface states
Semiconductor II-VI Quantum Dots with Interface States and Their Biomedical Applications
159
Normalized PL spectra of nonconjugated CdSe/ZnS QDs measured at 300 K demonstrate
the broad PL band in the spectral range of 1.80-3.20 eV with a main maximum at 2.37 eV and
with shoulders (or small peaks) (Fig. 10). This broad PL band does not depend on the size of
CdSe QD cores (Fig. 10). It is clear that the broad PL bands are a superposition of elementary
PL bands. The deconvolution procedure has been applied to PL spectra permitting to
represent them as a superposition of five elementary PL bands (Fig. 11a,b). The peaks of
elementary PL bands are at 2.02, 2.17, 2.33, 2.64 and 3.03 eV (Fig. 11a) for 605N QDs and at
1.99, 2.19, 2.35, 2.64 and 3.03 eV (Fig. 11b) for 565N QDs. PL bands with the peaks at 2.02 eV
(605N) and 2.19 eV(565N) relate to emission of ground state excitons in the CdSe cores of
corresponding QDs. The nature of other PL bands needs to be studied.
1.5 2.0 2.5 3.0 3.5
0
1
0
1
Emission energy, eV
565N
300K
1
2
3
4
5
CdSe core
b
605N
300K
PL intensity, arb.un.
1
2
3
4
5
CdSe core
a
Fig. 11. The deconvolution results for 605N QDs (a) and 565N QDs (b)
The high energy PL bands can be assigned to the electron-hole recombination via: i) excited
states in the CdSe core ii) defects in the CdSe core or ZnS shell and/or iii) interface states at the
ZnS/polymer interface. The PL spectrum of nonconjugated (605N) CdSe/ZnS QDs has been
studied at a low temperature (10 K) with the aim to clarify the nature of high energy PL bands
(Fig. 12). As one can see in Fig. 12 the PL spectrum does not change essentially at temperature
decreasing. The result of deconvolution has shown that only the PL band related to a CdSe
core shifts from 2.02 eV (300 K) up to 2.12 eV (10 K) due to increasing the optical band gap in a
CdSe core at 10 K. The temperature variation of CdSe core peak energy was found to be
2.2 10
-4
eV/K that is less than the value obtained earlier (3.3 10
-4
eV/K) for the CdSe/ZnS QDs
(Rusakov et al., 2003) with the thickness of ZnS shell from the range of 0.3-1.7 nm. The last fact
is related, apparently, to the higher thickness of ZnS shell (2 nm) in studied CdSe/ZnS QDs
Advanced Biomedical Engineering
160
(Invitrogen, 2010). Simultaneously the high energy PL bands do not change their spectral
positions that testify that high energy PL bands are not connected with the defect-related states
or excited states in semiconductors (CdSe or ZnS). Thus high energy PL bands can be assigned
to the currier recombination via the interface states at the ZnS/polymer interface.
The permanent position of high energy PL bands in QDs with different CdSe core sizes
(Fig. 10, Fig. 11), the independence of their PL peaks versus temperatures (10 K or 300 K)
(Fig. 12) permit to assign the high energy PL bands to the radiative recombination of
photogenerated carriers via interface states related to the ZnS/polymer interface.
1.5 2.0 2.5 3.0 3.5
0
1
0
1
605N
300K
PL intensity, arb.un.
Emission energy, eV
1
2
3
4
5
CdSe core
1
2
3
4
5
605N
10K
CdSe core
Fig. 12. PL spectra of 605N QDs measured at the temperature of 10 K (a) and 300 K (b).
Fig. 13. The core/shell CdSe/ZnS QD system and the bioconjugation scheme.
Semiconductor II-VI Quantum Dots with Interface States and Their Biomedical Applications
161
7. The PL spectra of bioconjugated core/shell CdSe/ZnS QDs with interface
states
The part of 565 nm CdSe/ZnS QDs has been bioconjugated (named 565P) to the mouse anti
PSA (Prostate-Specific Antigen) antibodies, mAb Z009, Ms IgG2a. The part of 605 nm QDs
has been bioconjugated (605P) to the anti IL10 (Interleukin 10) antibodies, rat IgG2a, clone
JES3-12G8, code MCA2250. At the bioconjugation the commercially available 565 nm and
605 nm QD conjugation kits have been used (Invitrogen, 2010). This kit contains amine-
derivatized PEG polymer coated QDs and the amine-thiol crosslinker SMCC. The
conjugation reaction is based on the efficient coupling of thiols that present in reduced
antibodies, to reactive maleimide groups which exist on the QD surface after the SMCC
activation (Fig. 13). Bioconjugated CdSe/ZnS QDs in the form of a 5 mm size spot were
dried on a polished surface of crystalline Si substrates (Fig. 13).
1.5 2.0 2.5 3.0 3.5
0.0
0.2
0.4
0.6
0.8
1.0
PL intensity, arb. un.
Emission energy, eV
605P
300K
b
x1.5
1.5 2.0 2.5 3.0 3.5
0.0
0.2
0.4
0.6
0.8
1.0
PL intensity, arb. un.
Emission energy, eV
605 N
300K
a
x3.0
Fig. 14. Nonconjugated (a) and bioconjugated (b) 605 nm CdSe/ZnS QDs (Torchynska et al.,
2009b).
Figures 14 and 15 present the PL spectra measured for bioconjugated and nonconjugated
QDs. In fresh bioconjugated 605P (Fig. 14.b) and 565P (Fig. 15.b) samples we can see only
the PL band 2.04 and 2.20 eV, respectively, related to the exciton recombination at ground
Advanced Biomedical Engineering
162
states in the correspondent CdSe cores. The PL intensity of core PL band in 605P QDs
increases at bioconjugation that manifests the change of multiplication coefficients from
x3.0 in 605N QDs to x1.5 in 605P QDs for normalized PL spectra (Fig. 14). In contrary the
PL intensity of core PL band in 565P QDs decreases at bioconjugation that manifests the
change of multiplication coefficients from x2.0 in 565N QDs to x3.0 in 565P QDs for
normalized PL spectra (Fig. 15). The FWHM of QD emission bands decreases at the
bioconjugation in both types of QDs due to disappearing of the high energy PL bands
related to the interface states. This effect was explained in (Torchynska et al., 2009a) on
the base of re-charging of interface states at the QD bioconjugation with anti IL-10
antibodies.
1.5 2.0 2.5 3.0 3.5
0
1
0
1
x2.0
565N
300K
PL intensity, arb.un.
Emission energy, eV
a
x3.0
565N
300K
b
Fig. 15. Nonconjugated (a) and bioconjugated (b) 565 nm CdSe/ZnS QDs (Vega Macotela et
al., 2010a).
8. The model of bioconjugation process for CdSe/ZnS QDs with interface
states
The recombination process in CdSe/ZnS QDs can be considered as the competition of exciton
recombination inside the CdSe core and the hot electron-hole recombination via radiative
interface states (Fig. 16) at the CdSe/ZnS or ZnS/polymer interfaces (Torchynska et al., 2009a).
The interface states (IS), responsible for the hole trapping in non-conjugated QDs, are
negatively charged acceptor-like defects (IS
-
) (Korsunskaya et al., 1980 a, b; Korsunskaya et al.,
1982). Simultaneously, the interface states, responsible for the electron trapping in non-
conjugated QDs, are positively charged donor-like defects (IS
+
). The negative charge of
acceptor-like interface states is due to their compensation by electrons from donor-like
interface states in non-conjugated CdSe/ZnS QDs (Torchynska et al., 2009a).
Semiconductor II-VI Quantum Dots with Interface States and Their Biomedical Applications
163
Fig. 16. The energy diagram of CdSe/ZnS core/shell QDs covered by PEG polymer in the
nonconjugated state. Symbols IS
+
and IS
-
present the charge of donor-like and acceptor-like
interface states, respectively. Dashed lines show the ways of carrier tunneling from the
CdSe/ZnS interface toward the ZnS/polymer interface.
The bioconjugation of proteins with QDs has been achieved through covalent bonds using
functional groups (Fig. 13) on the QD surface (Parak et al., 2002) and/or with the help of
electrostatic interaction (Ji et al., 2005). Actually the distribution of H
+
ions along the chain
axis in antibody molecules is asymmetric (Antibodies, 2009) that is a reason for the
appearance in biomolecules of dipole moments detected at the Raman scattering study (see
n.10). It was supposed in (Torchynska et al., 2009a) that in bioconjugated CdSe/ZnS QDs the
electrons from donor-like interface states accumulate at the QD surface (or in polymer)
where they interact electrostatically with the positively charged antibodies. In this case the
electrons from donor-like states do not compensate the acceptor-like interface states of QDs
(Fig. 17). Simultaneously, the hot electron-hole recombination flow via neutral acceptor-like
interface states decreases dramatically and the PL intensity of exciton emission inside CdSe
core increases. Thus, this model assumes that the QD bio-conjugation process is
accompanied by the re-charging of acceptor-like interface states in QDs (Fig. 17).
Advanced Biomedical Engineering
164
Actually this effect we have seen in Fig. 14 and Fig. 15 presented in this chapter. The PL
intensity of high energy PL bands (2.37, 2.75 and 3.06 eV) related to interface states
decreases tremendous in bioconjugated QDs that can be explained by recharging of interface
states.
9. The aging of CdSe/ZnS QDs with interface states
Normalized PL spectra of nonconjugated CdSe/ZnS QDs measured at 300 K when the QD
kits were obtained (1 day) and after the aging during 30-110 days demonstrate the broad PL
band in the spectral range of 1.80-3.20 eV related to the exciton recombination in the CdSe
core and the electron-hole recombination via the interface states (Fig. 18). The concentration
of interface states increases due to the PEG polymer modification at the aging in ambient air
that leads to the transformation of PL spectra of nonconjugated 605 nm QDs as it is
presented in Fig. 18.
Fig. 17. The energy diagram of CdSe/ZnS QDs covered by polymer in the bioconjugated
state. Symbols IS
+
and IS
0
present the charge of donor-like and acceptor-like interface states,
respectively. Dashed lines show the ways of carrier tunnelling from the CdSe/ZnS interface
toward the ZnS/polymer interface.
Semiconductor II-VI Quantum Dots with Interface States and Their Biomedical Applications
165
1.5 2.0 2.5 3.0 3.5
0
1
0
1
0
1
Emission energy, eV
30days (x15)
and 1 day (x20)
PL intensity, arb.un.
x3.0
90days
605N
300K
x1.1
110days
Fig. 18. PL spectra of 605N QDs measured in 1 day and after the 30, 90 and 110 days of aging
in ambient air. Normalized PL spectra measured at 1 and 30 days coincide, but the
multiplication coefficients are different (x20 for 1 day and x15 for 30 days).
1.5 2.0 2.5 3.0 3.5
0
1
0
1
0
1
Emission energy, eV
30days (x15)
and 1 day (x17)
PL intensity, arb.un.
x1.5
90days
605P
300K
x1
110days
Fig. 19. PL spectra of 605P QDs measured in 1 day and after the 30, 90 and 110 days of aging
in ambient air. Normalized PL spectra measured at 1 and 30 days coincide, but the
multiplication coefficients are different (x17 for 1 day and x15 for 30 days).
Advanced Biomedical Engineering
166
Fig. 19 presents the PL spectra measured in different aging moments (1, 30, 90 and 110 days)
for bioconjugated 605P QDs. In fresh bioconjugated 605P samples (1 day) we can see only
the PL band 2.08 eV related to the exciton recombination at ground states in the CdSe core
(Fig. 19). The PL intensity of this PL band increases essentially at bioconjugation that
manifests the change of multiplication coefficients from x20 in 605N QDs to x17 in 605P QDs
for normalized PL spectra measured in the 1 day (Fig. 18 and Fig. 19). At the aging the
intensity of CdSe core PL band increases (30-110 days Fig. 19) and its peak position shifts to
low energy (red shift) from 2.08 to 2.04 eV. The same coefficients (x15) of PL intensity
enlargement in the nonconjugated 605N (Fig. 18) and bioconjugated 605P (Fig. 19) QDs with
aging during 30-110 days in ambient air testifies that the reason of PL rise on this stage
related to transparency increasing of PEG polymer for visible light (605 nm) at the aging.
Let us discuss the “red” shift of CdSe core emission (Fig. 19) for bioconjugated 605P QDs at
the aging. It is well known that PL spectra of QDs can be influenced by the environment
atmosphere, by thermal annealing or by optical excitation (Nassal et al., 2004). The PL shift
can be a result of optically induced adsorption by polar molecules (Oda et al., 2006), or the
chemical transformation of species on the QD surface (Cordero et al., 2000; Roberti et al.,
1998). This shift can be stimulated by increasing the compressive strain in core/shell QDs at
annealing or drying processes as well (Borkovska et al., 2009). We have seen that in non-
conjugated QDs the polymer modification during aging in ambient air has induced: i) the
enlargement of the concentration of interface states at the ZnS/polymer interface and ii) the
rise of PEG polymer transparency for visible light. The physical aging of polymer is
accompanied by the change of polymer density (Rowe et al., 2009; Shelby et al., 1998) and,
due to this, by the variation of strain level at the ZnS/polymer interface. The last factor may
be the reason of increasing of the concentration of interface states and the appearance of a
red shift of QD emission with aging that has been detected in bioconjugated 605P QDs.
10. Raman scattering spectra of bioconjugated CdSe/ZnS QDs
Additionally to the emission study, other optical methods could give inportant information
concerning the bioconjugated CdSe/ZnS QDs. Earlier we have shown that the study of
Raman scattering of QDs bioconjugated to antibodies can be the powerful technique for the
proof of actual bio-conjugation (Torchynska et al., 2007; Torchynska et al., 2008; Vega
Macotela et al., 2010b; Diaz-Cano et al., 2010). Moreover in n.8 we supposed for the
bioconjugation model of CdSe/ZnS QDs with interface states that antibody molecules are
characterized by the dipole moments. This assumption is possible to confirm using the
Raman scattering method as well.
Commercially available core-shell CdSe/ZnS QDs with emission at 565 nm and 605 nm
were bioconjugated to anti PSA and anti IL-10 antibodies, respectively, as it described in n.7.
Bioconjugated and nonconjugated QDs samples in a shape of small drops were dried on a
surface of crystalline Si substrates (Fig. 14). Raman scattering spectra were measured at 300
K and the excitation by a He-Ne laser with a wavelength of 632.8 nm and a beam power of
20 mW using a setup described in (Torchynska et al., 2007 and 2008).
Fig. 20 and Fig. 21 present the Raman scattering spectra of CdSe/ZnS QDs bioconjugated to
anti IL-10 (605P) and to anti PSA (565P) antibodies, respectively, as well as Raman spectra of
nonconjugated (605N) and (565N) samples, for highest intensity Raman peak at 522 cm
-1
.
This peak related to the optical phonon line in a silicon substrate used for studied QD
samples. The intensity of these Raman peaks in the nonconjugated 605N and 565 N QD
Semiconductor II-VI Quantum Dots with Interface States and Their Biomedical Applications
167
samples is tenfold and threefold smaller than in the bio-conjugated 605P and 565P samples,
respectively.
Fig. 20. The main Raman peak of Si substrate in nonconjugated (a) and bioconjugated (b) 605
nm CdSe/ZnS QD samples (Diaz-Cano et al., 2010).
Fig. 21. The main Raman peak of Si substrate in nonconjugated (a) and bioconjugated
(b) 565 nm CdSe/ZnS QD samples (Vega Macotela et al., 2010b).
In some 605 nm CdSe/ZnS QD samples it is possible to see the enlargement in
bioconjugated states the intensity of Raman lines related to the CdSe core and ZnS shell of
QDs in comparison with nonconjugated 605 nm QD samples (Fig. 22).
Advanced Biomedical Engineering
168
Fig. 22. Raman spectra of a set of nonconjugated (1,2,3) and bioconjugated to anti IL-10 mAb
(4,5,6) 605 nm CdSe/ZnS QDs (Torchynska et al., 2008).
Fig. 23, Fig. 24, Fig. 25 and Fig. 26 present low intensity Raman peaks related to the Si
substrate and obtained in spectral ranges 100-800 and 800-1050 cm
-1
for nonconjugated
(605N and 565N) and bioconjugated (605P and 565P) QD samples. All Raman peaks in the
ranges 100-800 and 800-1050 cm
-1
are characterized by the smaller intensities of Raman lines
in nonconjugated QD samples (605N and 565N) than those in bioconjugated QD samples
(605P and 565P).
Fig. 27 and Fig. 28 present low intensity Raman peaks related to the PEG polymer on the
surface of CdSe/ZnS QDs. These Raman peaks, localized in the spectral range 1050-4000 cm
-1
,
are characterized by different tendencies for the CdSe/ZnS QDs bioconjugated to the anti
IL-10 and to the anti PSA antibodies.To understand obtained Raman results the nature of all
Raman peaks has to be discussed.
The silicon has the diamond crystal structure and, as a result, demonstrates one first-order
Raman active optical phonon of symmetry Г
25
, located at the Brillouin-zone (BZ) center,
with the frequency of 519-522 cm
-1
, Fig. 20 and Fig. 21, Table 2 (Jonson & Loudon, 1964;
Temple &Hathaway, 1973).
The Raman scattering in the region of 0-500 cm
-1
in Si presents overtones of acoustic
phonons. The Raman peaks at 230, 302, 435 and 469 cm
-1
were assigned earlier (Temple
&Hathaway, 1973) to the two TA phonon overtones scattered at L, X and near Σ critical
points, respectively (Table 2). The Table 2 presents the frequencies of optical and acoustical
phonons associated with the critical points of the silicon Brillouin zone. Raman peaks at 610
and 670 cm
-1
in Si were assigned to the two-phonon peaks, which, as assumed, are the
combinations of acoustic and optic phonons in the X and Σ directions (Table 2).
Raman peaks at 236, 308, 441, 620 and 677 cm
-1
have been seen clearly in Raman spectra of
non-conjugated and bio-conjugated QD samples in Fig. 23 and Fig. 24. Note that Raman
peaks related to the CdSe cores (210-212 cm
-1
) and to the ZnS shell (350 cm
-1
) have been
revealed only in some studied 605 nm QD samples (Fig. 22). The later may be the result of
small quantity of 565 nm CdSe/ZnS QD materials.
Semiconductor II-VI Quantum Dots with Interface States and Their Biomedical Applications
169
Fig. 23. Raman spectra of nonconjugated (a) and bioconjugated (b) 605 nm CdSe/ZnS QDs
in the range related to the Si substrate (Diaz-Cano et al., 2010).
Fig. 24. Raman spectra of nonconjugated (a) and bioconjugated (b) 565 nm CdSe/ZnS QDs
in the range related to the Si substrate (Vega Macotela et al., 2010b).
Advanced Biomedical Engineering
170
Critical points of
Si BZ
Phonon frequencies from
(Jonson & Loudon, 1964) (cm
-1
)
Phonon frequencies from
(Temple &Hathaway, 1973) (cm
-1
)
Г (0)
X (TO)
X(TA)
L(TO)
L(TA)
W(TO)
X(TA+TO)
Σ(TA+TO)
522
463
149
491
114
519
460
151
490
113
470
610
670
Table 2. Phonon frequencies at the critical BZ points of Si (Temple &Hathaway, 1973).
The Raman scattering in the 900-1050 cm
-1
region in Si is attributed, as a rule, to overtones of
optical phonons. The sharp increase in the Raman spectrum at 920 cm
-1
or at 940 cm
-1
, the
shoulder at 975 cm
-1
and sharp decrease at 1040 cm
-1
were identified earlier (Temple
&Hathaway, 1973) with the two TO phonon overtone scattering from the critical points at X,
W, L and Г, respectively (Table 2). In studied QD samples, as follows from Fig. 25 and Fig.
26, the Raman peak at 949 cm-
1
and the shoulder at 980 cm
-1
have been detected as well,
which, apparently, related to two TO phonon overtones in Si from the critical points at W
and L. Additionally, a set of small intensity Raman peaks at 837, 860, 1011 and 1039 cm-
1
have been seen as well (Fig. 25 and Fig. 26). In bio-conjugated QD samples the intensity of
Raman peak at 949 cm-
1
and a shoulder at 990 cm
-1
increase (Fig. 25 and Fig. 26). At the
same time, the small intensity Raman peaks 837, 860, 1011 and 1039 cm-
1
have disappeared
(Fig. 25).
Fig. 25. Raman spectra of nonconjugated (a) and bioconjugated (b) 605 nm CdSe/ZnS QDs
(Diaz-Cano et al., 2010).