Biomass and Remote Sensing of Biomass Part 2 potx
Bạn đang xem bản rút gọn của tài liệu. Xem và tải ngay bản đầy đủ của tài liệu tại đây (1.51 MB, 20 trang )
Biomass in Evolving World - Individual’s Point of View
11
trade-off between late fecundity and early fecundity and among early fecundity and
longevity (Tucić et al., 1997).
Clearly, the complexity and dynamic relations between life-histories of organisms and their
environments suggest that allometric patterns evolve in response to numerous selection
pressures and constraints. But, how these processes can influence the ‘behaviour’ of
populations? These problems will be discussed after a short description of mathematical
procedures that are currently used in the analyses of allometry.
3. Allometry analysis
For the adequate empirical and analytical treatment of allometric phenomena in ecological
studies it is important to estimate the relationship between two variables, or, in other words,
to determine how one variable scales against another. Variables represent different
measures of individuals in a sample, such as weight and length of some organismal parts
(organs or modules), multivariate shape or size, number of specific modules (for example,
leaves, stems, flowers, roots in plants), life-history traits (e.g. life span, fecundity, growth
rate, age at first reproduction), metabolic rate (e.g. activity of enzymes, hormones), etc. The
main goal of this approach is to understand the allocation patterns within certain species,
populations and/or environments.
The general ‘allometric equation’ that describes relationship between two variables is
y
x
where
y and x are biological variables, γ is the ‘scaling (proportionality) coefficient’ and α is
‘scaling exponent’.
α and γ parameters describe the functional (mathematical) relation
between x and y.
It can be converted into linear relationship between
x and y if variables are log-transformed,
so the above formula can be reexpressed as
log log log
y
x
or
YX
where substitutions are made: Y=log(
y), X=log(x) and β=log(γ). Now, β is the value of Y
where it intercepts the vertical axis, and
α is equal to the slope of linear function when
plotted on logarithmic scale. The log transformation is useful for several reasons: 1) it allows
the relationship between the two variables to be expressed as a linear relationship, 2) it puts
the variables on a multiplicative or logarithmic scale, which tend to diminish differences
among large numbers and accentuate differences among small numbers, 3) it may transform
frequency distribution of the data into normal distribution, and 4) it reduces statistical
problems resulting from a number of outlying data points.
There are several statistical procedures for finding the line of best fitting through a bivariate
cloud of data – linear regression, major axis, standardized major axis and their
modifications. Several authors (e.g. Niklas, 1994; Bonser & Aarssen, 2001, 2003; Warton et
al.,
2006) proposed standardized major axis (SMA) method (or reduced major axis, RMA) on
log-transformed variables as the most appropriate for allometry analyses. Falster et al.
Biomass and Remote Sensing of Biomass
12
(2003) developed statistical software, (S)MATR, for application of SMA method in studies of
allometry patterns.
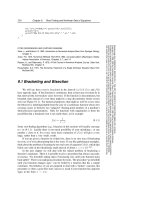
Fig. 2. Illustration of different types of allometric analyses in (S)MATR statistical software
(Falster et al., 2003): (a) test of the isometry (α = 1); (b) testing if slopes of allometric function
are different between groups; (c) testing if elevations are different between groups; (d)
testing for shift along the axis. (After Falster et al., 2003)
SMA methodology is appropriate where there is error in both the
x and y variables of the
regression models and when we are not interested in prediction but to estimate the line-of-
best-fit relating two variables, which is the basic purpose of allometry estimates (Warton et
al., 2006). A significant allometric relationship is indicated where the slope (α) of the
relationship between logarithms of the two variables differs from isometry. An isometric
relationship between biological variables (α = 1) implies that the relative biomass allocation
Biomass in Evolving World - Individual’s Point of View
13
to one organ or function is proportional to the allocation to other organ or function (Figure
2a). The best way to understand isometry and allometry is to imagine that one of the
variables in the allocation analysis is some measure of the size of the whole organisms (for
example, total weight or height). Then, isometry suggests that relative biomass allocation to
specific organ or function is constant for all individual sizes. For example, the size of adult
human heads would be several times greater than it is, if the growth of human fetus would
proceed in isometric fashion. If the relative allocation to some organ or biological function is
greater for larger individuals, than the scaling exponent, or slope of allometric relationships
between the two variables is greater than one (α > 1; Figure 2b). On the other hand, lower
relative investment into one organ during the growth of an organism is detected as a value
of scaling exponent that is less than one (α < 1; Figure 2b). In the experiment on
Lamium
maculatum
(Stojković et al., 2001), the biomass allocation into reproductive organs (flowers)
and roots was generally greater for larger individuals, indicating that high ability of biomass
acquisition was correlated with development of roots and, also, that these plants invested
disproportionately high amount of energy and materials were into future offspring (Table 1,
Figure 1). On the other hand, allocation of biomass into stems was shown to be isometric,
i.e., directly proportional to the weight of other plant organs, whereas investment into
leaves was greater for small plants (Table 1). These patterns of allocation suggested that
when plants compete for the access to light, there was a difference in allometry strategy
between different size classes of individuals – small plants invested more resources to
organs that capture the most limiting resource (light) than larger plants. Allometry analysis
gives the opportunity to answer some more questions about the nature of growth and
differences between groups of organisms. For example, although the relative proportions of
biomass allocated into one organ or biological function may be similar between groups
(have a common allometric slope), two groups can differ in absolute values of biomass
measures. Then, two groups can differ in elevation (i.e., intercepts) of their allometric
function (Figure 2c), or they can diverge along a common axis (Figure 2d). In the study on
L.
maculatum
, for plants with similar sum weights of flowers, roots and stems, the weights of
leaves were significantly lower in competition, especially in the treatment with the most
intense competition. This result indicated that plants in different competition treatment had
different opportunities for acquiring resources. Although, as was noted above, an adaptive
strategy of plants in competition for light (especially for small individuals) may be
allocation into leaves, the difference in average absolute weights (C > S > M) resulted in
observed shift in elevation (Table 1).
Negative value of slope of allometric relationship is particularly important for life-history
studies because it indicates the trade-off between different functions of organisms, for
example between developmental rate and life span, or between fertility and longevity.
4. Individuals versus populations
Many ecological processes in populations and communities may be understood in terms of
size and/or life-history allometric patterns. In other words, the way the individual growth
and life-histories are shaped in certain environment could largely influence the
demographic patterns of a population. For example, changes in life-history schedules of
members of a population can change population demography parameters, such as rate of
population growth and carrying capacity. The trade-off between seed size and seed number
has been used as an explanation for difference in competition and colonization abilities of
Biomass and Remote Sensing of Biomass
14
plant species. As suggested, competitive ability is enhanced by production of fewer, larger
seeds, whereas colonization ability is improved by production of many small seeds
(Turnbull et al., 1999; Levine & Rees, 2002). The members of natural populations often differ
in size and relatedness to each other, which may affect the division of limited resources and
have consequences on reproductive success, changes in the ratio of birth rate/mortality rate,
and influence population growth in different ways (Aikio & Pakkasmaa, 2003).
Here, we explore several theoretical deductions about the relationship between individual
and population level responses to competition intensity, i.e. density.
4.1 The ‘rules’ in plant ecology
“Plant growth is highly plastic, and the mass, height, number of leaves, and reproductive output of an
individual plant can vary over orders of magnitude depending on growth conditions.”
(Gurevitch et
al., 2002)
One of the regularities that were revealed in plant populations regarding competitive
interaction was that the total final dry weight per unit area of all plants in a population is
remarkably consistent over a wide range of densities. In other word, the average individual
plant size became smaller as density increase, but this reduction is in linear relationship
with increasing number of individuals per unit area (Kira et al., 1953). As a final result, total
biomass will be the same for different population densities.
Regularity has been also found in the relationship between the size of a plant population
(density), size of individual plant and mortality rate. For some time, this regularity has been
considered as an ecological ‘law’ or ‘first principle’, and is known as ‘-3/2 self-thinning rule’
(Yoda et al., 1963):
M=kN
-3/2
According to this rule, the average individual plant biomass (M) in a population is
proportional to the -3/2 power of population density (N);
k is a constant that differs among
species. If N increases, M will decrease anisometrically as a consequence of density-dependent
mortality, or ‘self-thinning’. During the growth of seedlings, crowding becomes severe, and
some individuals, usually the smallest and weakest ones, begin to die. The more plants are
crowded the sooner and at smaller individual sizes mortality will begin. As a result, in less
crowded plant populations, individuals may achieve larger sizes than in dense populations.
Although this ‘law’ has been widely accepted until the 1980s, it has become clear that this
scenario was not directly applicable to all populations and plants whose growth scaling is very
complex. In other words, the ‘law’ neglects the plasticity of allocation strategy. Silvertown and
Lovett Doust (1993) argued that this rule may be an upper limit of the relationship.
Another suite of empirical results and theoretical deductions comes from agronomy – the
‘Law of Constant Final Yield’. This rule deals with size-dependent reproductive allocation in
agricultural plant. Total crop biomass increases with density and then levels off, while
reproductive output constantly decreases at higher densities. This is explained by the
expected pattern according to which plants in competition allocate biomass more in
competitive structures and less in reproduction.
All these rules, however, are based on the assumption that population mechanisms
contribute to the maintenance of the
status quo in population dynamics and demography.
Numerous ecological and evolutionary models, nevertheless, explore circumstances and
mechanisms by which populations do change. As noted by Gurevitch et al. (2002), mean
Biomass in Evolving World - Individual’s Point of View
15
plant size can be a misleading measurement in models because individual sizes in plants are
generally extremely uneven as a consequence of plastic growth in asymmetric competition
(Weiner, 1990; Schwinning & Fox, 1995). Largest individuals have disproportionate large
negative effects on their small neighbors, since the relative amount of resources that small
individuals can acquire is less than what could be expected by their biomass. Among a
group of seedlings germinating together, a small advantage in size may confer a large
benefit, i.e., progressively greater inequality in competitive abilities over time. Competitive
asymmetry, which leads to increased individual variability in size, has been seen as one of
the major processes that secure the existence of reproductive individuals, stabilize
population dynamics and assure the persistence of populations (Aikio & Pakkasmaa, 2003).
Under the assumption that there is a size-threshold for reproduction, asymmetry forces
small individuals to decrease in size and to stay below the threshold. Therefore, in the
presence of size-dependent mortality and reproduction, only large individuals remain in the
population and reproduce, assuring population persistence. On the other hand, under
symmetric competition, low variation of individual biomasses increases the possibility that
either all individuals remain smaller than the size-threshold for reproduction or that all
individuals exceed the threshold. This process may cause strong fluctuations in population
size, destabilizes population dynamics (Lomnicki, 1988; Silvertown, 1991; Uchmanski, 2000)
and increase the likelihood of extinction due to demographic stochasticity (Ripa & Lundberg
2000). One of the causes of symmetry in competition is genetic relatedness between
neighboring individuals. Relatedness reduces size variations either because superior large
individuals reduce their resource consumption as an altruistic act towards their smaller
relatives, which, now, exceed the size-threshold for reproduction (kin selection; Hamilton,
1964; Maynard-Smith, 1964), or because relatives have similar environmental preferences
and genetic uniformity, which result in similar growth rates (Jasienski, 1988; Tonsor, 1989).
All these models are strongly based on the premise that reproductive outcome is a linear
function of plant size. Although it is basically true that larger individuals have more seeds, this
premise does not allow for the possibility that plastic allometry may change the proportion of
resources invested into reproduction. As shown in the study on
L. maculatum (Stojković et al.,
2009), relative allocation to reproductive effort could be enhanced in competition, leading to
the decreased effect of asymmetric competition on population dynamics. Also, it was revealed
that
L. maculatum plants grown with genetically identical individuals had higher fitness
compared with plants in unrelated patches. It seems that these relations are common for clonal
plants (Donohue, 2003). In these genetically structured populations, regulation of population
dynamics may include advantageous kin effects. Although there is a possibility that some kin
groups may stay bellow the size-threshold for reproduction, the persistence and stability of
population size could be assured via selection between kin groups.
4.2 Life-history and population dynamics
Using the logistic model of population growth,
dN K N
rN
dt K
where
N is the population size, K is the population’s carrying capacity (i.e., the population
size at which the per capita birth rate equals the per capita death rate), and
r is intrinsic rate
of population growth, MacArthur and Wilson (1967) established the ‘
r / K selection theory’.
This theoretical model, integrated with Pianka’s concept of the evolution of life-history
Biomass and Remote Sensing of Biomass
16
strategies (Pianka, 1970, 1974), proposed a relationship between density-dependent
population regulation and life-history evolution. In spite of numerous critiques and limited
empirical confirmations (see review in Reznick et al., 2002) this model remains one of the
most influential theoretical frameworks for understanding life-history evolution.
Undoubtedly, adaptive changes of life-history traits are related to the density-dependent
adjustment and resource limitation that each population experience. As a consequence,
under density-dependent
vs. density-independent selection individual fitness must be
associated with different traits (Boyce, 1984; Mueller, 1997) and evolved life-history
strategies should differ between populations facing distinct densities. The organisms in
dense populations (i.e., close to the carrying capacity,
K) are exposed to intense competition
and experience density-dependent mortality, which, according to Pianka (1970), determine
adaptive life-history changes toward slow development, delayed reproduction, high
investment in biomass and greater competitive ability at the cost of low reproductive effort,
low fecundity with large investment in each offspring, and high longevity. Contrary, in
sparse populations (or populations inhabiting physically variable and unpredictable
environments), where mortality factors are mainly density-independent, selection would
favor individuals with rapid development, early maturity, high fecundity at the cost of
investment in body size, low investment in each offspring, and shorter life span (Pianka,
1970). The later strategy, which is based on selection for traits that enhance population
growth rate (
r), is also expected in a resource-rich, noncompetitive environment.
Although well elaborated argument for life-history strategies as long-term adaptations to
the environment in a continuum from pure
r- to pure K-selection, this concept contradicts
some basic assumptions about the short-term adaptive responses to competition. In other
words, the plasticity of physiological trade-off may oppose long-term microevolutionary
trade-offs in a population. For example, fast development is usually assumed to be
associated with higher fitness because early hatching/germinated individuals benefit from
more available resources compared with subsequent individuals. Also, due to higher
possibilities for resource acquirement in a noncompetitive environment, one can expect
overall individual performance, i.e., body mass, longevity and total fecundity, to be
advanced compared with individuals in a dense population. The question is to what extent
a long-term selection can limit the ability of single genotypes to plastically change their
allometry strategy in response to environmental variation. Additionally, we may ask what is
the consequence of these processes on population dynamics?
In the laboratory evolution experiments on
Acanthoscelides obtectus two experimental lines
were raised for 200 generations. The
r- and K-selected lines were derived by rearing
populations at persistently low and high densities, respectively. To test the possibility that
plastic responses to the contrasting environmental conditions may oppose long-term life-
history strategies established by density-dependent selection, the samples of beetles from
both lines were reared for one generation either at their common environment (i.e., low
density for the
r- and high density for the K-line) or at the alternate environmental
conditions (i.e., low density for the
K- and high density for the r-line). Most of Pianka’s
predictions on the evolution of life-history strategies under different density conditions
were confirmed in
A. obtectus experimental lines (Stojković & Tucić, unpublished data; but
see Tucić et al. (1997) for contrasting results on these experimental lines after only 73
generation of selection). However, preadult life-history traits (i.e., egg size, preadult
viability and developmental time) were influenced by short-term density conditions. More
importantly, these plastic changes induced by the novel environments (low density for the
Biomass in Evolving World - Individual’s Point of View
17
K- and high density for the r-line) were in opposite directions from the course of selection
for life-history traits within experimental lines. Larval experience of
r- females in dense
conditions resulted in significant increase of investment into the egg dimension. This
strategy may provide an advantage to offspring in competitive interactions. The short-term
relaxation of competition in
K-line enabled opportune investment into fast offspring
development and increase of their viability. These plastic changes in allocation patterns in
K- experimental line resulted in increase of demographic parameters - intrinsic rate of
population growth (
r) and net reproductive rate (Ro). It seems that amplification of per
capita amount of resources at low density allowed the enlargement of carrying capacity in
the
K-line and, consequently, enhanced the opportunities for population growth. In
population ecology it is well known that offspring born in early life-stages contribute more
to the next generation (i.e., to the
r parameter) than offspring born later. Fertility life tables
of
K-females raised for one generation at low density provided the evidence that the age-
specific fecundity schedule was shifted toward earlier days of adulthood with narrow
distribution of fecund days (Stojković & Tucić, unpublished data).
The experiment on rice weevil (
Calandra oryzae) revealed that variations in temperature may
change intrinsic rate of population growth (
r) as a consequence of changes in rate of
development, survival and fecundity (Birch, 1948).
Empirical data have provided excellent demonstration on how variation in survival and
fecundity, as individuals vary in age, size, fecundity schedule or other life-history
characteristics, affects dynamics in population demography.
5. Conclusions
In many ecological models populations are not perceived as being composed of individuals
that vary in all aspects of their phenotype. Evolutionary biology is looking for the
explanations of evolution and development of various organismal traits, but rarely explores
the effects of evolutionary changes on dynamics of populations. The truth is that ecological
processes provide the context for evolution, and, also, that changes in individual variability
affect all population processes in a continuous feedback manner. Allometry, the study of
size-correlated variations in biological form and function, may be seen as a discipline in
which both theoretical programs can meet. Allometry investigates how allocation strategies
evolved and how they can be changed in respect to the environment and characteristics of
populations. Individuals must allocate resources in a way that make the most of their
chances for contributing offspring to the next generation while simultaneously maximizing
their chance of surviving to reproduce. How organisms manage to solve this complex task
depends both on the evolutionary history of a population and on biotic and abiotic
conditions at each point of time. Clearly, the dynamic relations between life-histories and
growth architecture of organisms and their environments suggest that allometric patterns
evolve in response to numerous selection pressures and constraints. At the same time, the
way the individual growth and life-histories are shaped in certain environment could
largely influence the demographic patterns of a population.
6. Acknowledgement
I gratefully acknowledge Nikola Tucić for helpful comments on the manuscript and Oliver
Stojković for his help in graphic presentations. This study was supported by Ministry of
Science and Technological Development of Serbia, project No. 173007.
Biomass and Remote Sensing of Biomass
18
7. References
Aarssen, L.W. (1995). Hypotheses for the evolution of apical dominance in plants:
implications for the interpretation of overcompensation.
Oikos 74: 149-156.
Aikio, S. & Pakkasmaa, S. (2003). Relatedness and competitive asymmetry – implications for
growth and population dynamics.
Oikos 100: 283-290.
Alpert, P. & Simms, E.L. (2002). The relative advantages of plasticity and fixity in different
environments: when is it good for a plant to adjust?
Evolutionary Ecology 16: 285–297.
Ballaré, C.L.; Sánchez, R.A.; Scopel, A.L.; Casal J.J. & Ghersa, C.M. (1987). Early detection of
neighbor plants by phytochrome perception of spectral changes in reflected
sunlight.
Plant Cell Environment 10: 551-553.
Ballare, C.L.; Scopel, A.L. & Sanchez, R.A. (1990). Far-red radiation reflected from adjacent
leaves: an early signal of competition in plant canopies.
Science 247: 329-332.
Begon, M.; Harper, J.L. & Townsend C.R. (1990) Ecology: individuals, populations and
communities.
Blackwell, Boston, MA.
Berrigan, D. (1991). The allometry of egg size and number in insects. Oikos 60: 313-321
Birch, L.C (1948). The intrinsic rate of natural increase of an insect population.
Journal of
Animal Ecology
17: 15-26.
Bonser, S.P. & Aarssen, L.W. (2001). Allometry and plasticity of meristem allocation
throughout development ina
Arabidopsis thaliana. Journal of Ecology 89: 72-79.
Bonser, S.P. & Aarssen, L.W. (2003). Allometry and development in herbaceous plants:
functional responses of meristem allocation to light and nutrient availability.
American Journal of Botany 90: 404-412.
Boyce, M.S. (1984). Restitution of
r- and K-selection as a model of density-dependent natural
selection.
Annual Review of Ecology and Systematics 15: 427-447.
Bradshaw, A.D. (1965). Evolutionary significance of phenotypic plasticity in plants.
Advances
in Genetetics
13: 115-155.
Charlesworth, B. (1994). Evolution in age-structured populations.
2
nd
edition, Cambridge
University Press, Cambridge
Charnov, E.L. & Berrigan, D. (1990). Dimensionless numbers and life history evolution: age
at maturity versus the adult lifespan.
Evolutionary Ecology 4: 273-275.
Cheplick, G.P. (1995). Genotypic variation and plasticity of clonal growth in relation to
nutrient availability in
Amphibromus scabrivalvis. Journal of Ecology 83: 459–468.
Donohue, K. (2003). The influence of neighbor relatedness on multilevel selection in the
Great Lakes sea rocket.
American Naturalist 162: 77-92.
Dudley, S.A. & Schmitt, J. (1996). Testing the adaptive plasticity hypothesis: density
dependent selection on manipulated stem length in
Impatiens capensis. American
Naturalist
147: 445–465.
Falster, D.S.; Warton, D.I. & Wright I.J. (2003). (S)MATR: Standardised Major Axis Tests and
Routines, Version 1.0.
Fox, C.W.; Thakar, M.S. & Mousseau, T.A. (1997). Egg size plasticity in a seed beetle: An
adaptive maternal effect.
American Naturalist 149: 149-163.
Givnish, T.J. (1986). Biomechanical constraints on self-thinning in plant populations.
Journal
of Theoretical Biology
119: 139-146.
Grinell, J. (1917). The niche-relationships of the California thrasher.
The Auk 34: 427-433.
Gurevitch, J.; Scheiner, S.M. & Fox G.A. (2002). The Ecology of Plants.
Sinauer Associates Inc.,
Sunderland, MA
Hamilton, W.D. (1964). The genetical evolution of social behaviour. I & II.
Journal of
Theoretical Biology
7: 1–52.
Biomass in Evolving World - Individual’s Point of View
19
Huxley, J.S. (1932). Problems of relative growth. MacVeagh, London.
Jasienski, M. (1988). Kinship ecology of competition: size hiearchies in kin and non-kin
laboratory cohorts of tadpoles.
Oecologia 77: 407-413.
Kearney, M.; Simpson, S.J.; Raubenheimer, D. & Helmuth B. (2010). Modelling the ecological
niche from functional traits.
Phil. Trans. R. Soc. B. 365: 3469-3483.
Kira, T.; Ogawa, H. & Sinozaki, K. (1953). Intraspecific competition among higher plants. 1.
Competition-density-yield interrelationships in regularly dispersed populations.
Journal of Institute of Polytechnic. Osaka City University D4: 1-16.
Kneitel, J.M. & Chase, J.M. (2004). Trade-offs in community ecology: linking spatial scales
and species coexistence.
Ecology Letters 7: 69-80.
Law, R. (1979). Ecological determinants in the evolution of life histories. In R. M. Anderson,
B. D. Turner and L. R. Taylor, eds. Population Dynamics.
Blackwell Scientific, Oxford,
pp. 81-103.
Levine, J.M. & Rees, M. (2002). Coexistence and relative abundance in annual plant assemblages:
the roles of competition and colonization.
American Naturalist 160:452–67
Lomnicki, A. (1988). Population Ecology of Individuals.
Princeton Univ. Press.
Lovett Doust, L. (1981). Population dynamics and local specialization in a clonal perennial
(
Ranunculus repens). I. The dynamics of ramets in contrasting habitats. Journal of
Ecology
69: 743-755.
MacArthur, R. H. & Wilson E. 0. (1967). The theory of island biogeography.
Princeton Univ.
Press, Princeton
Magwene, P.M. (2001). Comparing ontogenetic trajectories using growth process data.
System. Biology 50: 640-656.
Maynard Smith, J. (1964). Group selection and kin selection.
Nature 201: 1145–1147.
Mueller, L.D. (1997). Theoretical and empirical axamination of density-dependent selection.
Annual Review of Ecology and Systematics 28: 269-288.
Niklas, K. (1994). Plant allometry: the scaling of form and process.
University of Chicago Press,
Chicago
.
O’Connor, R.J. (2000). Why ecology lags behind biology.
Scientist 14: 35.
Peters, R.H. (1983). The ecological implications of body size.
Cambridge University Press,
Cambridge
Pianka, E.R. (1970). On r- and K-Selection.
American Naturalist 104: 592-597
Pianka, E.R. (1974) Niche Overlap and Diffuse Competition.
Proceedings of Natural Academy
of Science,
USA. 71: 2141-2145,
Prati, D. & Schmid, D. (2000). Genetic differentiation of life-history traits within populations
of the clonal plant
Ranunculus reptans. Oikos 90: 442-456.
Reznick, D.; Bryant, M.J. & Bashey, F. (2002)
r- and K-selection revisited: the role of
population regulation in life-history evolution.
Ecology 83: 1509-1520.
Reznick, D. (1985). Cost of reproduction: an evolution of the empirical evidence.
Oikos
44:257-267.
Ripa, J. & Lundberg, P. (2000). The route to extinction in variable environments.
Oikos 90: 89-96.
Roff, D.A. & Fairbairn D.J. (2007). The evolution of trade-offs: where are we?
Journal of
Evolutionary Biology
20: 433–447
Roff, D.A. (2002). Life History Evolution.
Sinauer Associates, Sunderland, MA.
Rose, M. R. (1991). Evolutionary biology of aging.
Oxford Univ. Press, Oxford
Schmid, B. & Weiner, J. (1993). Plastic relationships between reproductive and vegetative
mass in
Solidago altissima. Evolution 47: 61-74.
Schmitt, J. (1997) Is photomorphogenic shade avoidance adaptive? Perspectives from
population biology.
Plant Cell Environment 20: 826-830.
Biomass and Remote Sensing of Biomass
20
Schwinning, S. & Fox, G. A. (1995). Population dynamic consequences of competitive
symmetry in annual plants.
Oikos 72: 422-432.
Schwinning, S. & Weiner J. (1998). Mechanisms determing the degree of size asymmetry in
competition among plants.
Oecologia 113: 447-455.
Silvertown, J.W. & Lovett Doust, L. (1993). Introduction to plant population biology.
Blackwell, Oxford, UK.
Silvertown, J.W. (1991). Modularity, reproductive tresholds and plant population dynamics.
Functional Ecology 5: 577-582.
Smith, H. & Whitelam, G.C. (1997). The shade avoidance syndrome: multiple responses
mediated by multiple phytochromes.
Plant Cell Environment 20: 849-844.
Smith, H.; Casal, J.J. & Jackson, G.M. (1990). Reflection signals and the perception by
phytochrome of the proximity of neighbouring vegetation.
Plant Cell Environment
13: 73-78.
Stearns, S.C. (1992). The evolution of life histories.
Oxford University Press, New York.
Stojković, B.; Barišić-Klisarić, N.; Avramov, S. & Tarasjev, A. (2009). Effect of genetic
relatedness on the allometric relationship between biomass investment and sexual
reproduction in clonal plant.
Polish Journal of Ecology 57: 371-375.
Sultan, S.E. (1995). Phenotypic plasticity and plant adaptation.
Acta Botanica Neerl. 44: 363–383.
Tonsor, S.J. (1989). Relatedness and intraspecific competition in
Plantago lanceolata. American
Naturalist
134: 897–906.
Tucić, B. & Stojković, B. (2001). Shade avoidance syndrome in
Picea omorika seedlings: a
growth-room experiment.
Journal of Evolutionary Biology 14: 444–455.
Tucić, N.; Stojković, O.; Gliksman, I.; Milanović, D. & Šešlija D. (1997). Laboratory Evolution
of Life-History Traits in the Bean Weevil (
Acanthoscelides obtectus): The Effects of
Density-Dependent and Age- Specific Selection.
Evolution 51: 1896-1909.
Tucić, N.; Gliksman, I.; Šešlija, D.; Stojković, O. & Milanović D. (1998). Laboratory Evolution
of Life-History Traits in the Bean Weevil (
Acanthoscelides obtectus): The Effects of
Selection on Developmental Time in Populations with Different Previous History.
Evolution 52: 1713-1725.
Uchmanski, J. (2000) Individual variability and population regulation: an individual-based
approach.
Oikos 90: 539-548.
van Kleunen, M.; Fischer, M. & Schmid, B. (2002). Experimental life-history evolution:
selection on the allocation to sexual reproduction and its plasticity in a clonal plant.
Evolution 56: 2168-2177.
Warton, D.I.; Wright, I.J.; Falster, D.S. & Westoby, M. (2006). Bivariate line-fitting methods
for allometry.
Biological Review 81: 259-291.
Weiner, J. (1990). Asymmetric competition in plant populations.
Trends in Ecology and
Evolution
5: 360-364.
Weiner, J. (2004). Allocation, plasticity and allometry in plants.
Perspectives Plant Ecol. Evol.
Syst
. 6: 207-215.
West-Eberhard, M.J. (1989) Phenotypic plasticity and the origins of diversity.
Annual Review
in Ecology and Systematics
20: 249-278.
Wootton, J. T. (1987). The effects of body mass, phylogeny, habitat, and trophic level on
mammalian age at first reproduction.
Evolution 41: 732-749.
Yoda, K; Kira, T.; Ogawa, H. & Hozumi, K. (1963). Self-thinning in overcrowded pure stands
under cultivated and natural conditions.
Journal of Biology, Osaka City University, 14:
107-129.
Zuk, M. (1996). Trade-offs in parasitology, evolution and behavior.
Parasitology Today 12:46–47.
2
Ecological Aspects of Biomass
Removal in the Localities
Damaged by Air-Pollution
Jiří Novák, Marian Slodičák, David Dušek and Dušan Kacálek
Forestry and Game Management Research Institute, Research Station at Opočno
Czech Republic
1. Introduction
Removal of above-ground biomass is connected with nutrient exclusion from the forest
ecosystem. This aspect is essential mainly in the localities with damage of soil conditions, e.g
in the air-polluted areas. Therefore, quantification of possible biomass removal must be
based on knowledge of current soil conditions (especially forest floor) under forest stands.
We illustrate this problem with the example of the forest stands of substitute tree species,
which were established in the Czech Republic on the sites where the declining spruce
monocultures could not be replaced by ecologically suitable tree species due to continual air
pollution impact and damaged forest soils.
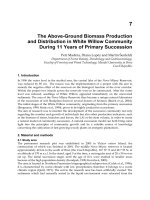
One of the most heavily air-polluted areas since the 1960s of the last century is the Krušné
hory Mts. (figure 1). The Krušné hory Mountains (synonym: The Ore Mts. or Erzgebirge) are
located in Central Europe on the border between the Czech Republic and Saxony, Germany.
These mountains are known as an area where air pollution has had a very severe impact
(Šrámek et al., 2008a). Sulphur dioxide, produced mainly by coal power plants and the
chemical industry, caused extensive decline of forests in the upper part of the Krušné hory
Mountains during the 1970s and 1980s. Therefore, some new tree species, considered to be
more resistant to air pollution, substituted the declining spruce in these areas. The substitute
tree species stands occupied in this place about 36% of forest land area, i.e. about 41
thousand hectares. The largest percentage of this area is covered with birch (Betula sp.) and
blue spruce (Picea pungens Engelm.) or mixtures of these two species. The third species
according to covered area is European larch (Larix decidua Mill.) with more than 6.5
thousand hectares of forest land in the Krušné hory Mts.
Nowadays, substitute stands are due to air pollution decrease in good health condition and
grow well. Consequently, they are now at the beginning of tree species conversion. and the
questions are: Is it possible to remove aboveground biomass for chipping (with respect to
their effects of forest environment, especially in these heavily disturbed localities)?
Presented chapter focuses on the results from above-ground biomass investigation in the
substitute stands of blue spruce, European larch and birch located in the Krušné hory Mts.
Study was completed with the results of investigation of quantity and quality of forest-floor
(humus) horizons and litter-fall under these stands. Possible nutrient loss after removal
above-ground biomass for chipping is discussed.
Biomass and Remote Sensing of Biomass
22
Fig. 1. Location of the Krušné hory Mts. in the frame of Central Europe
2. Material and methods
Presented study is based on long-term observation managed by Forestry and Game
Management Research Institute (Research Station at Opocno) in the Krušné hory Mts.,
Czech Republic. Compilation of our previous studies was completed with unpublished
data. Results from three long-term experiments (table 1) were used for presented study.
These experiments were established in substitute stands of common birch (location Fláje I),
blue spruce (location Fláje II) and European larch (location Kalek) in 1989, 1996 and 1999,
respectively. Experiments consist of partial plots with different thinning regimes but for our
study, only control plots without thinning were used. In the frame of presented study we
evaluate three parts of the biomass (and consequently nutrients) cycle – above-ground
biomass, biomass of forest-floor and annual litter-fall. Detailed information on experiments,
observation methods and periods are mentioned below.
2.1 History of experiments
2.1.1 Blue spruce – experiment Fláje II
Blue spruce is the first of the introduced tree species used for regeneration of clearcuts
induced by air pollution since 1967–1968 in the Krušné hory Mts. (Šika, 1976). In contrast
with the original habitat in the West of the USA where blue spruce creates unclosed mixed
stands, young monocultures (thickets) of blue spruce in the Krušné hory Mts. create closed-
canopy stands with unsatisfactory stability and repeated damage by climatic factors (mainly
top breaks or windfalls, frost damage, etc.). Deformations and damage of the root system
are frequent as well. Furthermore, an adverse effect of blue spruce stands on the forest soil
was observed (Podrázský et al., 2003). On the other hand, the present blue spruce stands
comply with the main objectives of cultivation of substitute tree species stands, i.e. they
create more favourable microclimatic conditions for the gradual regeneration of forest
stands by target tree species (Balcar & Kacálek, 2003).
Thinning experiment Fláje II was established in 1996 (Slodičák & Novák 2001, 2008). The
blue spruce stand is situated on a south-facing gentle slope, 770 m above sea level in the
Ecological Aspects of Biomass Removal in the Localities Damaged by Air-Pollution
23
spruce (8
th
) forest vegetation zone (Piceetum acidophilum – Avenella flexuosa according to
Viewegh et al., 2003, table 1). The soil type was classified as cambisol modal oligotrophic.
Mean annual temperature is 5.5-6.0°C; the mean sum of precipitation is ca 900 mm (for the
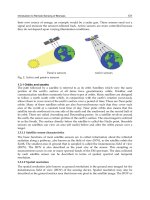
period of 1961–2000). An experimental blue spruce stand was established by mound
planting at initial spacing 2 × 2 m – 2,500 trees per ha (figure 2).
Species Location
Elevation
(m)
Forest site according
to Viewegh et al.
(2003)
Mensurational characteristics of the stands
Age and year
of
measurement
N
(trees.ha
-1
)
G
(m
2
.ha
-1
)
d
(cm)
h
(m)
Blue spruce
50°41´53´´
13°37´52´´
770
Piceetum acidophilum –
Avenella flexuosa
22 years
(2006)
2 022 17.7 10.2 5.7
European
larch
50°35´11´´
13°21´11´´
780
Piceeto-Fagetum oligo-
mesotrophicum –
Calamagrostis villosa
20 years
(2007)
2 140 27.8 12.0 10.8
Common
birch
50°41´38´´
13°35´20´´
800
Fageto-Piceetum
acidophilum –
Calamagrostis villosa
22 years
(2003)
1 725 10.9 8.5 9.1
Table 1. Basic data about long-term experiments Fláje II (blue spruce), Kalek (European
larch) and Fláje I (common birch) in the Krušné hory Mts.
The experimental series consists of three comparative plots 0.1 ha in size. Ecological aspects
of biomass removal were studied on the control plot without thinning. The experimental
stands have been measured (diameter at breast height, height, health condition) annually
since 1996. The crown area covered 91% of the stand area at the age of 16 years in 2000. Full
coverage of land by crowns (full canopy) was attained in the vegetation period 2001 (Novák
& Slodičák 2006a). During the period of investigation, the number of trees on the control
plot was practically unchanged (2,078–2,022 trees.ha
-1
). Basal area on the control plot
increased approximately six times during the period of observation from 2.8 to 17.7 m
2
.ha
-1
(at the age of 12–22 years).
Fig. 2. Control unmanaged plots in experimental forest stands in August 2003 – blue spruce 19-
year-old (left), European larch 16-year-old (middle) and common birch 22-year-old (right).
Biomass and Remote Sensing of Biomass
24
Above-ground biomass was studied in August 2006 when the stand was 22-year-old
(Slodičák & Novák 2008, table 2). Forest-floor investigation was done in October 2002
(Ulbrichová et al., 2005). Litter-fall was collected 5 years from October 2002 to October 2007
(age of 18-23 years) in this experiment.
Species
Observation (sampling)
Above-ground
biomass
Forest-floor biomass
Litter-fall
Age (years)
Year Age (years)
Year Age (years) Year
Blue spruce 22 Aug 2006
18 Oct 2002
18 - 23
Oct 2002 –
Oct 2007
European larch 20 Aug 2007
19 Oct 2006
16 - 19
Aug 2003 –
May 2007
Common birch 22 2003* 21 Oct 2002
22 - 25
Sept 2003 –
May 2007
Table 2. Summary of observations included in presented study in substitute stands of blue
spruce, larch and birch in the Krušné hory Mts. *Above-ground biomass was calculated for
this year and age by published equations (see methods).
2.1.2 European larch – experiment Kalek
In the Krušné hory Mts., larch is referred to as a target tree species in the beech with spruce
(6
th
) forest vegetation zone and as a transition from target to substitute tree species in the
spruce with beech (7
th
) forest vegetation zone. As a rule, the larch stands are not envisaged
to be subjected to stand conversion and, therefore, proper attention must be paid to their
tending.
Thinning experiment Kalek was established in 1999 to investigate the tending of young larch
stands in the Krušné hory Mts. (Novák & Slodičák 2006b). The stand is located in the beech
with spruce (6
th
) forest vegetation zone at an elevation of 780 m a.s.l. in the fresh, medium-
nutritive category (Piceeto-Fagetum oligo-mesotrophicum – Calamagrostis villosa according to
Viewegh et al. 2003, table 1). The soil type was classified as Entic Podzol. Mean annual
temperature is 5.5-6.0°C; the mean sum of precipitation is ca 800 mm (for the period of 1961–
2000).
An experimental larch stand was established by line planting (at initial spacing 1 × 1.5 m –
6,667 trees per ha) after mechanical raking of slash to windrows (figure 2), i.e. planted area
was practically without former forest-floor. The experimental series consists of four
comparative plots 0.04–0.05 ha in size. Ecological aspects of biomass removal were studied
on the control plot without thinning. The experimental stands have been measured
(diameter at breast height, height, health condition) annually since 1999.
In the period of investigation (2000–2007, age of 13–20 years), the number of trees decreased
from 3,400 to 2,280 trees.ha
–1
(33%) by salvage cutting in control unthinned plot. Basal area
in control plot increased approximately twice in the period of observation (from 14.3 to
28.6 m
2
·ha
–1
at the age of 13–20 years).
Above-ground biomass was studied in August 2007 when the stand was 20-year-old (Novák
et al., 2011, table 2). Forest-floor investigation was done in October 2006. Litter-fall was
collected 4 years from August 2003 to May 2007 (age of 16-19 years) in this experiment.
Ecological Aspects of Biomass Removal in the Localities Damaged by Air-Pollution
25
2.1.3 Common birch – experiment Fláje I
Thinning experiment Fláje I was established in 1989 to investigate the tending of substitute
birch stands in the Krušné hory Mts. (Slodičák & Novák 2001). The stand is located on the
south-facing slope in the spruce with beech (7
th
) forest vegetation zone at an elevation of 800
m a.s.l. in the acid category (Fageto-Piceetum acidophilum – Calamagrostis villosa according to
Viewegh et al. 2003, table 1). The soil type was classified as cambic leptosol. Mean annual
temperature is 5.5-6.0°C; the mean sum of precipitation is ca 900 mm (for the period of 1961–
2000).
An experimental birch stand was established by seeding (figure 2). The experimental series
consists of four comparative plots 0.04–0.10 ha in size. Ecological aspects of biomass
removal were studied in the control plot without thinning. The experimental stands have
been measured (diameter at breast height, height, health condition) annually since 1990.
In the period of investigation (1990–2003, age of 9–22 years), the number of trees decreased
from 8,825 to 1,725 trees.ha
–1
(80%) by salvage cutting in control unthinned plot. Basal area
in control plot increased approximately twice in the period of observation (from 5.8 to 10.9
m
2
·ha
–1
at the age of 9–22 years).
Above-ground biomass was calculated (see below) for year 2003 when the stand was 22-
year-old, table 2). Forest-floor investigation was done in October 2002 (Ulbrichová et al.,
2005). Litter-fall was collected 4 years from September 2003 to May 2007 (age of 22-25 years)
in this experiment.
2.2 Above-ground biomass investigation
As for blue spruce and European larch stands above-ground biomass was evaluated using
previous studies (Slodičák & Novák, 2008, Novák et al., 2011), which were done by
destructive analysis directly in mentioned experiments. Above-ground biomass was
observed quantitatively (dry mass – total and by particular fractions) and qualitatively
(amount of nutrients). Detailed methods are described in the mentioned studies.
Birch stand was not observed by detailed study of above-ground biomass. Therefore total
above-ground biomass was calculated using known diameter structure at the age of 22 years
(2003) and published equations (Varik et al., 2009) for 14-year-old birch stand with similar
mensurational parametres:
Y = 121.59 × d
2.376
(1)
where Y is the amount of dry mass (in g) and d is diameter at breast height 1.3 m (in cm).
Quality of above-ground biomass (amount of nutrients) was not calculated for this tree
species.
2.3 Forest-floor investigation
Forest-floor layers were observed directly in the experiments. Results from blue spruce and
birch (sampling in October 2002) were published by Ulbrichová et al. (2005). Investigation in
larch stand was done in October 2006 and the results are still unpublished. The uniform
methods were used in all observed stands.
The samples were collected using steel frames (25x25 cm) to define sampling areas at four
replications in all plots. Forest-floor humus horizons (L = fresh litter including herbal
vegetation, F = fermented litter and H = humified litter) were investigated quantitatively
and qualitatively.
Biomass and Remote Sensing of Biomass
26
All samples were dried, first under conditions of open air, later in a laboratory oven at 70°C,
and dry samples were subsequently weighed. Nutrient content was assessed from
composite samples from each layer (after mineralization by mineral acids). Total Nitrogen
(N) concentration was analyzed by Kjehldahl procedure and Phosphorus (P) concentration
was determined colorimetrically. An atomic absorption spectrophotometer was used to
determine total Potassium (K) concentration by flame emission, and Calcium (Ca) and
Magnesium (Mg) by atomic absorption after addition of La. Nitrogen content was assessed
from composite samples (three per treatment) after mineralization by mineral acids and
analysed using Kjeldahl procedure.
2.4 Litter-fall investigation
Litter-fall was collected using three steel litter collectors with an individual area of 0.25 m
2
(birch and larch) or 0,50 m
2
(blue spruce) installed within each of observed stands. The
samples were taken twice to fourth times per year during the period of observation (table 2).
All samples were dried, first under conditions of open air, later in a laboratory oven at 70°C,
and dry samples were subsequently weighed. Nutrient content was assessed from
composite samples from each sampling. As for forest-floor layers, the same laboratory
methods for nutrient content investigation were used (see chapter 2.3). We calculate annual
litter-fall (quantitatively and qualitatively) for individual stands and periods of observation.
3. Results and discussion
3.1 Quantity of biomass
3.1.1 Above-ground biomass
We found that 20-22-year-old substitute stands contain per hectare from 40.3 to 102.2 t of
above-ground (dry) biomass (figure 3). The lowest amount of above-ground biomass was
observed in birch stand (40,270 kg.ha
-1
). Biomass accumulated in above-ground part of blue
spruce stand was about 40% higher (56,237 kg.ha
-1
). The highest amount (about 154%
compared to birch stand) was found in the larch stand (102,215 kg.ha
-1
). These results
correspond with forest site classification in observed experiments. Lower vegetation zone
(6
th
– Piceto-Fagetum) in larch stand means better growth conditions compared to higher
vegetation zone (8
th
– Piceetum) in birch stand. For example, Li et al. (2003) found a
relationship between aboveground biomass and elevation in larch stands, Tyrol (Austria).
European larch stands (27-years-old) situated at the elevation of 1,680, 1,810 and 1,940 m
showed aboveground biomass (without stumps) 135 t, 61 t and 20 t per hectare, respectively.
In literature, total aboveground biomass of larch stands ranges from 80 t.ha
–1
in 50-60-years-
old stand (Young et al., 1980, as cited in Burrows et al., 2003), 158 t.ha
–1
in 28-years-old stand
(Komlenović, 1998) to 216 t.ha
–1
in 35-36-years-old stand (Eriksson & Rosen, 1994).
For common birch, above-ground biomass shows also a wide range of published results:
31 t.ha
-1
for 8-year-old stand (Uri et al., 2009), 20-66 t.ha
-1
(on fine sand) and 31-53 t.ha
-1
(on
clay soil) for 12-year-old stand (Johansson, 2007) and 40 t.ha
-1
for 14-year-old stand (Varik et
al., 2009).
For blue spruce similar data was not published in the Czech Republic. We can compare it only
with similar studies in young Norway spruce (Picea abies [L.] Karst.) stands. Results of these
studies showed higher values of aboveground biomass of Norway spruce stands – 14-year-old
stand ca 65 t.ha
-1
(Chroust, 1993), 20-years-old stand ca 85 t.ha
-1
(Chroust & Tesařová 1985) or
24-years-old stand ca 79 t.ha
-1
(Vyskot, 1980). The difference is caused mainly by stand density
Ecological Aspects of Biomass Removal in the Localities Damaged by Air-Pollution
27
and consequently by different characteristics of mean stem. Generally, the mean stem of blue
spruce stand was shorter, but thicker than the mean stem of Norway spruce.
85,276
39,883
160,132
56,237
102,215
40,270
0
20
40
60
80
100
120
140
160
180
200
220
Blue
spruce
European
larch
Common
birch
Dry mass (tons per ha)
Total above-ground
biomass
Forest-floor biomass
Fig. 3. Amount of above-ground and forest-floor biomass by species.
Despite the former and current air-pollution load (for all species) and raking of forest floor
before planting (for larch), the amount of aboveground biomass produced by 20-22-year-old
substitute stands of blue spruce, larch and birch is comparable with the results observed in
corresponding stands on the other undisturbed sites.
3.1.2 Forest-floor
Dry-weight of forest-floor is undoubtedly influenced by history before planting (or seeding).
Larch stand was planted on site without former humus layers (see methods) and
consequently, amount of dry mass in humus horizons (L+F+H) under 19-year-old stand was
small (39,883 kg.ha
-1
) compared to other species (figure 3).
Humus horizons under 18-year-old blue spruce stand contained about 114% higher amount
of dry mass (85,276 kg.ha
-1
) compared to larch stand. The highest amount of dry mass was
observed in humus horizons under 21-year-old birch stand (160,132 kg.ha
-1
).
Under both blue spruce and birch stands, part of current humus layers is inherited from
previous (probably Norway spruce) stands. Additionally, high stock of dry-mass in humus
layers under birch may be caused by worse climatic conditions (lower temperatures) of 8
th
vegetation zone, i.e. slower process of decomposition.
We can compare these results with previous studies from Norway spruce monocultures,
which were common in the Krušné hory Mts. before substitute stands. Humus horizons
(L+F+H) under 30-35-year-old Norway spruce stands in similar growth conditions (6-7
th
Biomass and Remote Sensing of Biomass
28
forest vegetation zone) contain per hectare from 195 t (Novák & Slodičák, 2004) to 202 t
(Dušek et al., 2009) of dry mass. These stands were located on continually forest soil without
site preparation before planting. Therefore, it mainly corresponds with results from birch
stand, because of similar site and soil conditions.
3.1.3 Litter-fall
We found that annual litter-fall in young substitute stands reaches 2-5 t.ha
-1
(figure 4). The
lowest annual litter-fall was observed under 22-25-year-old birch stand (2,317 kg.ha
-1
).
Approximately two times higher amount of annual litter-fall was found under blue spruce
(4,923 kg.ha
-1
) and larch (4,216 kg.ha
-1
) stand.
There is possibility to compare these results with studies from Norway spruce
monocultures. Observed values of mean annual litter-fall (2-5 t.ha
-1
) correspond to range of
values 1.1 – 5.7 t.ha
-1
reported by many authors (Bille-Hansen & Hansen, 2001, Berg &
Meentemeyer, 2001, Novak & Slodicak, 2004, Hansen et al., 2009).
4,923
4,216
2,317
0
1
2
3
4
5
6
Blue
spruce
European
larch
Common
birch
Dry mass (tons per ha)
Fig. 4. Annual litter-fall in young substitute stands in the Krušné hory Mts. (means with
standard deviations)
3.2 Quality of biomass
Amounts of main nutrients (N, P, K, Ca, Mg) in the individual parts of biomass cycle were
compared for all three observed stands (table 3).
3.2.1 Blue spruce
Under blue spruce stand forest-floor contains per hectare about 1,082 kg of N, 86 kg of P,
176 kg of K, 22 kg of Ca and Mg. Total amount of Nitrogen (336 kg.ha
-1
), Phosphorus (28
Ecological Aspects of Biomass Removal in the Localities Damaged by Air-Pollution
29
kg.ha
-1
) and Pottassium (138 kg.ha
-1
) was lower (about 69%, 67% and 22%, respectively) in
above-ground biomass compared to forest-floor. On the other hand, above-ground
biomass contains strongly higher amount of Ca (about 612%) and Mg (28%) compared to
forest-floor.
Totally 48 kg of N, 3 kg of P, 4 kg of K, 42 kg of Ca and 2 kg of Mg was returned by annual
litter-fall under observed blue spruce stand. For N, P, K and Mg it represents only about 2-
7% of amount accumulated in forest floor. In the case of Ca we found higher amount of this
nutrient (about 87%) in annual litter-fall compared to amount in forest-floor.
Thus, removal of above-ground biomass of observed blue spruce stand (totally or partly by
thinning) may result in nutrient losses, especially Ca and Mg because of their low content in
forest soil compared to content in above-ground biomass.
Species Part of ecosystem
Nutrients (kg per hectare)
N P K Ca Mg
Blue
spruce
Above-ground biomass 335.5
28.3
138.3
158.7
27.8
Forest-floor 1082.3
85.9
176.4
22.3
21.7
Annual litter-fall 48.0
2.9
4.4
41.8
1.5
European
larch
Above-ground biomass 307.0
21.0
136.0
122.0
53.0
Forest-floor 383.9
23.4
195.8
50.3
135.9
Annual litter-fall 52.6
3.8
5.3
17.7
7.9
Common
birch
Above-ground biomass No data
Forest-floor 2026.2
123.5
373.6
72.8
51.6
Annual litter-fall 39.4
2.2
2.7
5.5
1.8
Table 3. Nutrient content in above-ground biomass, forest-floor and annual litter-fall by
species.
3.2.2 European larch
Forest-floor contains per hectare about 384 kg of N, 23 kg of P, 196 kg of K, 50 kg of Ca and
136 kg of Mg under larch stand (table 3). Similarly as in blue spruce stands total amount of
Nitrogen (307 kg.ha
-1
), Phosphorus (21 kg.ha
-1
) and Pottassium (136 kg.ha
-1
) was lower
(about 20%, 10% and 31%, respectively) in above-ground biomass compared to forest-floor.
Amount of Mg (53 kg.ha
-1
) was obviously lower (about 61%) in above-ground biomass
compared to forest floor. On the other hand, above-ground biomass contains higher amount
of Calcium (about 143%) compared to forest-floor.
Totally 53 kg of N, 4 kg of P, 5 kg of K, 18 kg of Ca and 8 kg of Mg was returned by annual
litter-fall under observed larch stand. For K and Mg it represents only about 3 and 6% of
amount accumulated in forest-floor. Annual litter-fall contains about 14, 16 and 35% of N, P
and Ca, respectively, compared to amount of these nutrients stored in forest-floor.
Biomass and Remote Sensing of Biomass
30
There are two general aspects in the case of nutrient status in observed larch stand. First, in
contrast to blue spruce and birch stand, larch stand was established by planting on nearly
mineral soil, when former forest-floor was almost completely removed after mechanical
raking of slash to rows. It means that current forest-floor is a result only of litter-fall
accumulation and decomposition during the age of current stand.
Second aspect is former liming management in the Krušné hory Mts., especially where
experimental larch stand is located. The dolomite with increased amount of Mg (minimum
amount of MgO is 17%) was used for liming (about 3 t.ha
-1
) in the past. Last aerial
application was done in mentioned locality in 2006 (Šrámek et al., 2008b).
Whilst the amount of Mg is high (mainly due to previous liming) in forest floor under
observed larch stand, we cannot recommend removal of above-ground biomass mainly
because of possible losses of Ca, which is highly represented in above-ground biomass and
consequently in litter-fall. In the detailed study (Novák & Slodičák, 2011) we found, that
more than 50% of Ca amount in above-ground biomass is stored in needles and branches.
Therefore, we can recommend utilisation of larch stems only for chipping in the framework
of thinning. Other aboveground biomass (mainly needles and branches) should be left in a
forest ecosystem for decomposition.
3.2.3 Common birch
Under birch stand forest-floor contains per hectare about 2 026 kg of N, 124 kg of P, 374 kg
of K, 73 kg of Ca and 52 kg of Mg. Above-ground biomass for birch stand was calculated by
published equations (Varik et al., 2009) by real diameter distribution because we do not
have data from exact study of above-ground biomass in observed birch stand. Mentioned
equation was used for dry mass calculation only because we knew that each allometric
equation did not compare favourably with other equations available in the literature and we
agree with the recommendation of Gower et al. (1987), who suggested that discretion must
be exercised when applying regression equations to other areas than where they were
developed. Thus, amount of nutrients in above-ground biomass was not calculated for this
species.
Totally 39 kg of N, 2 kg of P, 3 kg of K, 6 kg of Ca and 2 kg of Mg was returned by annual
litter-fall under observed birch stand. For N, P, K and Mg it represents only about 1-3% of
amount accumulated in forest floor. On the other hand, annual litter-fall contains about 8%
of Ca compared to amount of these nutrients stored in forest-floor.
Summary of the results from birch stand is influenced by unknown amount of nutrients in
above-ground biomass. However, on the basis of forest-floor and litter-fall observations we
can conclude that removal of above-ground biomass may be possible because of relatively
good amount of nutrients in forest-floor, which partly consists of humus accumulated under
previous (Norway spruce) stand. On the other hand dry-mass of above-ground biomass is
relatively low (about 40 t.ha
-1
) and probably economically unfavourable. Furthermore, high
mortality was found since 2003 in observed birch stand (Novák & Slodičák, 2006a).
4. Conclusion
Management of biomass removal in forests should be connected with knowledge about
nutrient cycle in the forest ecosystem mainly in the localities with damaged soils.