Biomass and Remote Sensing of Biomass Part 7 docx
Bạn đang xem bản rút gọn của tài liệu. Xem và tải ngay bản đầy đủ của tài liệu tại đây (1000.01 KB, 20 trang )
7
The Above-Ground Biomass Production
and Distribution in White Willow Community
During 11 Years of Primary Succession
Petr Maděra, Diana Lopéz and Martin Šenfeldr
Department of Forest Botany, Dendrology and Geobiocoenology,
Faculty of Forestry and Wood Technology, Mendel University in Brno
Czech Republic
1. Introduction
In 1996 the water level in the studied area, the central lake of the Nove Mlyny Reservoir,
was reduced by 85 cm. The reason was the implementation of a project with the aim to
remedy the negative effect of the reservoir on the biological function of the river corridor.
Within the project two islands across the reservoir were to be constructed. After the water
level was reduced, seedlings of White Willow appeared immediately on the uncovered
sediments. The area of the Nove Mlyny Reservoir thus became a unique natural laboratory
of the succession of soft floodplain forest in several dozens of hectares (Buček et al., 2004).
The initial stages of the White Willow community, originating from the primary succession
(Bergmann, 1999; Matic et al., 1999), prove to be highly productive ecosystems.
The aim of research was to monitor the development of the successive community not only
regarding the number and growth of individuals but also other production indicators, such
as the biomass of stems, branches and leaves, the LAI or the stem volume, in order to create
a natural model of community succession. A natural succession model can both bring some
light into the principles of community growth and be a suitable source of knowledge
concerning the cultivation of fast-growing woody plants on energetic plantations.
2. Material and methods
2.1 Study area
The permanent research plot was established in 2005 in Vlckuv ostrov Island, the
construction of which was finished in 2001. The middle Nove Mlyny reservoir is located
approximately 40 km to the south of Brno (the Czech Republic), 16
O
37´ E and 48
O
55 N, at
an altitude of 170 m a.s.l. In the stand, aged 5 at the time, a rectangular area of 20 x 50 m was
set up. The initial succession stages until the age of five were studied in smaller areas
because of the high population density (Konůpek, 1998; Kovářová, 2003).
The area is located in Northern Pannonian biogeographical subprovince (Culek et al., 1996);
it is characterized by warm climate with low precipitation, therefore it belongs to a warm
climatic region (Quitt, 1971). The soil in the research area has been artificially created. The
sediments which had naturally sorted in the liquid environment were relocated from the
Biomass and Remote Sensing of Biomass
112
reservoir bottom to the middle of the artificially created island embankments by suction
dredgers. The upper horizon contains loamy particles, after 15-20 cm these are sandy. With
the reservoir water permanent storage quota of 170 m a.s.l. the surface of ground water is 20
cm deep.
2.2 Field and laboratory works
In 2005 all trees in the research plot were numbered and their biometric characteristics – the
height and the girth of the stem at breast height (using the VERTEX III altimeter and a tape)
– were measured. The measuring was repeated annually, always after the end of the
growing season. In 2010 individual trees were surveyed by means of the FieldMap (IFER)
technology; the obtained data were used for the creation of a 3D visualization of the
research plot (Fig.1), using SVS application.
Fig. 1. 3D visualisation of research plot in age of 11 years
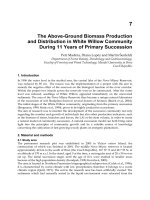
In order to gain production characteristic of the stand, the method published by Newbould
(1967) was used in a form slightly modified by authors.
Six sample trees of different DBH (diameter at breast height) classes were destructively
sampled during the research. The sample trees were taken from adjacent stands; the
research plot was left for solely natural succession.
After felling, the sample trees were divided into meter sections and their leaves and
branches were gradually removed. Twenty leaves were sampled in each section at random.
The girth of the stem was measured each 20 cm; a cross section was extracted from the stem
basis for the tree-ring analysis; and a part of stem was extracted for the establishment of
wood density.
The removed leaves and branches were dried at a temperature of 105
O
C until they reached
constant weight. The series of 20 leaves from each section were scanned and their area was
measured using the ImageTools application. Further, also these leaves were dried and their
drymass was measured. The volume of wood samples was ascertained using a measuring
cylinder, then the samples were dried again and their drymass was measured.
The Above-Ground Biomass Production and Distribution
in White Willow Community During 11 Years of Primary Succession
113
The energy content accumulated in leaves, branches and wood was found out
calorimetrically (Bomb Calorimeter PARR 1281).
2.3 Data evaluation
The annual measurement of all trees in the research plot was used to calculate:
1. Population density
2. Mortality
3. Number of sample trees in DBH and height classes
4. Mean height and DBH of stem
The drymass of leaves and branches of sample trees were added up for individual sections
to gain the total drymass. The volume of stem was calculated using the formula for the
blunted cone volume as the sum of volume of the 20cm sections. The stem drymass was
calculated from the wood density by multiplying the stem volume. Further, the average
specific leaf area (SLA) for the leaves of individual sections was calculated as the quotient of
a leaf drymass and its area. The SLA value was then used to calculate the area of leaves in
individual sections from the total leaf drymass.
To derive the values of growth characteristics of sample trees non-linear Gompertz function
was used:
Y = (a*exp (- b*exp (- c*x))) – d, (1)
(1)
where “Y” is the mean value of biomass of sample trees in each DBH class, “x” is the mean
diameter at breast height in cm for the particular DBH class, and coefficients a, b, c, d are
presented in Table 1.
Growth quantity Coefficients Regression coefficient Mean error
a b c d [%]
Stem volume 595
5.9 0.0925
3.0 0.992 8.56
Stem biomass 235
5.3 0.08 2.4 0.993 2.61
Branch biomass 98.8
10.15
0.095 0.0 0.999 0.35
Leaf biomass 5.5 8.8 0.16 0.008
0.993 0.13
Table 1. Regression coefficient, mean error and the coefficients of the non-linear Gompertz
function used for the processing of the biomass of White Willow sample trees
The data valid for a stand area unit (1 ha) were obtained by multiplying the mean values by
the number of trees in each class and their summarization. The non-linear Gompertz
functions were used to process the data of the White Willow biomass as they express the
data very well, which is proved by the high values of regression coefficients (Table 1).
3. Results
3.1 Population density development
The community of the White Willow sprang up as a cohort on the island – all trees are of the
same age and the same species. In such a community the predominating relationship is
intraspecific competition, which leads to high mortality related to the growth of individuals.
This process is referred to as self-thinning and it follows the 3/2 rule (Slavíková, 1985). The
development of the population density in the research plot (Fig. 2) complies with this
ecological law.
Biomass and Remote Sensing of Biomass
114
Fig. 2. Population density (No. of trees per hectar). development during succession
The gradual transition of trees from lower DBH classes to higher ones is expressed in Table
2. We can see the diversification of DBH values and the considerable mortality of trees in the
lowest DBH classes which is caused by the lack of radiation in the lowest stand layers. With
the succession of the community, the canopy closure expressed by LAI (see chapter 3.3)
increases and for a light-demanding species, such as the White Willow, the amount of
radiation soon drops under the value of the photosynthesis compensation point.
The mortality in the second year of succession rose to 50%, then it dropped to about a third.
The key moment came in the sixth year of succession when the intra-annual mortality
reached 85%, which was reflected in the productivity stagnation. Since this year, the intra-
annual mortality decreased gradually to 51%, 12%, and 9%. The total mortality after 11 years
reached 99%!
3.2 Tree size development
The gradual development of the mean DBH and the mean height is presented in Figures 3
and 4. At the age of 11, the average annual height increment was 1.4 m and the average
annual diameter increment was 1.2 cm. However, the maximum height of dominant trees is
up to 22.6 m and the maximum DBH is 28.6 cm. The stand now manifests a clear division
into height layers. The height increment started to slow down from the age of 9, in contrast
to the diameter increment, which continues with approximately the same speed. Moreover,
the increase in the mean DBH is more noticeable thanks to the mortality of the trees from the
lowest DBH classes.
3.3 Leaf area development
The difference in the SLA between the leaves in the shade and the leaves in the sun was
considerable. The lowest SLA value of the leaves at the crown base of subdominant trees
was 0.00433 g*cm
-1
; on the other hand, the highest SLA value measured in the sunny leaves
at the crown top of dominant trees was 0.12748 g*cm
-1
. Therefore, the same drymass of
sunny leaves takes a thirty times smaller area.
The Above-Ground Biomass Production and Distribution
in White Willow Community During 11 Years of Primary Succession
115
DBH class Succession age
[cm] 1 2 5 6 7 9 10 11
I (0.00–1.00) 247600 46880 8533 200 10 0 0 0
II (1.00–2.00)
78160 27733 1260 450 70 10 20
III (2.0–3.00)
20667 1670 490 70 10 10
IV (3.00–4.00)
6800 1740 480 60 50 0
V (4.00–5.00)
2400 1340 610 60 40 10
VI (5.00–6.00)
2133 1060 670 100 60 50
VII (6.00–7.00)
800 710 680 230 120 120
VIII (7.00–8.00)
400 680 470 230 230 70
IX (8.00–9.00)
267 380 410 250 180 140
X (9.00–10.00)
400 380 210 170 170
XI (10.00–11.00)
530 360 280 220 190
XII (11.00–12.00)
330 380 240 230 220
XIII (12.00–13.00)
220 310 210 190 230
XIV (13.00–14.00)
200 230 300 240 240
XV (14.00–15.00)
70 170 120 160 130
XVI (15.00–16.00)
100 120 230 150 100
XVII (16.00–17.00)
30 50 120 200 120
XVIII (17.00–18.00)
30 60 110 110 200
XIX (18.00–19.00)
30 80 90 60
XX (19.00–20.00)
80 130 100
XXI (20.00–21.00)
40 50 130
XXII (21.00–22.00)
10 70 80
XXIII (22.00–23.00)
10 20 40
XXIV (23.00–24.00)
10 30
XXV (24.00–25.00)
0
XXVI (25.00–26.00)
10
XXVII (26.00–27.00)
0
XXVIII (27.00–28.00)
10
XXIX (28.00–29.00)
10
Total 247600 125040 69733 10950 6360
3110
2740 2490
Table 2. The numbers of trees in DBH classes during succession
Biomass and Remote Sensing of Biomass
116
Fig. 3. The development of the stand mean diameter at breast height [cm] during 11 years of
succession
Fig. 4. The development of the stand mean height [m] during 11 years of succession
The Above-Ground Biomass Production and Distribution
in White Willow Community During 11 Years of Primary Succession
117
The distribution of leaf area in the stand at different ages is visualized in Fig. 5 – there is an
obvious shift of the crown space to higher layers or higher DBH classes and from the age of
9 the stand started to create particular layers; at the age of 11 there are three obvious layers
and there are a few dominant trees.
Fig. 5. The distribution of leaf area [m
2
] in DBH classes in the White Willow stand during the
succession
As regards the total leaf area, its development can be clearly shown using the leaf area index
(LAI) (Fig. 6). In eleven years the initial negligible LAI values at the beginning of the
succession grew up to a relatively high value of 6.6.
3.4 Biomass production development
3.4.1 Stem volume
The stem volume is a basic production characteristic of forest stands. The development of
the wood volume storage during the succession is presented in Fig. 7.
There is a clear fast increase in hectare storage during the first years of succession; from the
age of 6 it decreases. The age of 6 is of key significance from the point of view of potential
effectiveness of harvest. The stand had already achieved very high storage – 244.6 m
3
.ha
-1
–
with the mean DBH 5.2 cm and height 8.5 m. Moreover, the six-year-old stand reached the
highest average annual increment – 40.75 [m
3
*ha
-1
*a
-1
].
Fig. 8 shows that in the first two years of succession the entire storage was concentrated in
the low DBH classes (up to 2 cm); at the age of 5, the core of the storage is still in the lowest
DBH class but a considerable part is transferred to DBH classes up to 9 cm. In the sixth and
seventh year of the succession the storage is quite evenly distributed in DBH classes 2–19 cm
Biomass and Remote Sensing of Biomass
118
Fig. 6. The development of the leaf area index of the White Willow stand during 11 years of
succession
Fig. 7. The development of the wood volume storage in stems [m
3
.ha
-1
] during succession
connected by a trend curve and the development of the average annual volume increment
[m
3*
ha
-1*
a
-1
]
The Above-Ground Biomass Production and Distribution
in White Willow Community During 11 Years of Primary Succession
119
with the maximum in 10–16 cm. In the last four years of succession, the wood storage in
stems is gradually moved to the higher DBH classes and divided into three groups, with the
concurrent decrease in significance of the trees in the lower DBH classes, which die out due
to the intraspecific competition for light. The trees with diameters from 10 to 23 cm become
the bearers of production. This fact is important for the selection of the optimum harvesting
and transport technology.
Fig. 8. The distribution of the stem volume storage [m
3
*ha
-1
] in DBH classes during
succession
3.4.2 Stem drymass
The drymass stored in stems expresses the production of the community better as the wood
of fast-growing woody species has a relatively low density. The density we calculated for
the White Willow (as the quotient of the volume of a fresh sample and drymass) was 337
kg*m
-3
.
The drymass accumulated in the stems is expressed in the following graph (Fig. 9). At the
age of 11, the community reached 102 t*ha
-1
, but similarly to the values of stem volume, we
can see the decrease in intra-annual growth starting at the age of 6. The average annual
increment at the age of 6 was 14.38 t*ha
-1
*a
-1
.
Biomass and Remote Sensing of Biomass
120
Fig. 9. The development of the total production of biomass accumulated in the stems during
succession expressed in drymass [t*ha
-1
]
Fig. 10. The development of the total production of biomass accumulated in the branches
during succession expressed in drymass [t*ha
-1
]
The Above-Ground Biomass Production and Distribution
in White Willow Community During 11 Years of Primary Succession
121
3.4.3 Branch drymass
The branch biomass can also be used as an energy material. The drymass accumulated in the
branches is visualized in Fig. 10. At the eleventh year of the community succession, the
branch drymass reaches 22.29 t*ha
-1
, which is considerable 17% out of the total biomass.
3.4.4 Leaf drymass
The development of the assimilation apparatus expressed by the leaf drymass in the
individual years of succession shows an increasing production capacity of the community
(Fig. 11).
Fig. 11. The development of the total production of biomass accumulated in the leaves
during succession expressed in drymass [t*ha
-1
]
In the eleventh year of succession the leaf drymass exceeded 5 t*ha
-1
; it was 3.9% out of the
total drymass of the above-ground biomass accumulated in the stand.
3.4.5 Total drymass
The total production of the above-ground biomass of the community is a sum of the
drymass of the stems, branches and leaves. Its development in the individual years of the
succession is presented in Fig. 12. At the age of 11 the total production of the community
above-ground biomass reached 129.4 t*ha
-1
.
Fig. 13 shows the relative proportions of the drymass of the stems, branches and leaves in
the total drymass of the above-ground biomass. The proportion of the stem drymass in
comparison with branch and leaf drymass is the lowest in the initial stages of succession
(80%). At the age of 5 the proportion of stem drymass is the highest and since this moment
the proportion of branch and leaf drymass increases at the expense of the stem. Finally, in
the eleventh year, the relative proportion of stem drymass is again 80%.
Biomass and Remote Sensing of Biomass
122
Fig. 12. The development of the total production of the community above-ground biomass
during succession expressed in drymass [t*ha
-1
]
Fig. 13. The relative proportion of stem drymass (red), branch drymass (green) and leaf
drymass (blue) during succession
The Above-Ground Biomass Production and Distribution
in White Willow Community During 11 Years of Primary Succession
123
Another visualization of the distribution of drymass of the above-ground biomass in the
stand during the succession is provided in the following graph (Fig. 14). In the initial stages
of succession the lowest DBH classes are of the highest production significance in the
community. This continues until the age of 5. Between the fifth and the sixth year of
succession a significant change occurs in the structure of the stand. As the lowest DBH class
trees had died, the trees of higher DBH classes gained space and their diameter increments
started to increase fast. This trend, although slower, remains in the following years up to the
age of 10. The eleventh year brought about another big leap of the plants into the higher
DBH classes.
The average annual production of the above-ground biomass expressed in drymass reaches
11.77 t*ha
-1
; however, the maximum values are ascertained for the age of 6, when the
average annual production was 16.72 t*ha
-1
.
Fig. 14. The distribution of the total drymass of the above-ground biomass [t*ha
-1
] in DBH
classes during succession
3.5 Community energy output
The content of energy accumulated in the above-ground biomass (of leaves, branches and
wood) is presented in the following graph (Fig. 15). The average content of energy measured
was 18.15 KJ*g
-1
for leaves, 18.16 KJ*g
-1
for branches and 17.83 KJ*g
-1
for wood.
As regards the average annual content of energy accumulated in the stand above-ground
biomass (Fig. 16), the highest values were reached at the age of 6 – 298,827 MJ*ha
-1
. The
Biomass and Remote Sensing of Biomass
124
Fig. 15. The content of energy (MJ*ha
-1
) accumulated in stems (red), branches (green) and
leaves (blue) of the stand during the succession
Fig. 16. The average annual content of accumulated energy [MJ*ha
-1
] in the stand during the
succession
The Above-Ground Biomass Production and Distribution
in White Willow Community During 11 Years of Primary Succession
125
values then decreased until they dropped to 214,000 MJ*ha
-1
in the ninth year; subsequently,
the average annual content of accumulate energy remains more or less constant.
The same progress is also manifested by the stand output (Fig. 17), expressed in kW*ha
-1
: the
highest value, 9.48 kW*ha
-
1, is reached at the age of 6, and in the eleven-year-old stand the
output drops to 6.68 kW*ha
-1
.
Fig. 17. The output of 1 ha of the stand during the succession [kW*ha
-1
]
4. Conclusion
The paper describes selected production characteristics of a community of the White Willow
which originated by means of natural oecesis on a newly constructed island in the middle of
a water reservoir. The community succession was monitored for 11 years. During this
period the stand developed completely naturally without any human interventions. The
results were used to create a model of production properties of a natural ecosystem which
can serve as a foundation for possible management rules for energy stands of the same
species in similar conditions, such as bank stands or polders (Maděra et al., 2009).
The results prove that the production of the above-ground biomass is very high in the
monitored community of the White Willow. The highest average annual values of all
monitored production characteristics were achieved at the age of 6 of the stand. The
estimated value of drymass production is very favourable exceeding the majority of species
which are grown for energy purposes in Central Europe. The values exceed the data
measured by Bungart et al. (2000) in the region of Lusatia, Germany for 3–4-year-old stands
of willows and poplars in mining areas approximately ten times. Kajba et al. (2004) mention
that the overall mean DM production of all the investigated clones was 6.5 tons per hectare,
the greatest production was exhibited by clones 'B44', 'V093' and 'V052' (10.2, 9.2 and 9.1
t*ha
-1
, respectively).
Biomass and Remote Sensing of Biomass
126
Based on the obtained results, from the perspective of production the most appropriate
moment for harvest in case of energy stands of the White Willow appears to be when a
stand reaches six years of age.
5. Acknowledgment
The study was supported by the research project MSM 6215648902 and Internal Grant
Agency of Faculty of Forestry and Wood Technology Mendel University in Brno 12/2010.
6. References
Bergmann, J.H. (1999). The occurrence of willow in natural succession of lowlands of north
eastern Germany. Beitrage für Forstwirtschaft und Landschaftsökologie, Vol.33,
No.4, pp. 186-187
Buček, A.; Maděra, P. & Packová, P. (2004). Evaluation and prediction of the geobiocoenosis
development in the Nature Reserve Věstonická nádrž reservoir, Mendel University
of Agriculture and Forestry, ISBN 978-80-7157-781-2, Brno
Bungart, R.; Bens, O.; Hüttl, R.F. (2000). Production of bioenergy in post-mining landscapes
in Lusatia. Perspectives and challenges for alternative landuse systems. Ecological
Engineering, Vol.16, Supplement 1, pp. 516, ISSN 0925-8574
Culek, M. (ed.), (1996). Biogeographical differentiation of the Czech Republic. Enigma, ISBN
80-85368-80-3, Prague.
Kajba, D.; Bogdan, S.; Katicic-Trupcevic, I. (2004): White willow biomass production in a
short rotation clonal test Drávida. Sumarski –List, Vol.128, No.910, pp. 509515,
ISSN 0373-1332
Konůpek, J. (1998). Natural development dynamic of early succession stages of floodplain
forest in Dyje and Svratka rivers alluvium. Thesis, Mendel University of
Agriculture and Forestry, Brno.
Kovářová, P. (2003). Development of woody species communities in the supraregional
biocorridor built in the middle water reservoir of Nové Mlýny. Ekológia
(Bratislava), Vol.22, Supplement 2, pp. 231-142, ISSN 1335-342X
Maděra, P.; Packová, P.; Manjarrés, D.R.L.; Štykar, J. & Simanov, V. (2009). The model of
potential biomass production in Odra River basin. Ekológia (Bratislava), Vol.28,
No.2, pp. 170-190, ISSN 1335-342X
Matic, S. ; Vukelic, J. & Anic, I. (1999). Succession and sylvicultural treatments in riparian
forests of the Croatian Podunavlje region. Ekológia (Bratislava), Vol.23,
Supplement 1, pp. 191-204, ISSN 1335-342X
Newbould, P.J. (1967). Methods for estimating the primary production of forest. Blackwell
Scientific Publications, Oxford and Edinburgh.
Slavíková, J. (1985). Plant Ecology. SPN, Prague
Quitt, E. (1971). Klimatische Gebiete der Tschechoslowakei. Studia geographica, ČSAV,
Brno.
Part 2
Remote Sensing of Biomass
8
Introduction to Remote Sensing of Biomass
Muhammad Aqeel Ashraf
1
, Mohd. Jamil Maah
1
and Ismail Yusoff
2
1
Department of Chemistry, University of Malaya,
2
Department of Geology, University of Malaya,
Malaysia
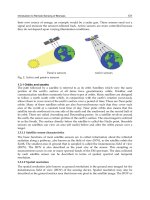
1. Introduction
Planet Earth is distinguished from other Solar System planets by two major categories:
Oceans and Land Vegetation. The oceans cover ~70% of the Earth's surface; land comprises
30%. On the land itself, the first order categories break down as follows: Trees = 30%;
Grasses = 30%; Snow and Ice = 15%; Bare Rock = 18%; Sand and Desert Rock = 7%. Remote
sensing has proven a powerful "tool" for assessing the identity, characteristics, and growth
potential of most kinds of vegetative matter at several levels (from biomes to individual
plants). Vegetation behaviour depends on the nature of the vegetation itself, its interactions
with solar radiation and other climate factors, and the availability of chemical nutrients and
water within the host medium (usually soil, or water in marine environments). A common
measure of the status of a given plant, such as a crop used for human consumption, is its
potential productivity (one such parameter has units of bushels/acre or tons/hectare, or
similar units). Productivity is sensitive to amounts of incoming solar radiation and
precipitation (both influence the regional climate), soil chemistry, water retention factors,
and plant type, keeping in mind that various remote sensing systems (e.g., meteorological or
earth-observing satellites) can provide inputs to productivity estimation.
Remote sensing can be broadly defined as the collection and interpretation of information about an
object, area, or event without being in physical contact with the object. Aircraft and satellites are the
common platforms for remote sensing of the earth and its natural resources. Aerial
photography in the visible portion of the electromagnetic wavelength was the original form of
remote sensing but technological developments has enabled the acquisition of information at
other wavelengths including near infrared, thermal infrared and microwave. Collection of
information over a large numbers of wavelength bands is referred to as multispectral or
hyperspectral data. The development and deployment of manned and unmanned satellites
has enhanced the collection of remotely sensed data and offers an inexpensive way to obtain
information over large areas. The capacity of remote sensing to identify and monitor land
surfaces and environmental conditions has expanded greatly over the last few years and
remotely sensed data will be an essential tool in natural resource management.
1.1 Electromagnetic energy
The electromagnetic (EM) spectrum is the continuous range of electromagnetic radiation,
extending from gamma rays (highest frequency & shortest wavelength) to radio waves
(lowest frequency & longest wavelength) and including visible light.
Biomass and Remote Sensing of Biomass
130
The EM spectrum can be divided into seven different regions —— gamma rays, X-rays,
ultraviolet, visible light, infrared, microwaves and radio waves.
Fig. 1. Electromagnetic radiation spectrum
Remote sensing involves the measurement of energy in many parts of the electromagnetic
(EM) spectrum. The major regions of interest in satellite sensing are visible light, reflected
and emitted infrared, and the microwave regions. The measurement of this radiation takes
place in what are known as spectral bands. A spectral band is defined as a discrete interval
of the EM spectrum. For example the wavelength range of 0.4μm to 0.5μm (μm =
micrometers or 10-6m) is one spectral band. Satellite sensors have been designed to measure
responses within particular spectral bands to enable the discrimination of the major Earth
surface materials. Scientists will choose a particular spectral band for data collection
depending on what they wish to examine.
The design of satellite sensors is based on the absorption characteristics of Earth surface
materials across all the measurable parts in the EM spectrum.
1.2 Reflection and absorption
When radiation from the Sun reaches the surface of the Earth, some of the energy at specific
wavelengths is absorbed and the rest of the energy is reflected by the surface material. The
only two exceptions to this situation are if the surface of a body is a perfect reflector or a true
black body. The occurrence of these surfaces in the natural world is very rare. In the visible
region of the EM spectrum, the feature we describe as the colour of the object is the visible
light that is not absorbed by that object. In the case of a green leaf, for example, the blue and
red wavelengths are absorbed by the leaf, while the green wavelength is reflected and
detected by our eyes.
In remote sensing, a detector measures the electromagnetic (EM) radiation that is reflected
back from the Earth’s surface materials. These measurements can help to distinguish the
type of land covering. Soil, water and vegetation have clearly different patterns of
reflectance and absorption over different wavelengths. The reflectance of radiation from one
type of surface material, such as soil, varies over the range of wavelengths in the EM
spectrum. This is known as the spectral signature of the material.
1.3 Sensors and platforms
A sensor is a device that measures and records electromagnetic energy. Sensors can be
divided into two groups. Passive sensors depend on an external source of energy, usually
the sun. The most common passive sensor is the photographic camera. Active sensors have